Modern JavaScript debugging
Due to the fairly wide choice of quite good debuggers, JavaScript programmers can get a lot of value by learning how to use them. Their user interfaces are becoming more sophisticated, more standardized among themselves and easier to use, which makes them useful for both experts and beginners in debugging JS. In this article, we will discuss advanced debugging methods for diagnosing and analyzing errors using a typical web application.
Debugging tools are currently available for all major browsers.
At the moment, Firebug and Dragonfly are the most stable. IE8 utilities sometimes ignore control points, and at the time of this writing, WebInspector has some compatibility issues with the latest Webkit builds.
Explore several debugging tools — you never know in which browser the following error will occur. Since debuggers are roughly comparable in functionality, it is easy to switch between them as soon as you figure out how to use at least one.
')
Bumping into a specific problem, you will usually go through the following steps.
To create a breakpoint, you can also add a special debugger instruction to your code:
Most debuggers require the code to be well formatted. Scripts written “in one line” make it difficult to detect errors in a line-by-line debugger. Obfuscated code is extremely difficult to debug, especially packed. Many JavaScript libraries allow you to choose between packed / obfuscated and normally formatted versions, of course, you need to debug the scripts with the latter.
Let's start with a small, specially “forgotten” example to learn how to find and correct errors. Our example is the login page .
Imagine that you are working on this incredible new web application, and your testers have asked you to correct the following errors:
It's time to launch debuggers. Since some instructions require code changes, you should save the test page and load it with a browser from the disk.
If you look at the application being debugged, then first you will see what is shown in Figure 1.


rice 1: The initial view of our JavaScript applications in Dragonfly and Firebug, respectively.
When you look at the source code in the debugger, pay attention to the clearLoadingMessage () function at the very beginning of the code. This is a good place for a checkpoint.
How to put it:
Note: the checkpoint must be set on the line with the code that will be executed when the function is launched. The string that contains clearLoadingMessage () {is not appropriate, since it is only a function definition. If you set a breakpoint here, the debugger on it will not stop, instead the breakpoint must be set inside the function.
When the page is reloaded, the execution of the script will stop and you will see what is shown in Figure 2.


rice 2: The debuggers stopped at the control point inside clearLoadingMessage.
Let's take a look at the function code. As it is easy to see, it updates two DOM elements, and the word statusbar is mentioned in line 31. It looks like getElements ('p', {'class': 'statusbar'}) [0] .innerHTML is looking for the statusbar element in the DOM tree. How would we quickly check our guess?
Paste this instruction to the command line to check. Figure 3 shows three screenshots (Dragonfly, Firebug and IE8) after reading an innerHTML or outerHTML element returned by the command you are examining.
To check do the following:


rice 3: output the command result to Dragonfly, Firebug, and IE8, respectively.
The command line is a very useful tool that allows you to quickly check small pieces of code. Firebug console integration is very useful - if your team displays an object, you get a very intelligent view. For example, if this is a DOM object, you will see the marked result.
You can use the console to do more research. The JavaScript string we are studying does the following three things:
Let's try to run in the console, something more than the previous command. For example, you can try to find out what the current value of the innerText property is before it is assigned a new value. To find out, you can type the entire command before the "=" sign on the command line:
Surprise, at the exit ... nothing. Thus, the expression getElements ('p', {'class:' statusbar ''}) [0] .firstChild points to an obtext in the DOM that does not contain any text, or does not have an innerText property.
Then, the next question: what is actually the first child of a paragraph? Let's ask this question in the command line. (See fourth picture).

rice 4: debugger command line Stragonfly, output [Text object].
Dragonfly's debugger output - [Text object] indicates that this is a text DOM node. So we found the cause of the first problem. The text node does not have an innerText property, therefore setting a value for p.firstChild.innerText does nothing. This error can easily be fixed by replacing innerText with nodeValue, which is a property defined by the W3C standard for text nodes.
Now, after we dealt with the first error:
You may have noticed the lang; / * language * / variable at the beginning of the script. It can be assumed that the code setting the value of this variable causes the problem. You can try to find this code using the search function built into the debuggers. In Dragonfly, the search is located directly above the code viewer, in Firebug - in the upper right corner (see Figure 5)
To find a place where a localization problem probably occurs, do the following:
WebInspector also has a very convenient search function. It allows you to search for anything at the same time in the page markup, in CSS, and in JavaScript code. The results are displayed on a separate panel, where you can double-click on them to go to the right place, as shown in the screenshot.


rice 5: Search in Dragonfly and in WebInspector.
To check what this function does:
Upon entering the function, you will see an attempt to read the language from the browser user-agent string by analyzing navigator.userAgent.
In the process of stepping through the code, you can use the window for viewing local variables. Figure 6 shows how it looks in Firebug and IE8 DT, we deployed the ar1 array to see its elements.

rice 6: View local variables of the getLanguage function in Firebug IE8’s
The expression ar1 [i] .match (/ ^ (. {2}) $ /) simply searches for a string consisting of two characters, such as "no", "en". However, as seen in the screenshot of Firefox, the language information is presented in the form “nn-NO” (2) . IE doesn’t put language information into the user agent at all.
Thus, we found the second error: the language was determined by searching for a two-letter code in the user agent string, but Firefox has a five-character language designation, but IE does not have it at all. This code should be rewritten and replaced with a language definition either on the server side using the Accept-Language HTTP header, or retrieving it from navigator.language (navigator.userLanguage for IE). Here is an example of what this function might be.

rice 7: The global variable prop is visible in the Firebug and Dragonfly variables view pane.
Figure 7 clearly shows the variable "prop". In well-written applications, the number of global variables should be minimal, since they can cause problems when, for example, two parts of an application want to use the same variable. Suppose that tomorrow another team will add new features to our application and will also announce the variable “prop”. We get two different parts of the application code that use the same name for different things. This situation often leads to conflicts and errors. You can try to find this variable and declare it local. To do this, you can use the search, as we did in the previous case, but there is a smarter way ...
Debuggers for many other programming languages have the notion of “watch” (watch), which goes into debug mode when a given variable changes. Neither Firebug nor Dragonfly currently supports “watchers”, but we can easily emulate similar behavior by adding the following line to the beginning of the code being examined:
Do the following:
In IE8 DT, there is a “Watch” tab, but there is no interruption at the time the variable is changed. So this example only works in Firefox, Opera and Safari.
When you reload the page, the code execution will immediately stop where the variable “prop” will be defined. In fact, the stop will occur in the place where you added the above line. One click on the “step out” button will take you to the place where the variable is set.
It is easy to notice the for loop in which the variable prop is declared without the var keyword, i.e. global. It is easy to fix, just add var and correct the error.
The fourth error was obviously detected by an advanced tester using the DOM Inspector, since its existence does not manifest itself in the application's user interface. If we open the DOM inspector (in Firebug this is the “HTML” tab, in Dragonfly it is called “DOM”), then we will see that many elements have the clone attribute, which should not be.

rice 8: Dragonfly's DOM Inspector shows the problem code.
Since this does not affect the users of the application in any way, you can not consider this bug serious, but you should not forget that it can significantly affect the performance, because the script sets the attribute on hundreds and thousands of elements.
The fastest way to find this problem is to set a breakpoint that works when an attribute with the name clone is set for some HTML element. Can debuggers do this?
JavaScript is a very flexible language, and one of its strengths (or weaknesses, depending on your point of view) is that you can replace the basic functions of a language with your own. Add this piece of code to the page, it will override the system setAttribute method, causing the code to stop when the “clone” property is set:
So, do the following:
After a reboot, the script starts processing the DOM tree, but stops immediately as soon as the “bad” attribute is set. (Note that in current versions of Firefox, the implementation of setAttribute is different for different elements. The code above always works as it should only in Opera; to get the same effect in Firefox, you can replace the word Element with HTMLFormElement to override the more specific method HTMLFormElement.prototype.setAttribute).
When the execution stops at the control point, you will want to know where the setAttribute () call occurred, that is, you need to go back a level in the chain of function calls and see what happens there. For this you can use the call stack.
rice 9: Call stack in Dragonfly and IE8.
Figure 10 shows the stack in Firebug. In the line " setAttribute <makeElement <init ", next to the file name itself, the most left-handed one is the current capture function.

rice 10: Firebug Call Stack. The most recent function called on the left.
By clicking on the function names in the stack, you can determine how you got to this point. It is very important to try it yourself to understand how it works. Note that when you navigate the stack, the contents of the local variables panel are also updated, showing their status at the moment when the function you selected is running.
How to use call stack to find problem function:
Choosing makeElement will take us to another part of the code:
where you will see a call to setAttribute. The panel of local variables shows that the value of the variable "prop" is really "clone". The variable prop is defined in a for ... in loop. This tells us that this is the name of one of the properties of the "attributes" object. This object is passed to the function by the second parameter. If you go up the stack one more level, you will see the following code:
The second parameter of the method is highlighted in bold - this object does not have a clone property. So where does it come from?
Let's go back to the makeElement function and take a closer look at the attribute variable and its “clone” property. You can click on the value function of this property to go to the place where it is assigned, it will be highlighted in blue

rice 11: Firebug shows us where the clone property was defined.
So we found the reason for the fourth error: the clone method is added to all objects using Object.prototype. Such an approach is considered a bad practice, because in the for-in cycles of the objects all the properties that you set via the Object.prototype will be visible. This can lead to very difficult errors.
To correct this error, you can move the clone method from the object's prototype directly into the object itself, and then replace all obj.clone () calls with Object.clone (obj), as shown in the example:
Do better like this:
If you have problems understanding or using any parts of this article, do not worry! Mastering the basics will make you a more professional developer and ultimately you will develop your own set of techniques for use.
1 In order to enable the debugging / development menu in Safari, you need to go to “Edit -> Settings -> Advanced” and put the checkbox “Enable menu“ Development ”, after which the item“ Develop ”will appear in the browser menu (non-official name: )).
2 For the Russian language, this is not entirely relevant and the code will work, because in FF, the code looks like “ru”. But this is only because Russian is one, and Norwegian is two. Apart from other shortcomings, if your code will be used with other languages, you should not do this
Debugging tools are currently available for all major browsers.
- Firefox has a well-known Firebug extension.
- IE8 comes with embedded Developer Tools
- Opera 9.5+ supports the Dragonfly debugger
- Safari has a Drosera JS debugger and a WebInspector DOM viewer. In more recent versions, the debugger is integrated into WebInspector.
At the moment, Firebug and Dragonfly are the most stable. IE8 utilities sometimes ignore control points, and at the time of this writing, WebInspector has some compatibility issues with the latest Webkit builds.
Explore several debugging tools — you never know in which browser the following error will occur. Since debuggers are roughly comparable in functionality, it is easy to switch between them as soon as you figure out how to use at least one.
')
Debugging technology
Bumping into a specific problem, you will usually go through the following steps.
- Find the corresponding code in the debugger code viewer.
- Set a control point or point in the place that you think is potentially problematic
- Run the script again by reloading the page or pressing the button if it’s about an event handler.
- Wait for the debugger to stop execution and make step-by-step code execution possible.
- Investigate the values of variables. For example, look for variables that are undefined for some reason, although they should contain a value, or return “false”, although you expect them to return “true”.
- If necessary, use the command line to calculate the code or change the values of variables
- Find the problem by examining the part of the code that caused it and eliminate it.
To create a breakpoint, you can also add a special debugger instruction to your code:
function frmSubmit( event ){
event = event || window. event ;
debugger;
var form = this ;
}
Requirements
Most debuggers require the code to be well formatted. Scripts written “in one line” make it difficult to detect errors in a line-by-line debugger. Obfuscated code is extremely difficult to debug, especially packed. Many JavaScript libraries allow you to choose between packed / obfuscated and normally formatted versions, of course, you need to debug the scripts with the latter.
Debug demonstration
Let's start with a small, specially “forgotten” example to learn how to find and correct errors. Our example is the login page .
Imagine that you are working on this incredible new web application, and your testers have asked you to correct the following errors:
- The “Loading ...” status bar message does not disappear when the application has finished loading.
- The default language is Norwegian, even in English versions of IE and Firefox.
- Somewhere in the code, the global variable prop was formed.
- In the DOM viewer, all elements for some reason have the attribute “clone”.
Running debuggers
- In Firefox, you must make sure that you have the Firebug extension installed. Select “Tools> Firebug> Open Firebug”.
- In Opera 9.5+, select “Tools> Advanced> Development Tools.”
- In IE beta, select “Tools> Panels> Browser Panels> IE Developer Toolbar.”
- In Safari or WebKit, first enable the debug menu (1) , then select “Develop> Show Web Inspector”
It's time to launch debuggers. Since some instructions require code changes, you should save the test page and load it with a browser from the disk.
Mistake number 1: Message “Loading ...”
If you look at the application being debugged, then first you will see what is shown in Figure 1.
rice 1: The initial view of our JavaScript applications in Dragonfly and Firebug, respectively.
When you look at the source code in the debugger, pay attention to the clearLoadingMessage () function at the very beginning of the code. This is a good place for a checkpoint.
How to put it:
- Click in the left field on the line number to set the breakpoint on the first line inside the clearLoadingMessage () function.
- Reload page.
Note: the checkpoint must be set on the line with the code that will be executed when the function is launched. The string that contains clearLoadingMessage () {is not appropriate, since it is only a function definition. If you set a breakpoint here, the debugger on it will not stop, instead the breakpoint must be set inside the function.
When the page is reloaded, the execution of the script will stop and you will see what is shown in Figure 2.
rice 2: The debuggers stopped at the control point inside clearLoadingMessage.
Let's take a look at the function code. As it is easy to see, it updates two DOM elements, and the word statusbar is mentioned in line 31. It looks like getElements ('p', {'class': 'statusbar'}) [0] .innerHTML is looking for the statusbar element in the DOM tree. How would we quickly check our guess?
Paste this instruction to the command line to check. Figure 3 shows three screenshots (Dragonfly, Firebug and IE8) after reading an innerHTML or outerHTML element returned by the command you are examining.
To check do the following:
- Find the command line:
* In Firebug, switch to the “Console” tab.
* In Dragonfly, look below the JavaScript code panel.
* In IE8, find the tab on the right "Console". - Paste getElements ('p', {'class': 'statusbar'}) [0] .innerHTML into the command line.
- Press Enter.
rice 3: output the command result to Dragonfly, Firebug, and IE8, respectively.
The command line is a very useful tool that allows you to quickly check small pieces of code. Firebug console integration is very useful - if your team displays an object, you get a very intelligent view. For example, if this is a DOM object, you will see the marked result.
You can use the console to do more research. The JavaScript string we are studying does the following three things:
- Gets a link to the statusbar element.
- Find firstChild, in other words, the first node in this paragraph.
- Sets the innerText property.
Let's try to run in the console, something more than the previous command. For example, you can try to find out what the current value of the innerText property is before it is assigned a new value. To find out, you can type the entire command before the "=" sign on the command line:
getElements( 'p' , { 'class' : 'statusbar' } )[0].firstChild.innerText
Surprise, at the exit ... nothing. Thus, the expression getElements ('p', {'class:' statusbar ''}) [0] .firstChild points to an obtext in the DOM that does not contain any text, or does not have an innerText property.
Then, the next question: what is actually the first child of a paragraph? Let's ask this question in the command line. (See fourth picture).
rice 4: debugger command line Stragonfly, output [Text object].
Dragonfly's debugger output - [Text object] indicates that this is a text DOM node. So we found the cause of the first problem. The text node does not have an innerText property, therefore setting a value for p.firstChild.innerText does nothing. This error can easily be fixed by replacing innerText with nodeValue, which is a property defined by the W3C standard for text nodes.
Now, after we dealt with the first error:
- Press [F5] or the Run button to end the script.
- Do not forget to reset the set control point by clicking on the line number again.
Error two: the problem of determining the language.
You may have noticed the lang; / * language * / variable at the beginning of the script. It can be assumed that the code setting the value of this variable causes the problem. You can try to find this code using the search function built into the debuggers. In Dragonfly, the search is located directly above the code viewer, in Firebug - in the upper right corner (see Figure 5)
To find a place where a localization problem probably occurs, do the following:
- Type lang = in the search field.
- Set a breakpoint on the line where the lang variable is given a value.
- Reload page.
WebInspector also has a very convenient search function. It allows you to search for anything at the same time in the page markup, in CSS, and in JavaScript code. The results are displayed on a separate panel, where you can double-click on them to go to the right place, as shown in the screenshot.
rice 5: Search in Dragonfly and in WebInspector.
To check what this function does:
- Click the “step into” button to enter the getLanguage function.
- Click it again and again, step-by-step executing the code
- In the variable view window, see how their values change.
Upon entering the function, you will see an attempt to read the language from the browser user-agent string by analyzing navigator.userAgent.
var str1 = navigator.userAgent.match( /\((.*)\)/ )[1];
var ar1 = str1.split(/\s*;\s*/), lang;
for ( var i = 0; i < ar1.length; i++){
if (ar1[i].match(/^(.{2})$/)){
lang = ar1[i];
}
}
In the process of stepping through the code, you can use the window for viewing local variables. Figure 6 shows how it looks in Firebug and IE8 DT, we deployed the ar1 array to see its elements.
rice 6: View local variables of the getLanguage function in Firebug IE8’s
The expression ar1 [i] .match (/ ^ (. {2}) $ /) simply searches for a string consisting of two characters, such as "no", "en". However, as seen in the screenshot of Firefox, the language information is presented in the form “nn-NO” (2) . IE doesn’t put language information into the user agent at all.
Thus, we found the second error: the language was determined by searching for a two-letter code in the user agent string, but Firefox has a five-character language designation, but IE does not have it at all. This code should be rewritten and replaced with a language definition either on the server side using the Accept-Language HTTP header, or retrieving it from navigator.language (navigator.userLanguage for IE). Here is an example of what this function might be.
function getLanguage() {
var lang;

if (navigator.language) {
lang = navigator.language;
} else if (navigator.userLanguage) {
lang = navigator.userLanguage;
}

if (lang && lang.length > 2) {
lang = lang.substring(0, 2);
}

return lang;
}
Error three: the mysterious variable "prop"
rice 7: The global variable prop is visible in the Firebug and Dragonfly variables view pane.
Figure 7 clearly shows the variable "prop". In well-written applications, the number of global variables should be minimal, since they can cause problems when, for example, two parts of an application want to use the same variable. Suppose that tomorrow another team will add new features to our application and will also announce the variable “prop”. We get two different parts of the application code that use the same name for different things. This situation often leads to conflicts and errors. You can try to find this variable and declare it local. To do this, you can use the search, as we did in the previous case, but there is a smarter way ...
Debuggers for many other programming languages have the notion of “watch” (watch), which goes into debug mode when a given variable changes. Neither Firebug nor Dragonfly currently supports “watchers”, but we can easily emulate similar behavior by adding the following line to the beginning of the code being examined:
__defineSetter__( 'prop' , function () { debugger; });
Do the following:
- Add debugging code to the beginning of the very first script.
- Reload page.
- Note how the script is interrupted.
In IE8 DT, there is a “Watch” tab, but there is no interruption at the time the variable is changed. So this example only works in Firefox, Opera and Safari.
When you reload the page, the code execution will immediately stop where the variable “prop” will be defined. In fact, the stop will occur in the place where you added the above line. One click on the “step out” button will take you to the place where the variable is set.
for (prop in attributes) {
if (el.getAttribute(prop) != attributes[prop]) includeThisElement = false ;
It is easy to notice the for loop in which the variable prop is declared without the var keyword, i.e. global. It is easy to fix, just add var and correct the error.
Error four: the attribute "clone", which should not be
The fourth error was obviously detected by an advanced tester using the DOM Inspector, since its existence does not manifest itself in the application's user interface. If we open the DOM inspector (in Firebug this is the “HTML” tab, in Dragonfly it is called “DOM”), then we will see that many elements have the clone attribute, which should not be.
rice 8: Dragonfly's DOM Inspector shows the problem code.
Since this does not affect the users of the application in any way, you can not consider this bug serious, but you should not forget that it can significantly affect the performance, because the script sets the attribute on hundreds and thousands of elements.
The fastest way to find this problem is to set a breakpoint that works when an attribute with the name clone is set for some HTML element. Can debuggers do this?
JavaScript is a very flexible language, and one of its strengths (or weaknesses, depending on your point of view) is that you can replace the basic functions of a language with your own. Add this piece of code to the page, it will override the system setAttribute method, causing the code to stop when the “clone” property is set:
var funcSetAttr = Element.prototype.setAttribute; /* */
Element.prototype.setAttribute = function (name, value) {
if (name == 'clone' ) {
debugger; /* */
}
funcSetAttr.call( this ,name,value); /* , */
};
So, do the following:
- Add the given code to the beginning of the first script on the page.
- Reload page.
After a reboot, the script starts processing the DOM tree, but stops immediately as soon as the “bad” attribute is set. (Note that in current versions of Firefox, the implementation of setAttribute is different for different elements. The code above always works as it should only in Opera; to get the same effect in Firefox, you can replace the word Element with HTMLFormElement to override the more specific method HTMLFormElement.prototype.setAttribute).
When the execution stops at the control point, you will want to know where the setAttribute () call occurred, that is, you need to go back a level in the chain of function calls and see what happens there. For this you can use the call stack.
rice 9: Call stack in Dragonfly and IE8.
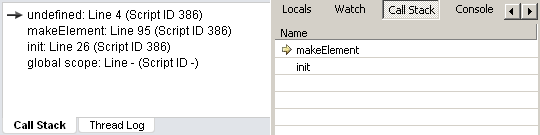
Figure 10 shows the stack in Firebug. In the line " setAttribute <makeElement <init ", next to the file name itself, the most left-handed one is the current capture function.
rice 10: Firebug Call Stack. The most recent function called on the left.
By clicking on the function names in the stack, you can determine how you got to this point. It is very important to try it yourself to understand how it works. Note that when you navigate the stack, the contents of the local variables panel are also updated, showing their status at the moment when the function you selected is running.
How to use call stack to find problem function:
- Click on the name of the function in the stack that you want to see.
- Please note that local variables are updated to the values they have in the selected context.
- Remember that if you use the step-by-step execution buttons, they will move you from the point of the breakpoint, even if you are in another part of the stack.
Choosing makeElement will take us to another part of the code:
for ( var prop in attributes) {
el.setAttribute(prop, attributes[prop]);
}
where you will see a call to setAttribute. The panel of local variables shows that the value of the variable "prop" is really "clone". The variable prop is defined in a for ... in loop. This tells us that this is the name of one of the properties of the "attributes" object. This object is passed to the function by the second parameter. If you go up the stack one more level, you will see the following code:
var form = makeElement('form', { action:'/login', method:'post', name:'loginform' } , document .body);The second parameter of the method is highlighted in bold - this object does not have a clone property. So where does it come from?
Let's go back to the makeElement function and take a closer look at the attribute variable and its “clone” property. You can click on the value function of this property to go to the place where it is assigned, it will be highlighted in blue
rice 11: Firebug shows us where the clone property was defined.
So we found the reason for the fourth error: the clone method is added to all objects using Object.prototype. Such an approach is considered a bad practice, because in the for-in cycles of the objects all the properties that you set via the Object.prototype will be visible. This can lead to very difficult errors.
To correct this error, you can move the clone method from the object's prototype directly into the object itself, and then replace all obj.clone () calls with Object.clone (obj), as shown in the example:
// ,
Object.prototype.clone = function () {
var obj = {};
for ( var prop in this ) {
obj[prop] = this [prop];
}
return obj;
}
// . clone():
var myObj1 = { 'id' : '1' };
var myObj2 = myObj1.clone();
Do better like this:
Object.clone = function (originalObject) {
var obj = {};
for ( var prop in originalObject) {
obj[prop] = originalObject[prop];
}
return obj;
}
// . clone():
var myObj1 = { 'id' : '1' };
var myObj2 = Object.clone(myObj1);
* All source code was highlighted with Source Code Highlighter .
If you have problems understanding or using any parts of this article, do not worry! Mastering the basics will make you a more professional developer and ultimately you will develop your own set of techniques for use.
Notes
1 In order to enable the debugging / development menu in Safari, you need to go to “Edit -> Settings -> Advanced” and put the checkbox “Enable menu“ Development ”, after which the item“ Develop ”will appear in the browser menu (non-official name: )).
2 For the Russian language, this is not entirely relevant and the code will work, because in FF, the code looks like “ru”. But this is only because Russian is one, and Norwegian is two. Apart from other shortcomings, if your code will be used with other languages, you should not do this
Source: https://habr.com/ru/post/51354/
All Articles