Debugging in Django
Django newbies will find it useful to learn about a very useful debugging tool - debug-toolbar . He is so cool that he is called Firebug for Django . On large projects without it (or another debugger) can not do.
Debug-toolbar is a set of panels that appear on a page in debug mode.
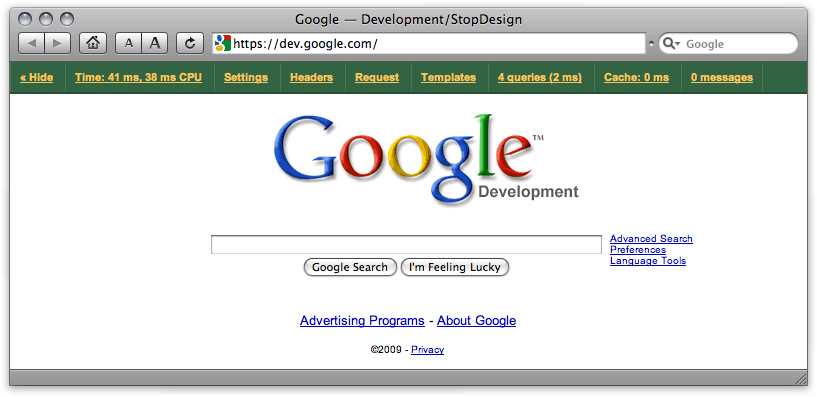
A set of panels can be changed. Currently 9 items are available. Here are some details:
')
Shows the version of Django. I usually disable this panel, because I know the version without prompts, and there is so little space on the screen.
Application run time and number of context switches.
Very harmful tab. If you keep these numbers always before your eyes, you will not be able to deliver the project on time - it will always seem that all operations are performed at least 10 times longer than they could.
Remember: "Premature optimization is the root of all evil."
Here you can see all the Django settings from the settings.py file of this application. I don’t know if there is a big benefit in this - you can always see the config in the file.
Theoretically, there should be HTTP request headers that led to the display of the page being explored. But in fact, on this panel, I see a list of server environment variables:

We need not often, but well, when such information is at hand.
Here you can see cookies for this domain, Django session variables, as well as variables passed in a GET / POST request. You can imagine it without a picture.
The panel of information about the template with which the output occurs. It probably works well when using the native Django template engine. And for outsiders, only the viewing of contexts works:
Powerful stuff. Shows all queries to the database, their execution time and full tracing.
This allows you to identify problem-specific query and easily find it even in the most confusing application with template inheritance. Works for any template engine, like.
By the way, any request can be executed directly from the panel, and also ask for its Explain or even Profile (if the database supports).
The panel allows you to view the acts of writing and reading from the cache, the information received, the time spent and other caching statistics:
For example, in this picture you can see that there was an attempt to take the update_sites key from the cache, but it turned out to be empty (the cache was expired). Then there was an entry in the cache of new data. I want to believe that in the Time column the correct order of numbers and dimension.
This is like console.log ('Hi'). Displays debugging messages from the Python logging module. To get a debug output, you need to connect the module and say something to it:
It is a pity that different levels of messages are not highlighted in color.
Personally, I connect debug_toolbar only in debug mode:
"INTERCEPT_REDIRECTS = False" disables the redirection interception. If you do not disable it, you will first be redirected to the debug page, where it will be described in detail where and from where we were redirected. And the link will click.
EXCLUDE_URLS will theoretically ever turn off the debugger for the specified directories. Left to remember to try after a year. Here still for the necessary subdomains to cut it down ...
The product is a bit damp. Its various minor details may not work or work incorrectly. I had to dig out the template and js-files for about 15 minutes to get the "Hide" button to work. The script requires jquery and cookies plugin (in cookie the state of the panel is closed / open). For some reason, the plugin was connected after the toolbar.js script crashed with an error.
I also spent a lot of time formatting the output of time in all panels: why should I see hundredths of a millisecond? But it's all the little things that are easy to handle or just ignore.
There may be difficulties when using some tricky middleware. I had to modify the class, organizing work with subdomains in a single server.
There are opinions that this fork of this toolbar is slightly better. I can't say for sure about the functionality, but the interface ...
For such an interface debugger someone could sell the soul to the devil! Need to try.
Found a mistake - write to Habrapmail.
Debug-toolbar is a set of panels that appear on a page in debug mode.
A set of panels can be changed. Currently 9 items are available. Here are some details:
')
Version
Shows the version of Django. I usually disable this panel, because I know the version without prompts, and there is so little space on the screen.
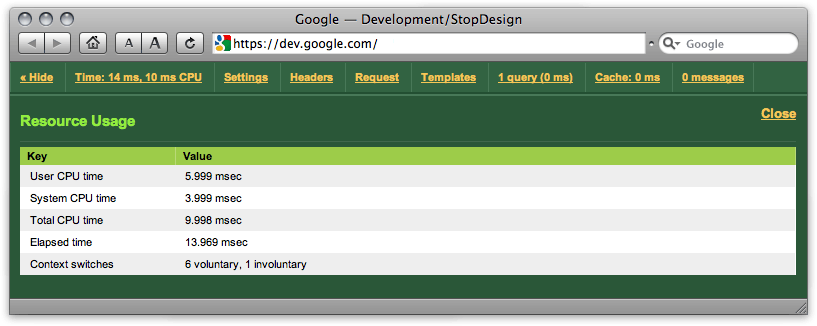
Timer
Application run time and number of context switches.
Very harmful tab. If you keep these numbers always before your eyes, you will not be able to deliver the project on time - it will always seem that all operations are performed at least 10 times longer than they could.
Remember: "Premature optimization is the root of all evil."
SettingsVars
Here you can see all the Django settings from the settings.py file of this application. I don’t know if there is a big benefit in this - you can always see the config in the file.
Headers
Theoretically, there should be HTTP request headers that led to the display of the page being explored. But in fact, on this panel, I see a list of server environment variables:
We need not often, but well, when such information is at hand.
Request
Here you can see cookies for this domain, Django session variables, as well as variables passed in a GET / POST request. You can imagine it without a picture.
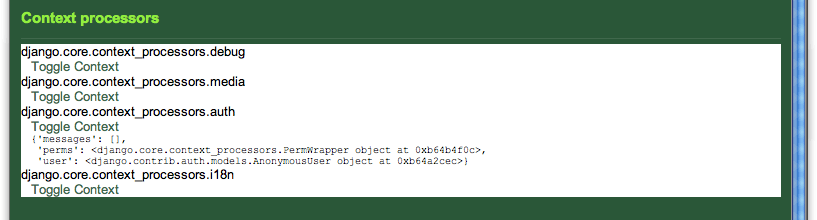
Template
The panel of information about the template with which the output occurs. It probably works well when using the native Django template engine. And for outsiders, only the viewing of contexts works:
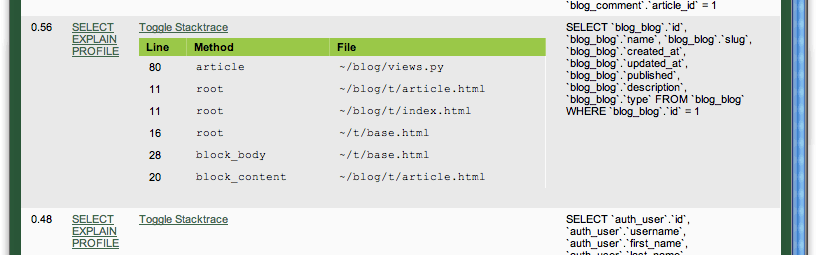
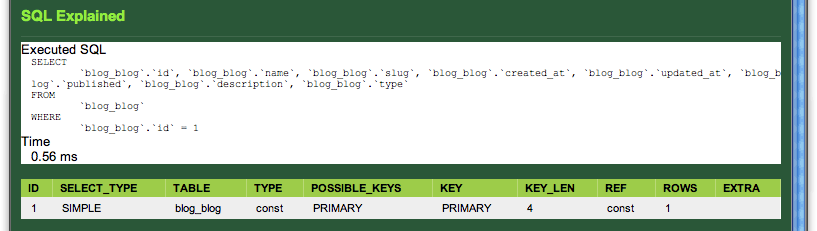
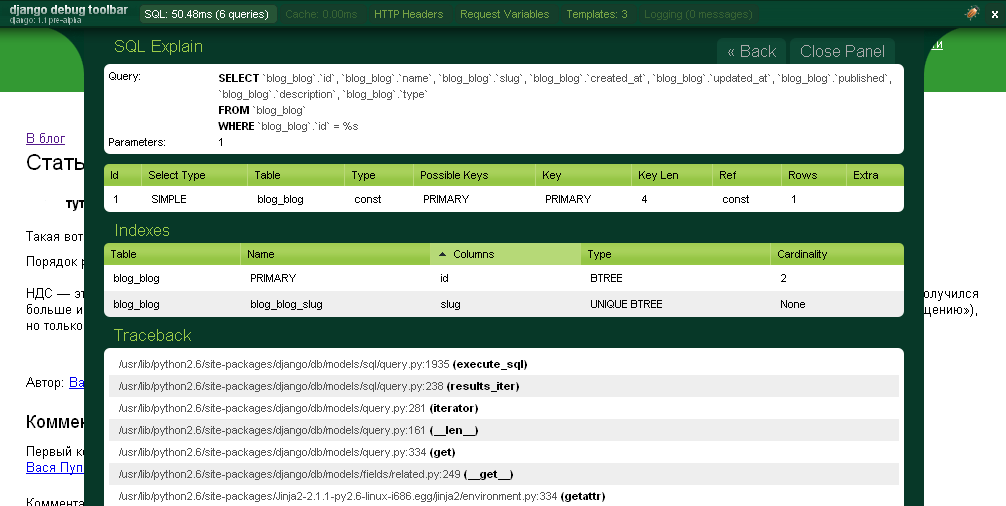
SQLDebug
Powerful stuff. Shows all queries to the database, their execution time and full tracing.
This allows you to identify problem-specific query and easily find it even in the most confusing application with template inheritance. Works for any template engine, like.
By the way, any request can be executed directly from the panel, and also ask for its Explain or even Profile (if the database supports).
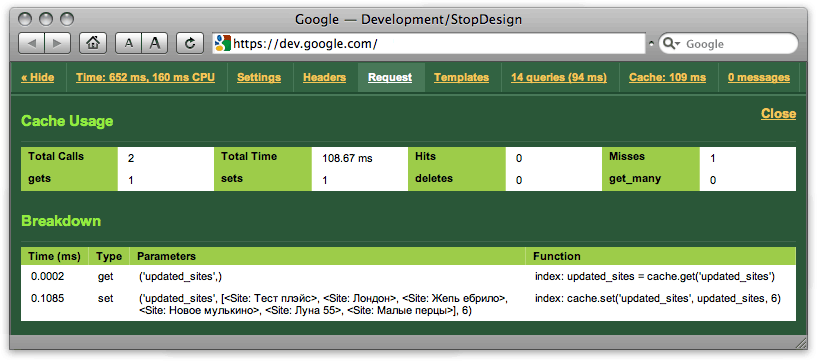
Cache
The panel allows you to view the acts of writing and reading from the cache, the information received, the time spent and other caching statistics:
For example, in this picture you can see that there was an attempt to take the update_sites key from the cache, but it turned out to be empty (the cache was expired). Then there was an entry in the cache of new data. I want to believe that in the Time column the correct order of numbers and dimension.
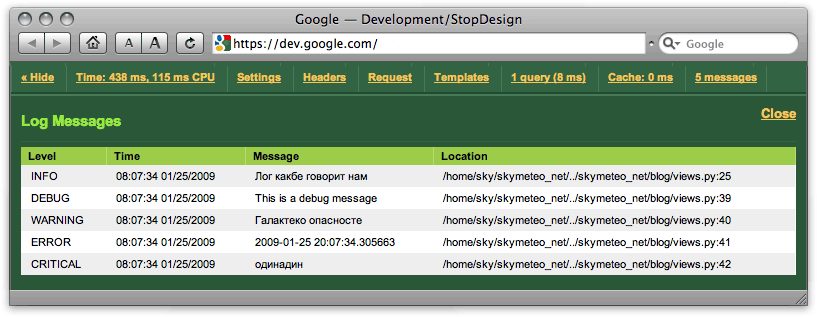
Logging
This is like console.log ('Hi'). Displays debugging messages from the Python logging module. To get a debug output, you need to connect the module and say something to it:
import logging<br> logging.info( ' .' )<br>It is a pity that different levels of messages are not highlighted in color.
How to install
- download something from the official site
- unzip it and run python setup.py install
- add 'debug_toolbar.middleware.DebugToolbarMiddleware' last entry in MIDDLEWARE_CLASSES
- add 'debug_toolbar' to INSTALLED_APPS
- to set up INTERNAL_IPS correctly - list the ip addresses of developers that can be shown Debug
- you can still configure some options for DEBUG_TOOLBAR
Personally, I connect debug_toolbar only in debug mode:
if DEBUG:<br> MIDDLEWARE_CLASSES += ( 'debug_toolbar.middleware.DebugToolbarMiddleware' ,)<br> INSTALLED_APPS += ( 'debug_toolbar' ,)<br> DEBUG_TOOLBAR_PANELS = (<br> #'debug_toolbar.panels.version.VersionDebugPanel', # . . <br> 'debug_toolbar.panels.timer.TimerDebugPanel' ,<br> 'debug_toolbar.panels.settings_vars.SettingsVarsDebugPanel' ,<br> 'debug_toolbar.panels.headers.HeaderDebugPanel' ,<br> 'debug_toolbar.panels.request_vars.RequestVarsDebugPanel' ,<br> 'debug_toolbar.panels.template.TemplateDebugPanel' ,<br> 'debug_toolbar.panels.sql.SQLDebugPanel' ,<br> 'debug_toolbar.panels.cache.CacheDebugPanel' ,<br> 'debug_toolbar.panels.logger.LoggingPanel' ,<br> )<br> DEBUG_TOOLBAR_CONFIG = {<br> 'EXCLUDE_URLS' : ( '/admin' ,), # , ... <br> 'INTERCEPT_REDIRECTS' : False ,<br> }"INTERCEPT_REDIRECTS = False" disables the redirection interception. If you do not disable it, you will first be redirected to the debug page, where it will be described in detail where and from where we were redirected. And the link will click.
EXCLUDE_URLS will theoretically ever turn off the debugger for the specified directories. Left to remember to try after a year. Here still for the necessary subdomains to cut it down ...
Problems
The product is a bit damp. Its various minor details may not work or work incorrectly. I had to dig out the template and js-files for about 15 minutes to get the "Hide" button to work. The script requires jquery and cookies plugin (in cookie the state of the panel is closed / open). For some reason, the plugin was connected after the toolbar.js script crashed with an error.
I also spent a lot of time formatting the output of time in all panels: why should I see hundredths of a millisecond? But it's all the little things that are easy to handle or just ignore.
There may be difficulties when using some tricky middleware. I had to modify the class, organizing work with subdomains in a single server.
Addition
There are opinions that this fork of this toolbar is slightly better. I can't say for sure about the functionality, but the interface ...
For such an interface debugger someone could sell the soul to the devil! Need to try.
Found a mistake - write to Habrapmail.
Source: https://habr.com/ru/post/50221/
All Articles