Debugging Javascript in various browsers and environments
We all know how to debug JavaScript in FireFox - of course, this is FireBug. What analogs exist in other browsers ...

Latest version : 1.3 / 1.4 alpha ( what's new )
Official website : http://getfirebug.com/
Opportunities :
* Expandable (FireCookie, FirePHP, etc.)
* Easily view the source code of the page. The Inspect function allows you to accurately locate the tag of an element, view all the properties and styles “attached” to it.
* Editing HTML and CSS directly in the browser. Tag attributes and property values can be changed to see changes. It is convenient for those cases when it is necessary by experiments to find the most acceptable version of the design of the created page.
* Debug JavaScript.
* Tracking page loading process.
* View HTTP headers normal and AJAX requests.
Screenshot :

Latest version : alpha 3
Official website : http://www.opera.com/dragonfly/
Opportunities :
* View DOM;
* View and edit CSS;
* JavaScript debugger;
* View HTTP and HXR requests;
* Debug pages for mobile devices;
* Remotely connect to any computers and devices with Opera installed, supporting this tool, and debug web pages.
* Console errors;
* Command line.
About expansion :
In order for the DragonFly panel to appear below, you need to select Tools -> Advanced -> Developer Tools in the Opera main menu. There will be an Error Console tab, and in it a JavaScript tab. This is the error console. Here we can also output debug information from the script. But, alas, there is no console object. However, there is opera.postError () - analogue console.log ().
Screenshot :

Latest version : 0.4.2
Official site : http://www.my-debugbar.com/wiki/CompanionJS/HomePage
Opportunities :
* Detailed information about the JS-error (real file name, string and function calls before the error)
* FireBug-like API for the console
* The console allows you to explore objects
* Icon on the toolbar to call the panel Companion.JS
Screenshot :
Habré articles : JavaScript debugger for IE
')
Latest version : installed with Office 2003
MSDN : http://msdn.microsoft.com/en-us/library/aa189846(office.10).aspx
Opportunities :
* Use Visual Studio for debugging.
Read more : Debugging for Internet Explorer (in Visual Studio)
Thank you alemiks
Latest version : 2.4.1 (3/12/2008)
Official site : http://www.ieinspector.com/dominspector/
Opportunities :
* Web Inspector - the ability to view the DOM-model of the page and its dynamic change, styles, etc.
* There is a console like in Firebug
* Write logs from javascript
* HTTP Monitor - allows you to view the sent and received requests from the page
Minus : program fee: (
Screenshot :
Thank you megahertz
About the debugger : However, as they say on the Internet, it is not very good - there is no console, nothing can be done until you click to stop debugging, you cannot change the DOM and styles on the fly, etc.
Thank you XaocCPS
Latest version : new build released every night
Official website : https://trac.webkit.org/wiki/Drosera
Opportunities :
* Setting breakpoint
* There is a console object
* Functional stack
Screenshot :

Habré articles : Not a big mention of Safari for web developers
Latest version : 1.2.1
Official site : http://getfirebug.com/lite.html
Opportunities :
* Supports all major FireBug commands.
Screenshot :
Habré articles : Firebug lite
Read more about debugging JavaScript in Opera, FireFox, IE and Safari
PS You know something else, write in the comments - I will add with pleasure.
UPD:
* Transferred to JavaScript
* Added IE + WebDeveloper V2
* Added IE + Microsoft Script Editor
* Added IE8
Firefox - Firebug
Latest version : 1.3 / 1.4 alpha ( what's new )
Official website : http://getfirebug.com/
Opportunities :
* Expandable (FireCookie, FirePHP, etc.)
* Easily view the source code of the page. The Inspect function allows you to accurately locate the tag of an element, view all the properties and styles “attached” to it.
* Editing HTML and CSS directly in the browser. Tag attributes and property values can be changed to see changes. It is convenient for those cases when it is necessary by experiments to find the most acceptable version of the design of the created page.
* Debug JavaScript.
* Tracking page loading process.
* View HTTP headers normal and AJAX requests.
Screenshot :
Opera - Dragonfly
Latest version : alpha 3
Official website : http://www.opera.com/dragonfly/
Opportunities :
* View DOM;
* View and edit CSS;
* JavaScript debugger;
* View HTTP and HXR requests;
* Debug pages for mobile devices;
* Remotely connect to any computers and devices with Opera installed, supporting this tool, and debug web pages.
* Console errors;
* Command line.
About expansion :
In order for the DragonFly panel to appear below, you need to select Tools -> Advanced -> Developer Tools in the Opera main menu. There will be an Error Console tab, and in it a JavaScript tab. This is the error console. Here we can also output debug information from the script. But, alas, there is no console object. However, there is opera.postError () - analogue console.log ().
Screenshot :
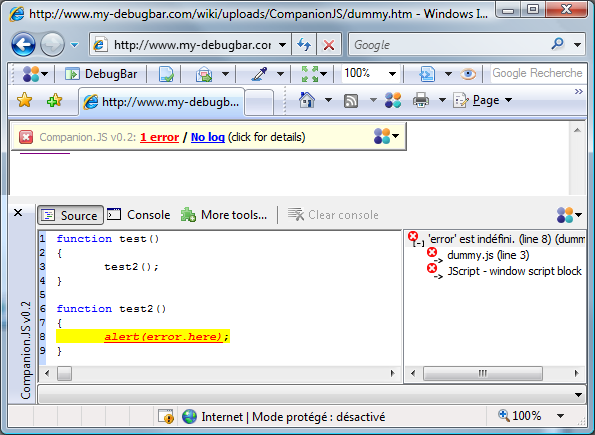
IE - Companion.JS
Latest version : 0.4.2
Official site : http://www.my-debugbar.com/wiki/CompanionJS/HomePage
Opportunities :
* Detailed information about the JS-error (real file name, string and function calls before the error)
* FireBug-like API for the console
* The console allows you to explore objects
* Icon on the toolbar to call the panel Companion.JS
Screenshot :
Habré articles : JavaScript debugger for IE
')
IE - Microsoft Script Editor
Latest version : installed with Office 2003
MSDN : http://msdn.microsoft.com/en-us/library/aa189846(office.10).aspx
Opportunities :
* Use Visual Studio for debugging.
Read more : Debugging for Internet Explorer (in Visual Studio)
Thank you alemiks
IE - WebDeveloper V2
Latest version : 2.4.1 (3/12/2008)
Official site : http://www.ieinspector.com/dominspector/
Opportunities :
* Web Inspector - the ability to view the DOM-model of the page and its dynamic change, styles, etc.
* There is a console like in Firebug
* Write logs from javascript
* HTTP Monitor - allows you to view the sent and received requests from the page
Minus : program fee: (
Screenshot :
Thank you megahertz
IE8 - embedded
The developer tool is built into IE8, with a debugger and js profiler.
About the debugger : However, as they say on the Internet, it is not very good - there is no console, nothing can be done until you click to stop debugging, you cannot change the DOM and styles on the fly, etc.
Thank you XaocCPS
Safari (any WebKit application) - Drosera
Latest version : new build released every night
Official website : https://trac.webkit.org/wiki/Drosera
Opportunities :
* Setting breakpoint
* There is a console object
* Functional stack
Screenshot :
Habré articles : Not a big mention of Safari for web developers
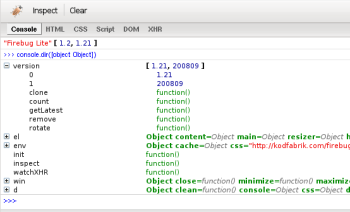
Any browser - Firebug Lite
Latest version : 1.2.1
Official site : http://getfirebug.com/lite.html
Opportunities :
* Supports all major FireBug commands.
Screenshot :
Habré articles : Firebug lite
Read more about debugging JavaScript in Opera, FireFox, IE and Safari
PS You know something else, write in the comments - I will add with pleasure.
UPD:
* Transferred to JavaScript
* Added IE + WebDeveloper V2
* Added IE + Microsoft Script Editor
* Added IE8
Source: https://habr.com/ru/post/50096/
All Articles