Node.js Logging Guide
The first task most often faced by developers starting to program in JavaScript is how to log events in the console log using the
console.log method. Looking for information on debugging JavaScript code, you will find hundreds of blog articles, as well as instructions on StackOverflow that advise you to “simply” output data to the console using the console.log method. This is such a common practice that I had to introduce rules for code quality control, such as no-console , so as not to leave random log entries in production code. But what if you need to specifically register an event to provide additional information?This article discusses various situations in which you need to maintain logs; It shows the difference between the
console.log and console.error methods in Node.js and demonstrates how to pass the logging function to libraries without overloading the user console. 
')
Theoretical foundations of working with Node.js
The
console.log and console.error methods can be used both in the browser and in Node.js. However, when using Node.js, there is one important thing to keep in mind. If you create the following code in Node.js using a file called index.js ,
and then execute it in the terminal using
node index.js , then the results of command execution will be located one above the other:
Despite the fact that they seem similar, the system processes them differently. If you look at the section on
console operation in the Node.js documentation , it turns out that console.log displays the result through stdout , and console.error through stderr .Each process can work with three streams (
stream ) by default: stdin , stdout and stderr . The stdin stream processes input for a process, for example, button clicks or redirected output (more on that below). The standard stdout output stream is for outputting application data. Finally, the standard stderr error stream is designed to display error messages. If you need to figure out what stderr and when to use it, read this article .In short, it can be used to use the redirection (
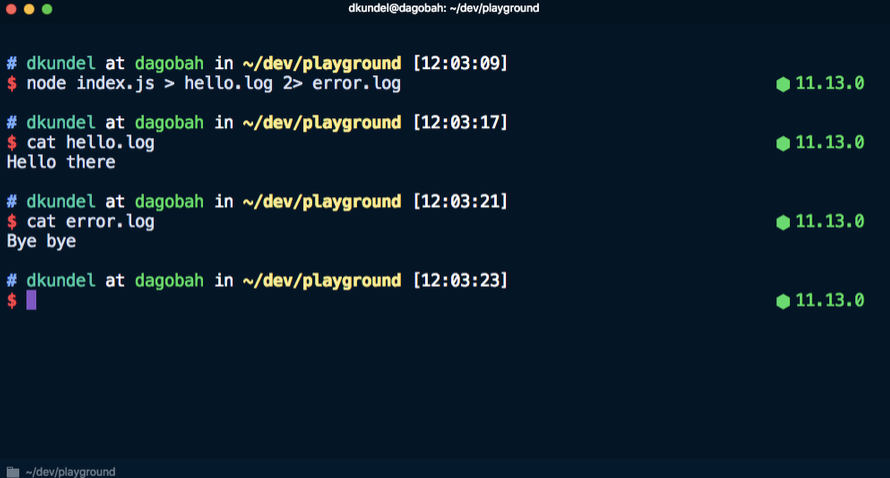
> ) and pipeline ( | ) operators to work with errors and diagnostic information separately from the actual results of the application. If the > operator allows you to redirect the output of the result of the command to a file, then using the 2> operator you can redirect the output of the stderr error stream to a file. For example, this command sends Hello there to the hello.log file, and Bye bye to the error.log file.
When do I need to write events to the log?
Now that we’ve reviewed the technical aspects that underlie logging, let's move on to various scenarios in which events need to be recorded. Typically, these scenarios fall into one of several categories:
- quick debugging when unexpected behavior during development;
- browser-based logging for analysis and diagnostics;
- logging for server applications to register incoming requests and possible errors;
- maintaining additional debug logs for libraries to help users solve problems;
- logging for the output of the command line interface and to display messages in the console about the progress of the operation, confirmations and errors.
This article only discusses the last three scenarios based on Node.js.
Logging for server applications
There are several reasons for logging events that occur on the server. For example, logging incoming requests allows you to get statistics about how often users encounter 404 errors, what could be the reason for this, or which
User-Agent client application is being used. You can also find out the time the error occurred and its cause.In order to experiment with the material given in this part of the article, you need to create a new directory for the project. In the project directory, create
index.js for the code to be used, and execute the following commands to start the project and install express :
We set up a server with middleware, which will register each request in the console using the
console.log method. We put the following lines in the index.js file: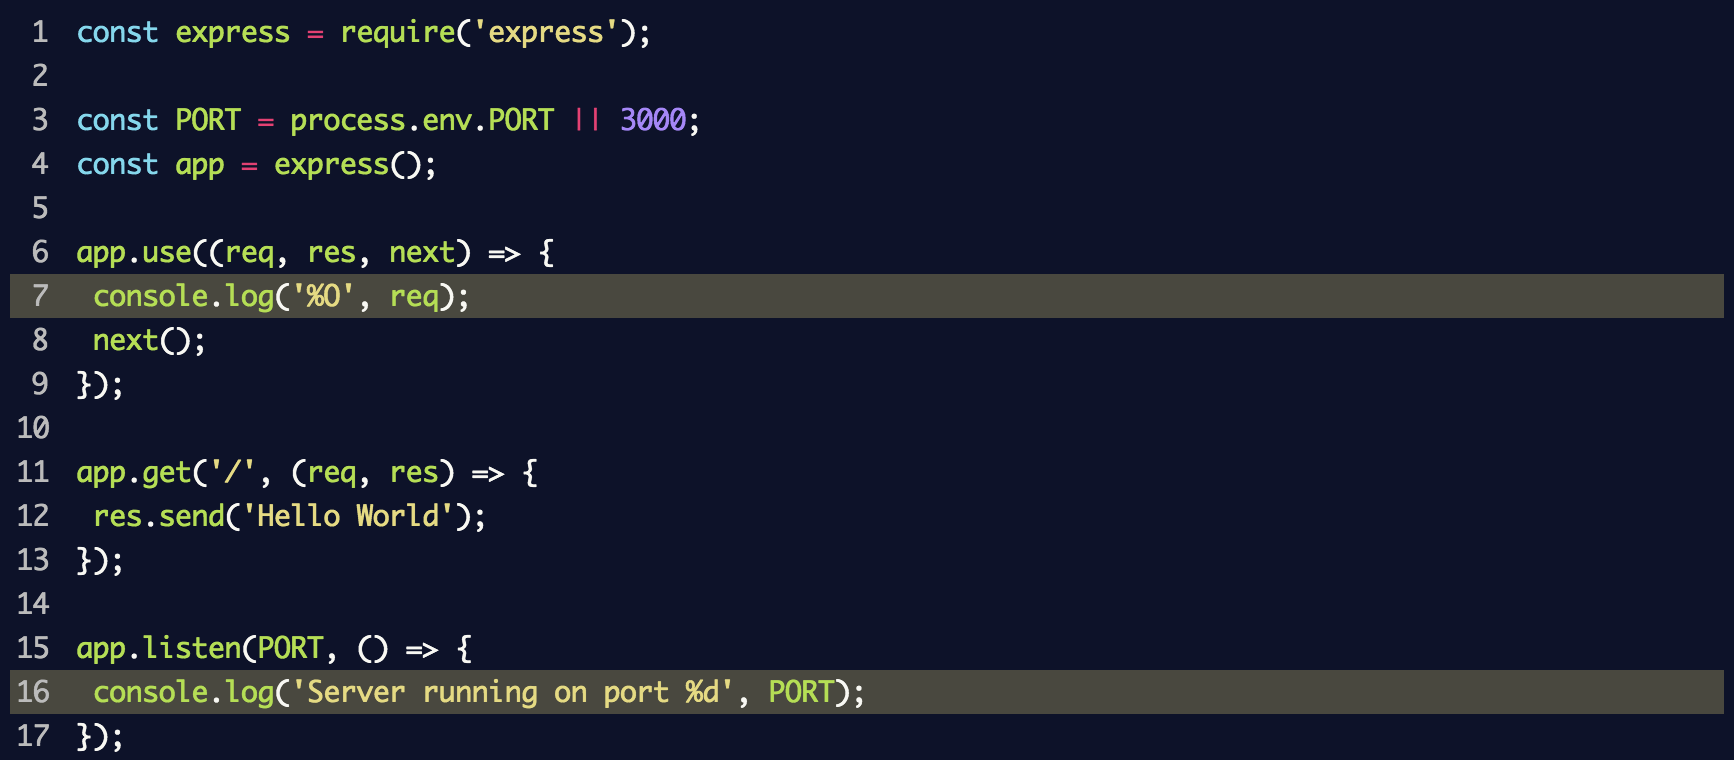
This uses
console.log('%O', req) to log the entire object in the log. From an internal structure point of view, the console.log method uses util.forma t, which, in addition to %O supports other placeholders. Information about them can be found in the Node.js documentation .When executing
node index.js to start the server and switching to localhost : 3000, the console displays a lot of unnecessary information: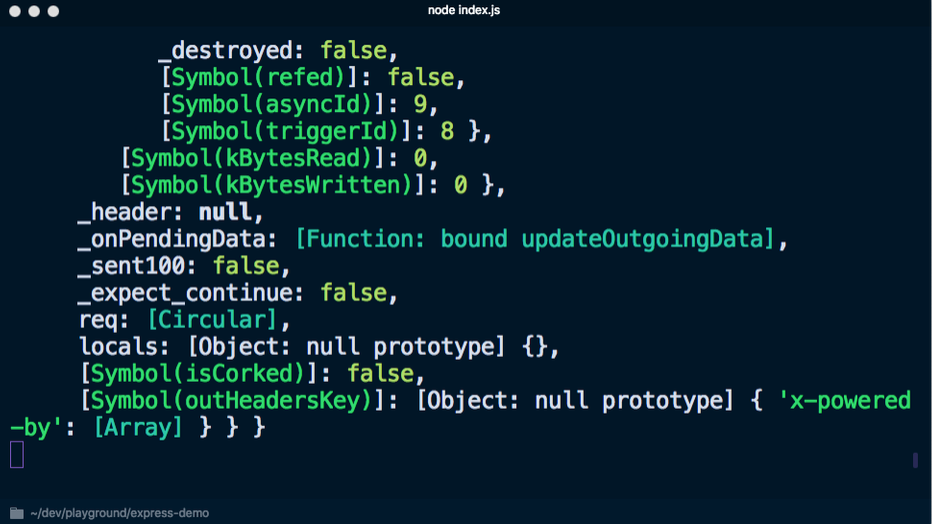
If instead use
console.log('%s', req) so as not to display the object completely, you won’t get much information: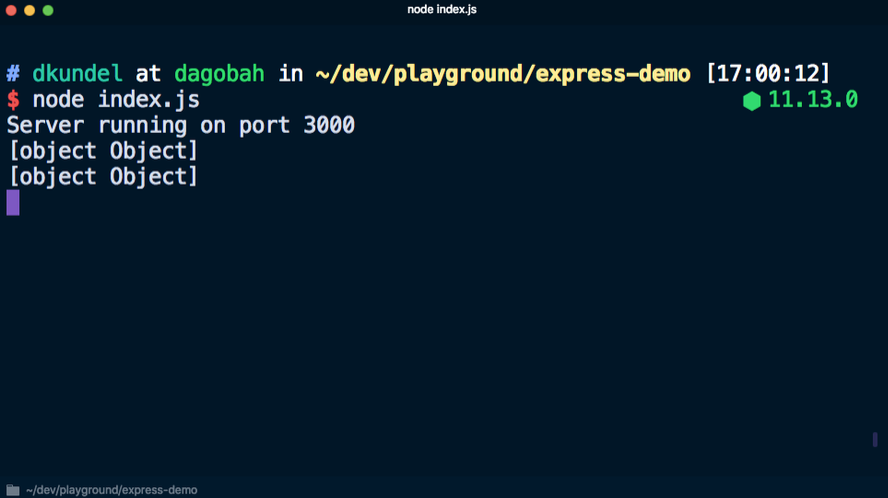
You can write your own logging function, which will display only the necessary data, but first you need to decide which information is needed. Despite the fact that the focus is usually on the content of the message, in reality it is often necessary to obtain additional information, which includes:
- timestamp - to know when events occurred;
- computer / server name - if a distributed system is running;
- process identifier - if several Node processes are running using, for example,
pm2; - message - an actual message with some content;
- stack trace - if an error is logged;
- additional variables / information.
In addition, given that in any case, everything is output to the
stdout and stderr streams, there is a need to keep a journal at different levels, as well as configure and filter journal entries depending on the level.This can be achieved by gaining access to different parts of the process
process and writing several lines of code in JavaScript. However, Node.js is remarkable in that it already has an npm ecosystem and several libraries that can be used for these purposes. These include:Often,
pino preferred because it is fast and has its own ecosystem. Let's see how pino can help with logging. Another advantage of this library is the express-pino-logger package, which allows you to register requests.Install
pino and express-pino-logger :
After that, we update the
index.js file to use the event logger and middleware: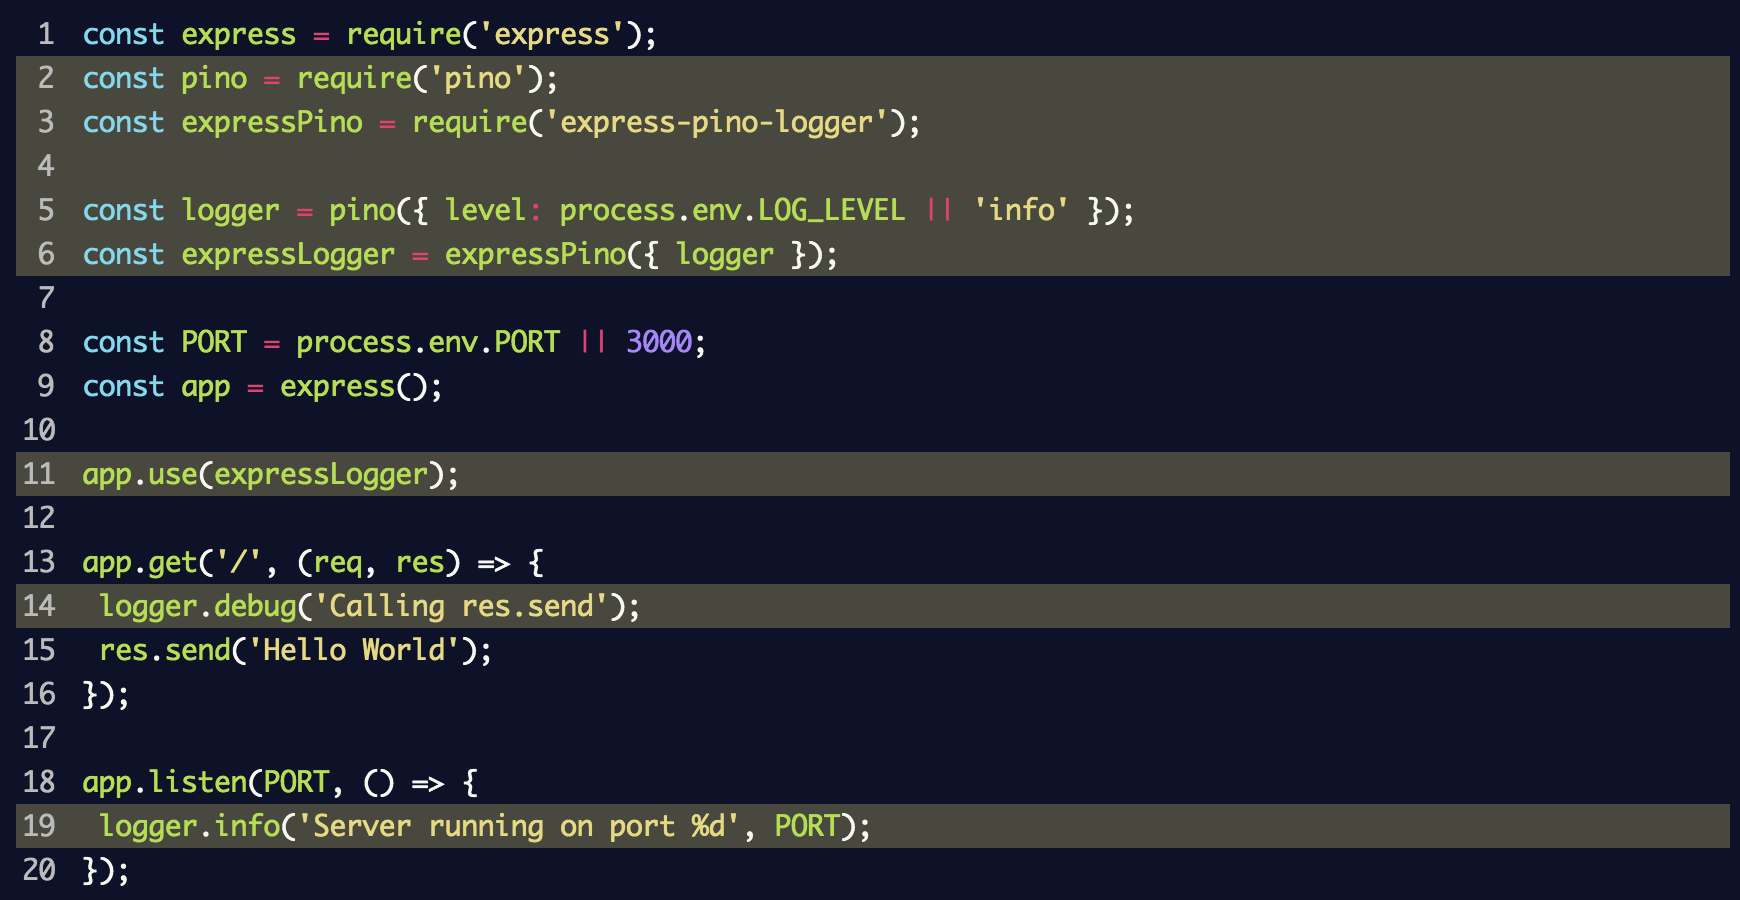
In this fragment, we created an instance of the
logger for pino for the event logger and passed it to express-pino-logger to create new cross-platform event logging software with which you can call app.use . In addition, console.log replaced by logger.info at server logger.info and added logger.debug to the route to display different levels of the log.If you restart the server by repeatedly executing
node index.js , you will get a different result at the output, in which each line / line will be output in JSON format. Again, go to localhost : 3000 to see another new line in JSON format.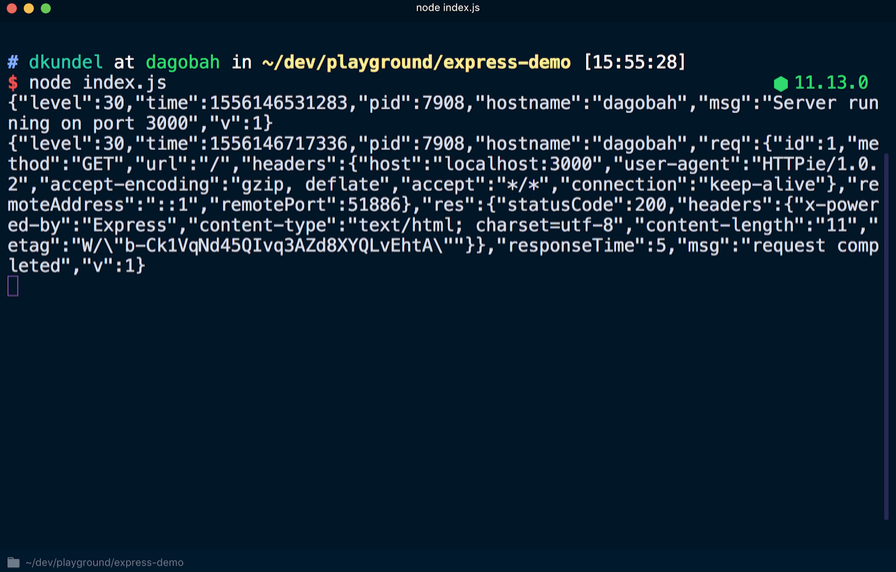
Among the data in JSON format, you can find the previously mentioned information, such as a time stamp. Also note that the
logger.debug message logger.debug not displayed. In order to make it visible, you need to change the default log level. After creating an instance of the logger event registration, the value process.env.LOG_LEVEL was set. This means that you can change the value or accept the default info value. Running LOG_LEVEL=debug node index.js , we change the level of the log.Before doing this, it is necessary to solve the problem of the output format, which is not very convenient for perception at the moment. This step is done intentionally. According to the
pino philosophy, for performance reasons, it is necessary to transfer the processing of journal entries to a separate process, passing the output (using the | operator). The process involves translating the output into a format more convenient for human perception, or uploading it to the cloud. This task is performed by transfer tools called transports . Check out the transports toolkit documentation and see why pino errors are not output via stderr .To view a more readable version of the magazine, use the
pino-pretty tool. Run in the terminal:
All log entries are transferred using the
| at the disposal of pino-pretty , due to which the output is "cleared", which will contain only important information displayed in different colors. If you query localhost : 3000 again, a debug debugging message should appear.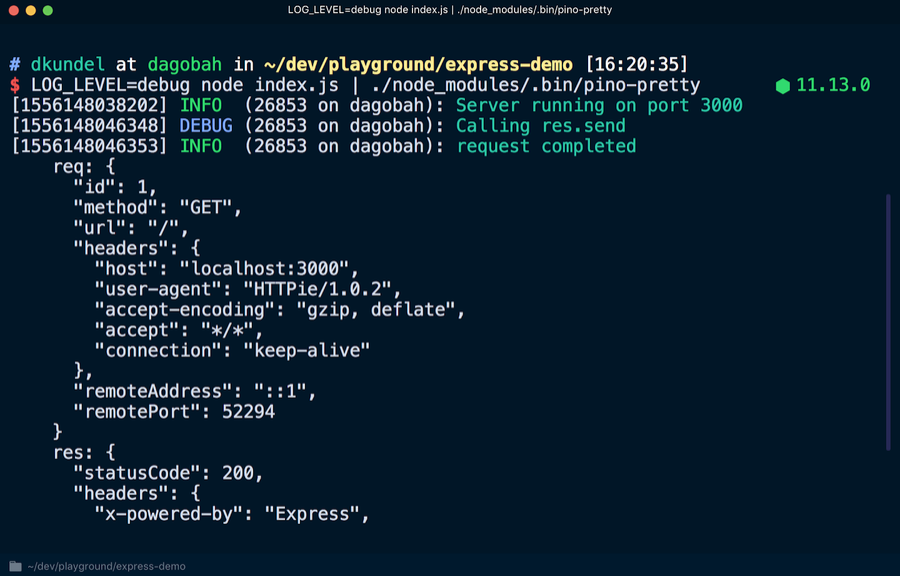
In order to make journal entries more readable or convert them, there are many transmission tools. They can even be displayed using emojis using
pino-colada . These tools will be useful for local development. When the server is in production, it may be necessary to transfer log data using another tool , write it to disk using > for subsequent processing, or do two operations at the same time using a specific command, for example tee .The document also talks about rotating log files, filtering and writing log data to other files.
Library journaling
By exploring ways to efficiently organize logging for server applications, you can use the same technology for your own libraries.
The problem is that in the case of the library, you may need to keep a log for debugging purposes without loading the client application. On the contrary, the client should be able to activate the log if debugging is necessary. By default, the library should not record output, giving the user this right.
A good example of this is the
express framework. Many processes take place in the internal structure of the express framework, which may cause interest in studying it more deeply while debugging the application. The documentation for the express framework says that you can add DEBUG=express:* to the beginning of the command as follows:
If you apply this command to an existing application, you can see a lot of additional output that will help with debugging:
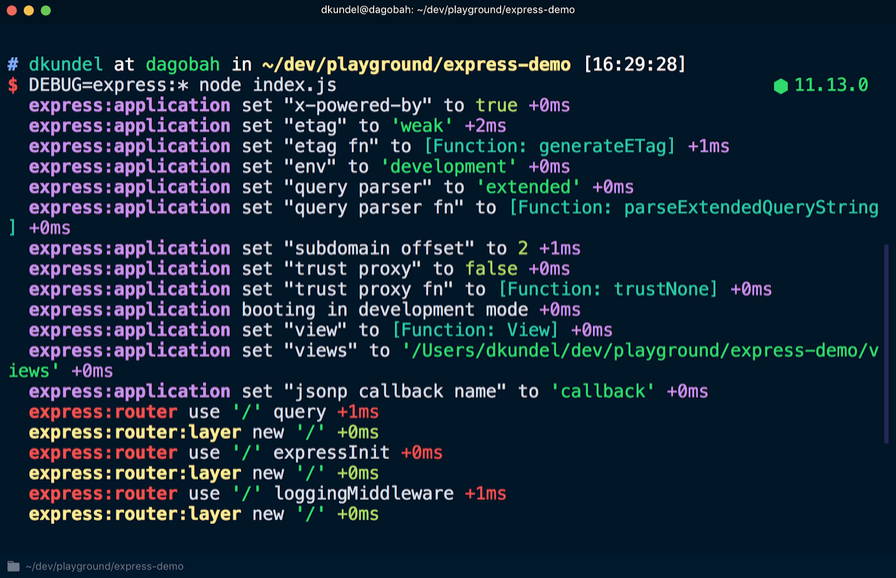
This information cannot be seen unless the debug log is activated. There is a
debug package for this. It can be used to write messages in the "namespace", and if the library user includes this namespace or a wildcard that matches it in their DEBUG environment variable , the messages will be displayed. First you need to install the debug library:
Create a new file called
random-id.j s that will simulate the library and put the following code into it: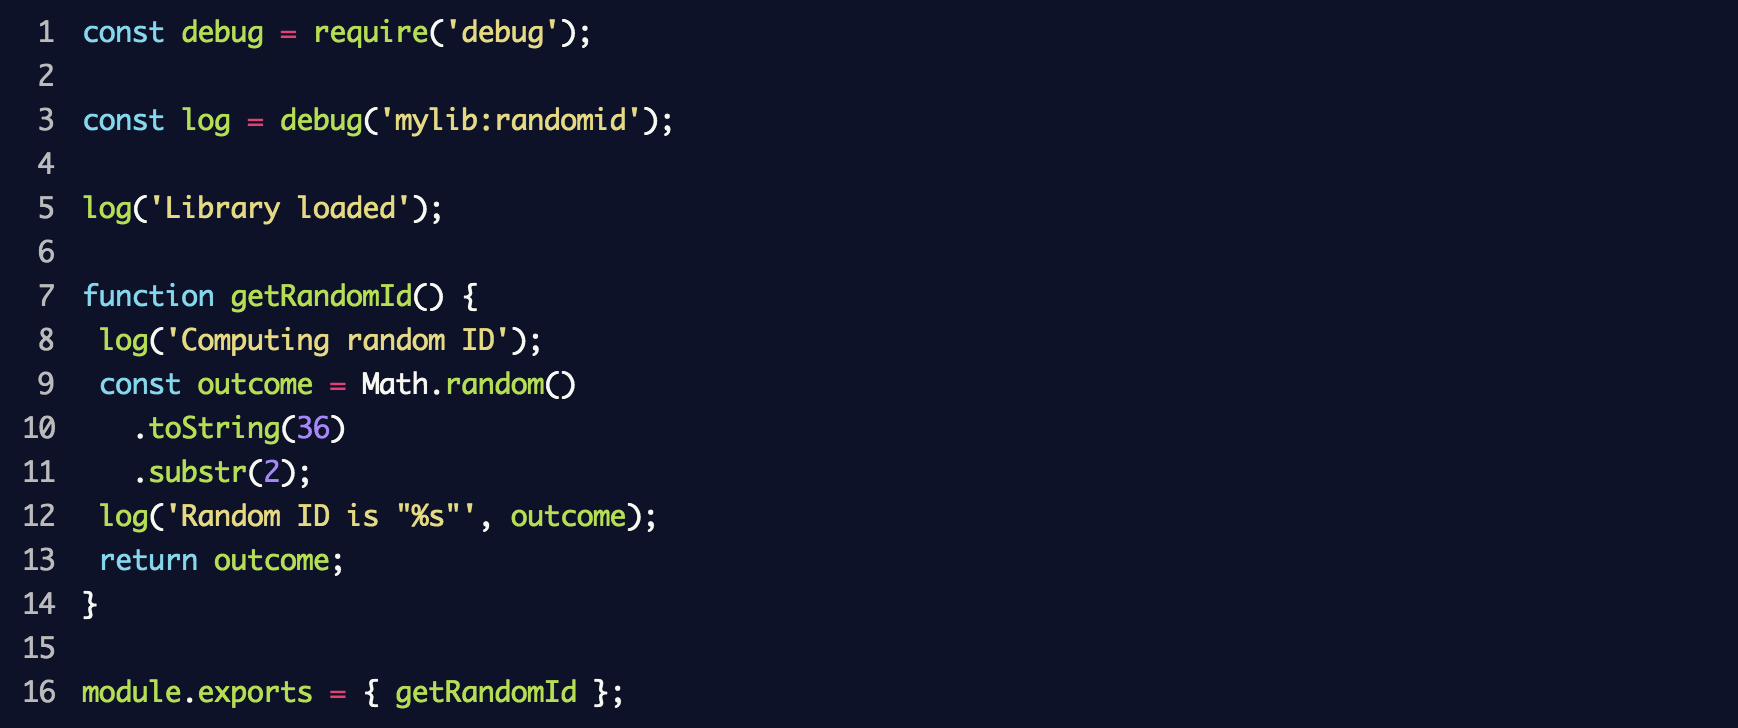
As a result, a new
debug event logger will be created with the mylib:randomid , in which two messages will then be registered. We use it in index.js from the previous section: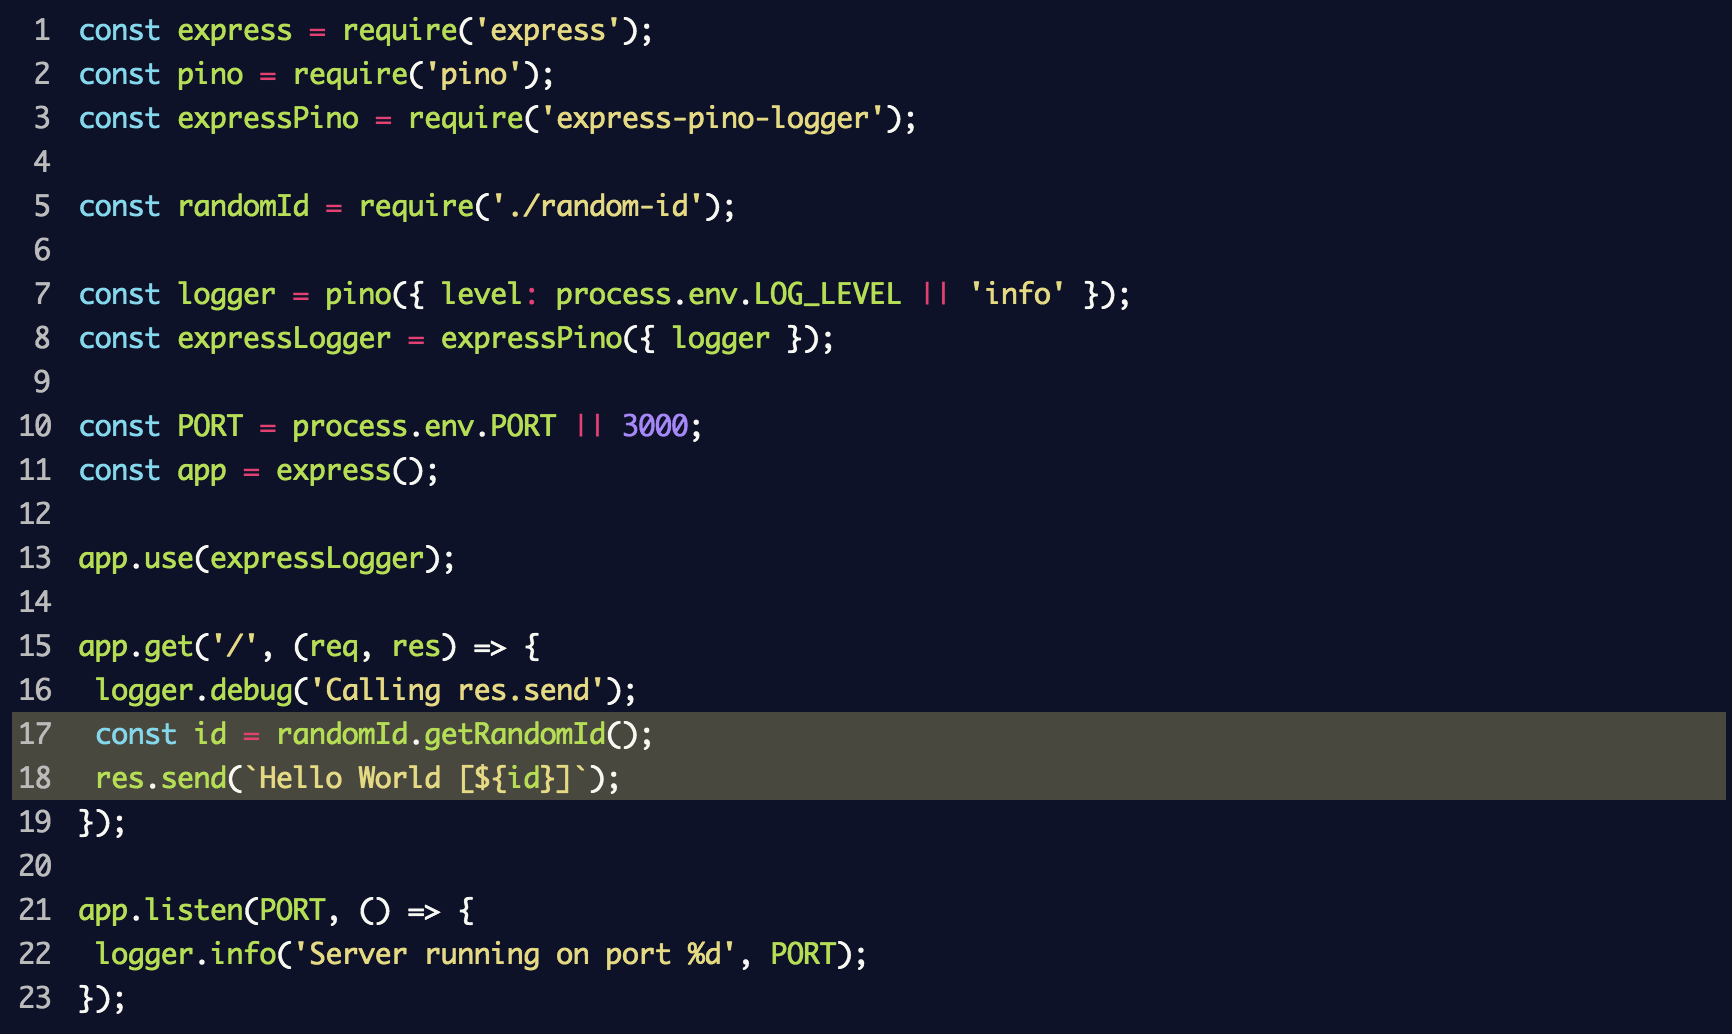
If you start the server again, adding
DEBUG=mylib:randomid node index.js this time, then the debug log entries for our “library” will be displayed: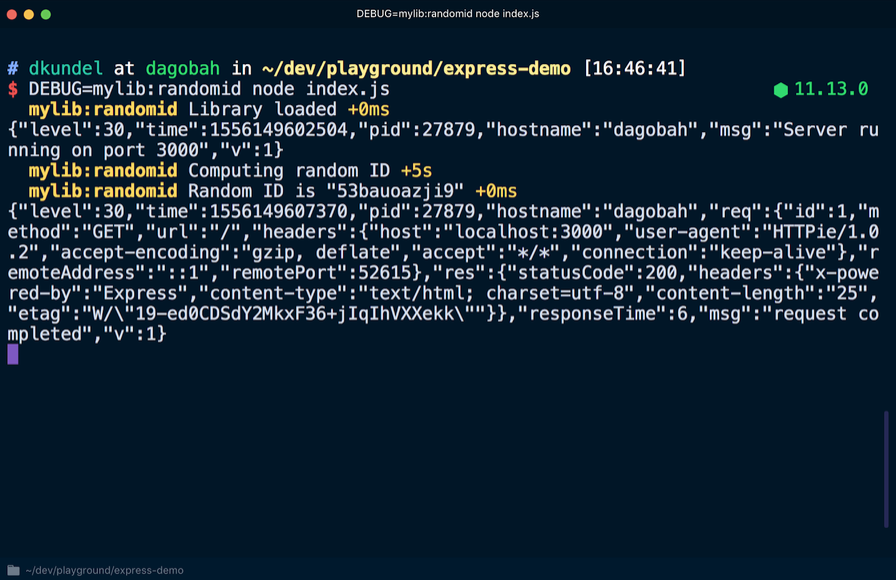
If library users want to put debugging information in
pino log entries, they can use a library called pino-debug created by the pino command to format these entries correctly.Install the library:

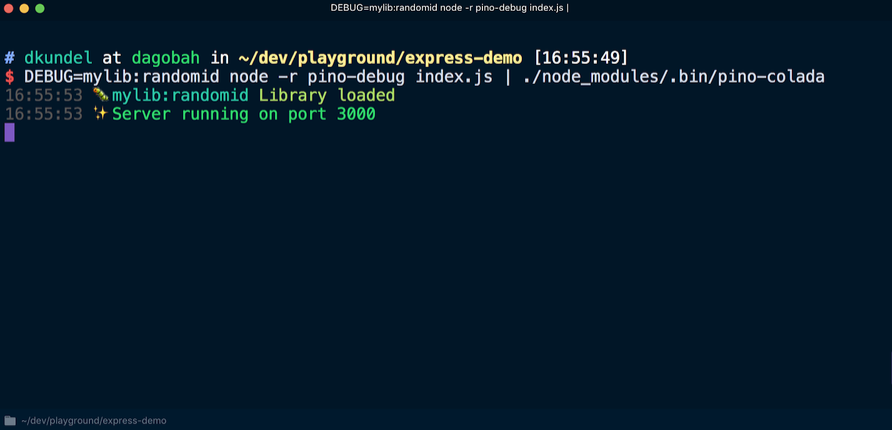
Before using
debug for the first time, pino-debug must be initialized. The easiest way to do this is to use the -r or --require flags to request a module before running the script. We restart the server using the command (provided that pino-colada installed):
As a result, the debug log entries of the library will be displayed in the same way as in the application log:
Command Line Interface (CLI) Output
The final case that this article discusses is logging for the command line interface. Preferably, the log that records events related to the program logic is kept separate from the log for registering command-line interface data. To record any events related to the program logic, you need to use a specific library, for example
debug . In this case, you can reuse the program logic without being limited to one scenario using the command line interface.By creating a command line interface using Node.js , you can add various colors, variable value blocks, or formatting tools to give the interface a visually appealing look. However, you need to keep in mind several scenarios.
According to one of them, the interface can be used in the context of a continuous integration system (CI), in which case it is better to abandon color formatting and visually overloaded presentation of results. On some continuous integration systems, the
CI flag is set. You can verify that you are in a continuous integration system using the is-ci package, which supports several such systems.Some libraries, such as
chalk , define continuous integration systems and cancel the output of colored text to the console. Let's see how it works.Install
chalk with the npm install chalk and create a file called cli.js Put the following lines in the file:
Now, if you execute this script using
node cli.js , the results will be presented using different colors: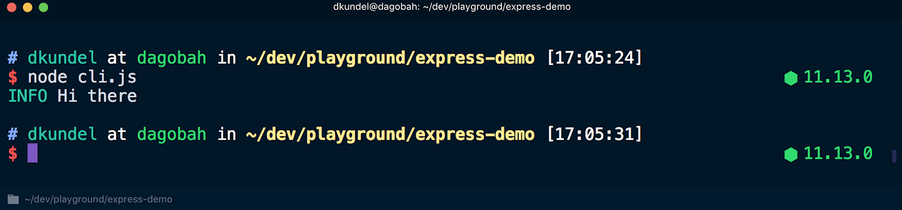
But if you execute the script using
CI=true node cli.js , the color formatting of the texts will be canceled: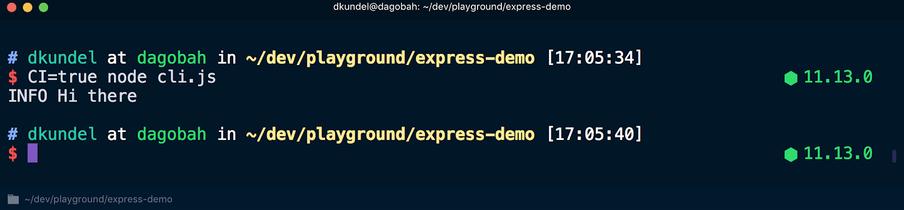
In another scenario worth remembering,
stdout running in terminal mode, i.e. data is output to the terminal. In this case, the results can be nicely displayed using boxen . Otherwise, the output will most likely be redirected to a file or somewhere else.You can check the operation of
stdin , stdout or stderr streams in terminal mode by looking at the isTTY attribute of the corresponding stream. For example, process.stdout.isTTY . TTY means "teletypewriter" and in this case is designed specifically for the terminal.Values may vary for each of the three threads, depending on how the Node.js processes were started. Detailed information on this can be found in the Node.js documentation, in the “Input / output of processes” section .
Let's see how the value of
process.stdout.isTTY varies in different situations. cli.js file to check it: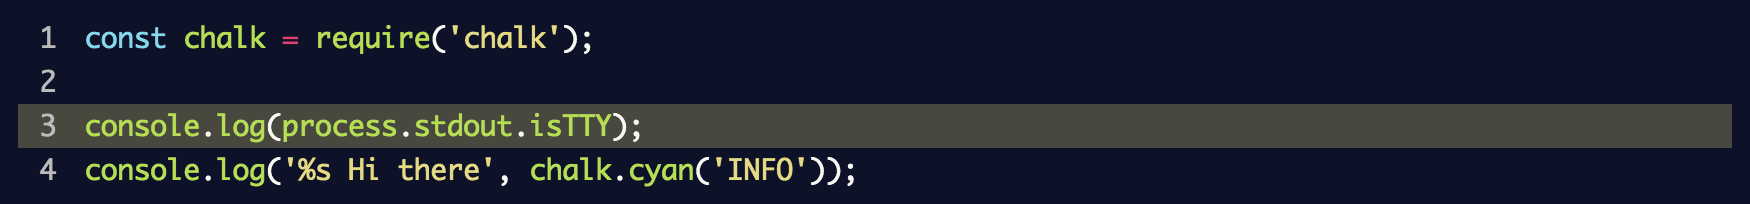
Now run
node cli.js in the terminal and see the word true , after which the message is displayed in colored font: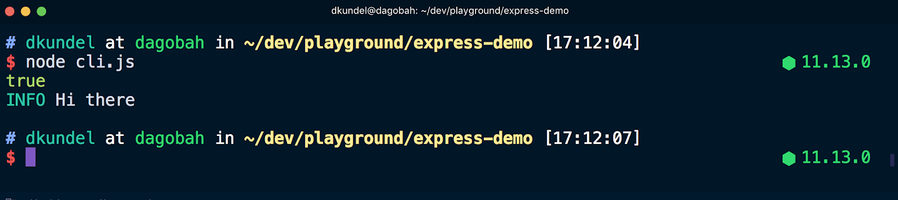
After that, we re-execute the command, but redirect the output to a file, and then view the contents:

This time, the word
undefined appeared in the terminal, followed by a message displayed in a colorless font, since the redirection of the stdout stream brought it out of terminal mode. Here chalk uses the supports-color tool, which from the point of view of the internal structure checks the isTTY corresponding stream.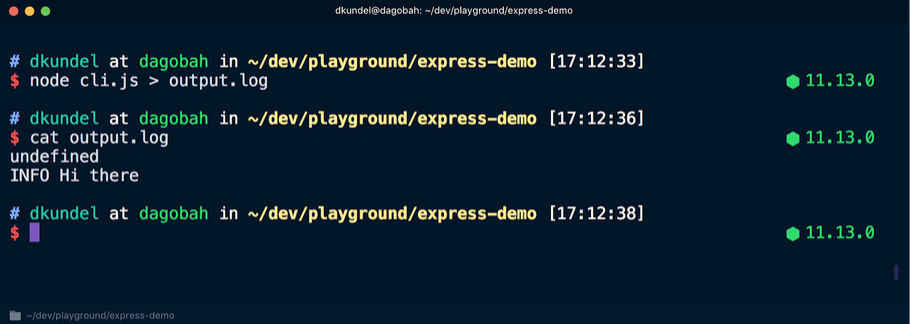
Tools like
chalk do these things on their own. However, when developing a command line interface, you should always remember about situations when the interface works in a continuous integration system or the output is redirected. These tools help you use the command line interface at a higher level. For example, the data in the terminal can be organized in a more structured way, and if isTTY is undefined , switch to a simpler way of analysis.Conclusion
Starting to use JavaScript and entering the first line in the console log using
console.log quite simple. But before you deploy the code in production, you should consider several aspects of using the log. This article is only an introduction to the various methods and solutions used in organizing the event log. It does not contain everything you need to know. Therefore, it is recommended to pay attention to successful open source projects and monitor how they solved the logging problem and what tools are used. Now try to log yourself without outputting data to the console.
If you know other tools worth mentioning, write about them in the comments.
Source: https://habr.com/ru/post/461881/
All Articles