New Cluster Analysis Method
A new method of cluster analysis is proposed. Its advantage is in a less computationally complex algorithm. The method is based on the calculation of votes for the fact that a pair of objects is in the same class from information about the value of individual coordinates.
Introduction
A great need for data analysis is the development of effective classification methods. In such methods, it is required to divide the entire set of objects into the optimal number of classes, based only on information about the value of individual indicators [Zagoruyko 1999].
Cluster analysis is one of the most popular methods of data analysis and mathematical statistics. Cluster analysis allows you to automatically find classes of objects, using only information about the quantitative indicators of objects (training without a teacher). Each such class can be defined by one object that is most characteristic of it, for example, by average in terms of indicators. There are a large number of methods and approaches for classifying data.
Modern research in the field of cluster analysis is carried out to improve methods for determining classes of complex topology [Furaoa 2007, Zagoruiko 2013], as well as to improve the speed of algorithms in the case of big data.
')
In this paper, we propose a classification method based on obtaining votes for a pair of objects in the same class, based on information about the value of individual indicators. It is proposed that a pair of objects be in the same class if the values of their individual indicators are in the interval with a length not exceeding a given value.
K-means method
The k-means method is one of the most popular clustering methods. Its purpose is to obtain such data centers that would correspond to the hypothesis of compactness of data classes with their symmetric radial distribution. One way to determine the positions of such centers, given their number \ textit {k}, is the EM approach.
In this method, two procedures are performed sequentially.
- Definition for each data object $ inline $ X_ {i} $ inline $ the nearest center $ inline $ C_ {j} $ inline $ , and assigning a class label to this object $ inline $ X_ {i} ^ {j} $ inline $ . Further, for all objects, their belonging to different classes becomes determined.
- Calculation of the new position of the centers of all classes.
Repeating iteratively these two procedures from the initial random position of the centers of the \ textit {k} classes, one can achieve the separation of objects into classes that would most closely correspond to the hypothesis of radial compactness of classes.
A new author's classification algorithm will be compared with the k-means method.
New method
The new cluster analysis algorithm is built on the basis of votes for belonging to different clusters from information on the values of the individual coordinates of data points.
- A value d is specified that characterizes the length of the interval of indicators within which two objects are considered to belong to the same class.
- Select an indicator $ inline $ x_ {i} $ inline $ and all pairs of objects are considered $ inline $ \ left \ {O_ {l}, O_ {k} \ right \} $ inline $ where $ inline $ l, k = 1 \ ldots N $ inline $ .
- If a $ inline $ \ left | x_ {i} ^ {l} -x_ {i} ^ {k} \ right | \ le d $ inline $ then the magnitude $ inline $ r_ {lk}: = r_ {lk} + 1 $ inline $ (voice added).
- Actions 2) and 3) are repeated for all indicators $ inline $ i = 1 \ ldots M $ inline $ .
- The p value characterizing the minimum number of votes for belonging to the same classes is set.
- Using the key method of pairs of values, all classes of objects are determined, such that within one class of voice for pairs of objects from these classes > = p .
- Iterates over all the values of d and p and repeats items 1) - 6) to obtain the number of classes closest to the given number of classes g .
To reduce the complexity of the algorithm to N , you can use T intervals for individual indicators and replace clause 2) and 3) in the algorithm with the following:
1. The indicator is selected $ inline $ x_ {i} $ inline $ and all intervals are considered $ inline $ \ left [u_ {l}, w_ {l} \ right] $ inline $ where $ inline $ l = 1 \ ldots T $ inline $ :
$$ display $$ u_ {0} = \ min (x_ {i}); u_ {0} = \ min (x_ {i}); $$ display $$
$$ display $$ w_ {T} = \ max (x_ {i}); $$ display $$
$$ display $$ s_ {i} = w_ {T} -u_ {0}; $$ display $$
$$ display $$ u_ {l} = u_ {0} + l \ cdot s_ {i}; $$ display $$
$$ display $$ w_ {l} = u_ {l} + d; $$ display $$
2. If $ inline $ x_ {i} ^ {k} \ in \ left [u_ {j}, w_ {j} \ right] $ inline $ and $ inline $ x_ {i} ^ {l} \ in \ left [u_ {j}, w_ {j} \ right] $ inline $ where $ inline $ j = 1 \ ldots T $ inline $ then the magnitude $ inline $ r_ {lk}: = r_ {lk} + 1 $ inline $ (voice is added with a unique key l , k for the i- th indicator).
Numerical experiment
As the initial data were taken data, with a classification intuitive to humans.
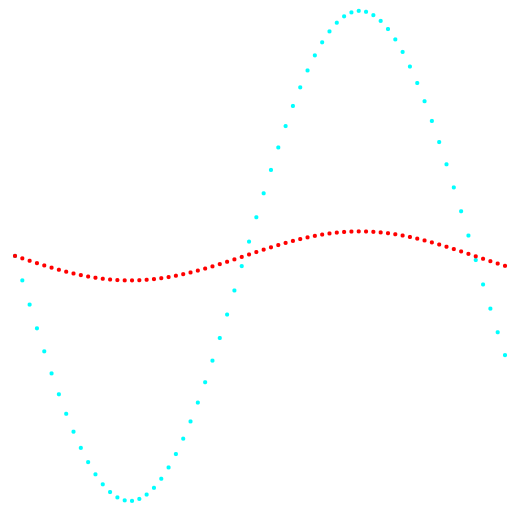
Figures 1 and 2 show the results of the classification of the k-means method and the new classification method.

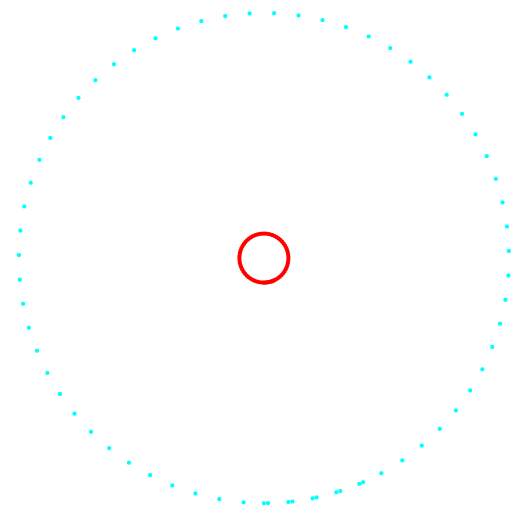
Fig. 1. Projection 1-2 and data classification.
On the left is the k-means method, on the right is the author's method.
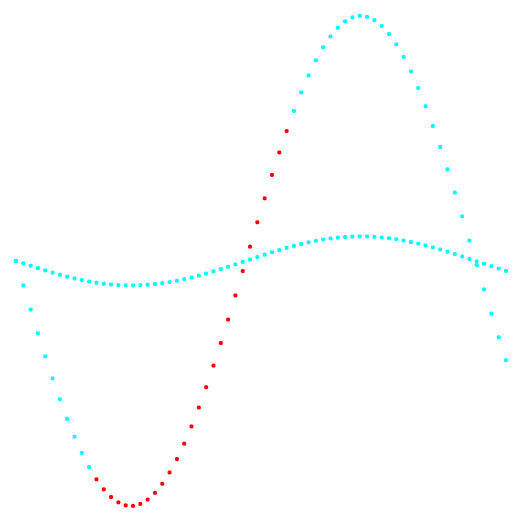
Fig. 2. Projection 2-3 and data classification.
On the left is the k-means method, on the right is the author's method.
The result of comparing the two methods shows the obvious advantage of the author's method in its ability to detect clusters of complex topology.
Software implementation
The k-means clustering method was implemented programmatically as a web application. The computing part of the application is submitted to a server written in PHP using the Zend framework. The application interface is written using HTML, CSS, JavaScript, jQuery. The application is available at http://svlaboratory.org/application/klaster2 after registering a new user. The application allows you to visualize the belonging of objects to different clusters in a given coordinate plane.
Conclusion
A new classification method is proposed. The advantages of this method are recognition of classes of complex topology, non-radial distribution, as well as less complexity of the algorithm and fewer actions, which is especially beneficial in the case of large data arrays.
References
- Zagoruyko N.G. Applied methods of data and knowledge analysis. Novosibirsk: Publishing House of the Institute of Mathematics, 1999.270 p.
- Zagoruyko N.G., Borisova I.A., Kutnenko O.A., Levanov D.A. Detection of patterns in experimental data arrays // Computational technologies. - 2013.Vol. 18. No. S1. S. 12-20.
- Shen Furaoa, Tomotaka Ogurab, Osamu Hasegawab An enhanced self-organizing incremental neural network for online unsupervised learning. Hasegawa Lab, 2007.
Source: https://habr.com/ru/post/461721/
All Articles