Python to help test structural products
Inspired by the advertising of structural products on Habré , adapted the python-script for their independent testing. The basic idea is that such products offer 100% capital protection. And given 10 years of the bull market, the historical performance of such products is stupefying with risk-free paradise.
This article will be interesting for beginner python programmers who are interested in managing their money. Well, for some, this tool can come in handy for building such strategies on your own. But be careful, brokers write that this is not for everyone.
The code is posted on GitHub as a Jupyter notepad. Go!
I will test on American stocks and there the yield will be lower than in rubles. The Russian market in absolute terms on the charts is more interesting, but there are more risks in it. The essence of the tests does not change from this.
')
We take the data from the free Alpha Advantages, where you first need to get the key by sharing the email address. Brief instruction in a notebook. You can take quotes of Russian securities at Finam.
Briefly, your capital is safe, and the yield is higher than the bank deposit (government bonds). Here are just a few elements of the equation missing:
Consider the simplest strategy:
At the heart of the strategy: treasury bonds give 1-3% per annum, practically excluding the drawdown (if there is a yield). 10% of the drawdown of an asset bought with 10% of capital will be the very risk that bonds will cover. During periods of the bull market, some stocks can grow several times, which will give us happiness.
To manually repeat this strategy, you must perform the following steps:
I will briefly describe some solutions with code excerpts that made testing quite flexible and convenient.
You can rebalance in the following periods: week, month, year. And also on any day within the period: the first, Nth, last. The `Schedule ()` class is responsible for this:
As described in one of the articles , we can bypass only rebalancing dates in a cycle and skip all other days. But then we lose statistics on changes in assets within the period, we will not see profitability and drawdowns for each day. This script, to the detriment of speed, is bypassed every day, which allows you to see the market value of open positions and apply a stop order check.
Here, assets that can be opened are allocated to available capital. After comparing the calculation with open positions, transactions are executed for the required number:
And here, for speed, you can sacrifice details and control only the change in the profitability of each position. But the script takes into account commissions and the value of assets, and also keeps a history of transactions, which allows you to calculate transactions and execute a stop order on any day of the test. This method updates the position and size of the free cache.
To run, you must specify a set of assets with shares and test parameters. We will test structural products for the calendar year:
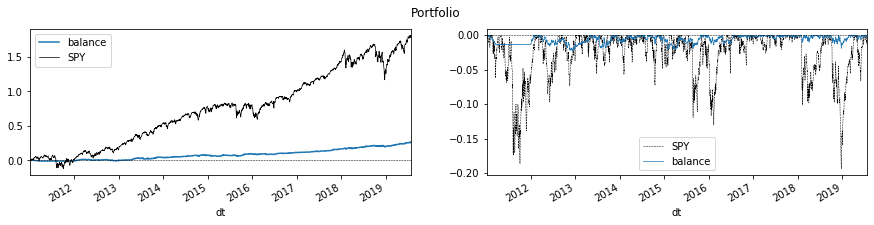
At the bottom of the notebook there are charts with profitability and drawdowns at the date of rebalance (at the end of the year), which confirms the extremely low drawdowns of capital at the time of the report and constantly growing profitability. Although this profitability loses to the broad index of American companies S&P 500.
The tests involved freely traded American instruments since 2011:
This design brought in 8 years revenue of 24% (average annual 2.6%) with a drawdown between rebalances of -6%. But at the turn of the years, the drawdown is about zero. The stop was not touched, the market with 180% of the revenue lost order.

Profitability and drawdown for each day (profitability on the left, drawdown on the right).
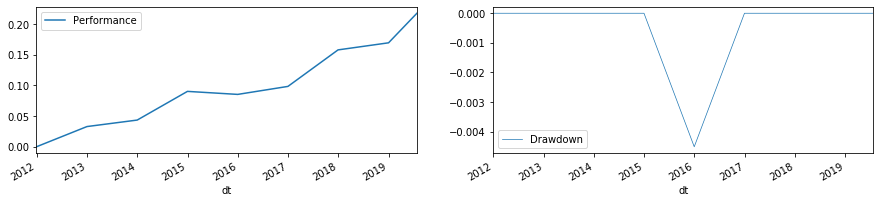
Profitability and drawdown at the junction of years (profitability on the left, drawdown on the right).
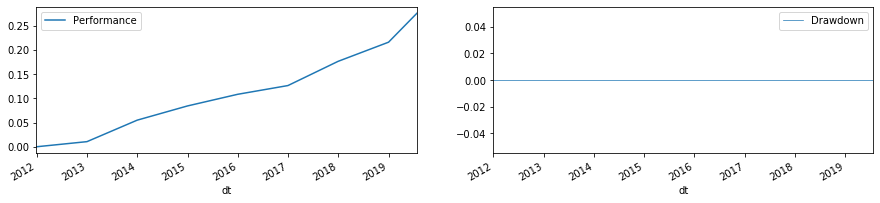
This design has brought in income for 26 years at 26% (average annual 2.75%) with a drawdown between rebalances of -2%. At the junction of years, there is no drawdown.
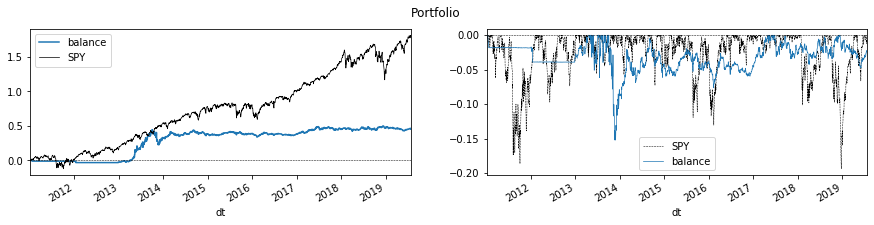
This design brought in 8 years revenue of 45% (average annual 4.6%) with a drawdown between rebalances as much as -15%. But all this in 2013, when Tesla grew almost 5 times. At the junction of years, the drawdown is up to -2%. The most hectic, but also profitable passenger.
Notepad allows you to test any portfolio composition. These may be humeral funds or several companies. Although generally without a protective asset.
GitHub repository .
This article will be interesting for beginner python programmers who are interested in managing their money. Well, for some, this tool can come in handy for building such strategies on your own. But be careful, brokers write that this is not for everyone.
The code is posted on GitHub as a Jupyter notepad. Go!
A few words to introduce
I will test on American stocks and there the yield will be lower than in rubles. The Russian market in absolute terms on the charts is more interesting, but there are more risks in it. The essence of the tests does not change from this.
')
We take the data from the free Alpha Advantages, where you first need to get the key by sharing the email address. Brief instruction in a notebook. You can take quotes of Russian securities at Finam.
Structural Product Charisma
Briefly, your capital is safe, and the yield is higher than the bank deposit (government bonds). Here are just a few elements of the equation missing:
- There is always income on a bank deposit, but there is a risk of playing zero;
- You will make a profit, but the broker claims for a significant piece of the pie;
- There is a restriction on the use of invested money;
- The broker practically does not bear any risks, and participates only in profits.
Strategy
Consider the simplest strategy:
- We buy short-term treasury bonds for 90% of the capital;
- For the remainder, we buy a high-risk asset;
- We put a stop at 10% of the price at the start of the period.
At the heart of the strategy: treasury bonds give 1-3% per annum, practically excluding the drawdown (if there is a yield). 10% of the drawdown of an asset bought with 10% of capital will be the very risk that bonds will cover. During periods of the bull market, some stocks can grow several times, which will give us happiness.
To manually repeat this strategy, you must perform the following steps:
- Buy bonds. For example, in the form of ETF.
- Buy stocks.
- Put a stop order.
How to test
I will briefly describe some solutions with code excerpts that made testing quite flexible and convenient.
schedule
You can rebalance in the following periods: week, month, year. And also on any day within the period: the first, Nth, last. The `Schedule ()` class is responsible for this:
# df = pd.DataFrame([], index=pd.date_range(start, end, freq='B')) # ... # , df = df[df.index.isin(dates)].copy() # ... # # ... elif freq == 'week': groupby = ['year', 'week'] elif freq == 'month': groupby = ['year', 'month'] elif freq == 'year': groupby = ['year'] # grouped = df.groupby(groupby) for idx, grp in grouped: if len(grp) >= abs(day): df.loc[grp.iloc[day].name, 'allow'] = True Data cycle
StructuredProductMill().run() As described in one of the articles , we can bypass only rebalancing dates in a cycle and skip all other days. But then we lose statistics on changes in assets within the period, we will not see profitability and drawdowns for each day. This script, to the detriment of speed, is bypassed every day, which allows you to see the market value of open positions and apply a stop order check.
Rebalancing
StructuredProductMill().rebalance() Here, assets that can be opened are allocated to available capital. After comparing the calculation with open positions, transactions are executed for the required number:
# : balance = self._cash + self.position_balance(day) # df = day.merge(self._positions[['quantity']], how='left', left_index=True, right_index=True) # ... # day.loc[is_allow, 'size_order'] = day[is_allow]['size'] / day[is_allow]['size'].sum() # day['position_to'] = (balance * day['size_order']) // day['open'] # day['order'] = day['position_to'] - day['position'] # ... # for symbol, row in day[fltr].iterrows(): self.trade(row['dt'], symbol, row.order, row.open, 'O' if row.order > 0 else 'C') Deals
StructuredProductMill().trade() And here, for speed, you can sacrifice details and control only the change in the profitability of each position. But the script takes into account commissions and the value of assets, and also keeps a history of transactions, which allows you to calculate transactions and execute a stop order on any day of the test. This method updates the position and size of the free cache.
Launch
To run, you must specify a set of assets with shares and test parameters. We will test structural products for the calendar year:
# portfolio = {'MINT': 0.9, 'AAPL': 0.1,} # SYMBOLS = list(portfolio.keys()) df = prices(SYMBOLS) params = { 'benchmark': 'SPY', # 'balance': 100_000, # 'portfolio': portfolio, 'rebalance_day': -1, # 'freq': 'year', # 'stop_loss': 0.1, # - 10% # 'reset_position_prices': True, 'allow_method': allow_default, 'start': pd.to_datetime('2011-01-01'), # } # , pm = StructuredProductMill(params, prices=prices(SYMBOLS + [params['benchmark']]), show_progress=True) pm.check_params().prepare() # pm.run() # pm.print_results(); # pm.charts() At the bottom of the notebook there are charts with profitability and drawdowns at the date of rebalance (at the end of the year), which confirms the extremely low drawdowns of capital at the time of the report and constantly growing profitability. Although this profitability loses to the broad index of American companies S&P 500.
results
The tests involved freely traded American instruments since 2011:
- BIL - ETF for short-term treasury bonds with a yield of 2% per annum at the time of writing. Remember that in the period from 2009 to 2017, rates were near zero. An alternative is to use MINT (a fund for short-term fixed-income instruments).
- AAPL - Apple Stock.
- MSFT - Microsoft stock.
- TSLA - Tesla shares.
Aapl
This design brought in 8 years revenue of 24% (average annual 2.6%) with a drawdown between rebalances of -6%. But at the turn of the years, the drawdown is about zero. The stop was not touched, the market with 180% of the revenue lost order.
Profitability and drawdown for each day (profitability on the left, drawdown on the right).
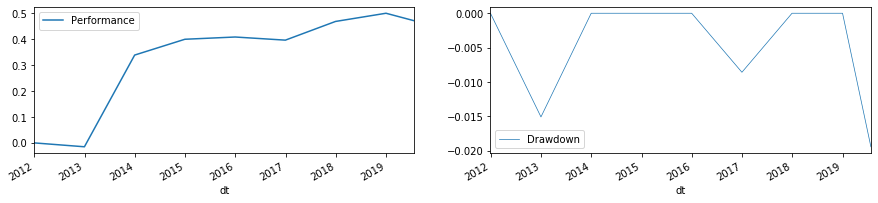
Profitability and drawdown at the junction of years (profitability on the left, drawdown on the right).
Msft
This design has brought in income for 26 years at 26% (average annual 2.75%) with a drawdown between rebalances of -2%. At the junction of years, there is no drawdown.
TSLA
This design brought in 8 years revenue of 45% (average annual 4.6%) with a drawdown between rebalances as much as -15%. But all this in 2013, when Tesla grew almost 5 times. At the junction of years, the drawdown is up to -2%. The most hectic, but also profitable passenger.
Conclusion
Notepad allows you to test any portfolio composition. These may be humeral funds or several companies. Although generally without a protective asset.
GitHub repository .
Source: https://habr.com/ru/post/461583/
All Articles