SVG in real life. Yandex Report
Hi, my name is Artyom, I’m the head of one of the interface development groups in Yandex. A week ago, on Y. Subbotnik, I talked about how we used SVG to create an internal calendar. This is a transcript of my report, several stories from the implementation of the calendar widget: scaling, pattern filling, masks, symbols and format features.

- There are a lot of people working in Yandex, all in different cities, in different time zones, and you need to understand when your colleagues are busy, and when you can meet and talk with them. We decided to design a calendar that will help to find out.
')
We started, of course, with a layout. He looked like this:

It shows even and odd events with different fillings. Events that overlap other events, that is, are on the second layer - another fill. Events that take up all day paint over all day. The current time is displayed below. That was the goal.
We began to choose what we will do it on. Made several different prototypes. We started with canvas, but there was a lot of code, scaling manually to write. We had the idea that the calendar takes up as much space as needed, in different layouts it is of different shapes and sizes. And for canvas it was complicated.
There was a cool prototype when we generated this whole picture with linear gradients, but when it scaled and moved to retina, it moved out. Therefore, in the end, we came to SVG. Why? Firstly, there is a coordinate system that is completely independent of the document, so everything can be absolutely arranged inside, and this will not break regardless of anything. Also there is a normal operation with scaling. Even if you zoom in the browser, if you open the retina or stretch the calendar as you like, it will resize like a picture and look normal anyway. We had a cell fill on the layout, and it’s very good that SVG has a pattern fill.

To draw a calendar, you need some data. To draw the one on the layout, you need to know what date it starts - usually with the current one - to know how many days should be horizontal, how many hours should be displayed vertically and what hour does the day on the calendar begin. We need to somehow get events.
Since we have many offices in different time zones, we decided that events will always arrive in UTC, and we will already display them on the client for users, since there is a need to look at the calendar for our time zone and for the person’s time zone, whose calendar are you looking at - to understand that it is night now, and it’s better not to make an appointment. What is highlighted in red will be used later.
Let's start with the basics. SVG is a giant coordinate plane on which vector graphics can be arbitrarily placed. At the same time, the part of the area that we see is determined by the viewBox, and what is behind its borders is such overflow hidden on steroids. Whatever it is, it will not be visible. We decided that for simplicity of calculations we’ll make one pixel in the calendar equal to one minute. Therefore, one hour will occupy exactly 60 pixels. To make it even easier, we decided that the day in width would also be 60 pixels - so that everything was square, like in the army. And they began to typeset.
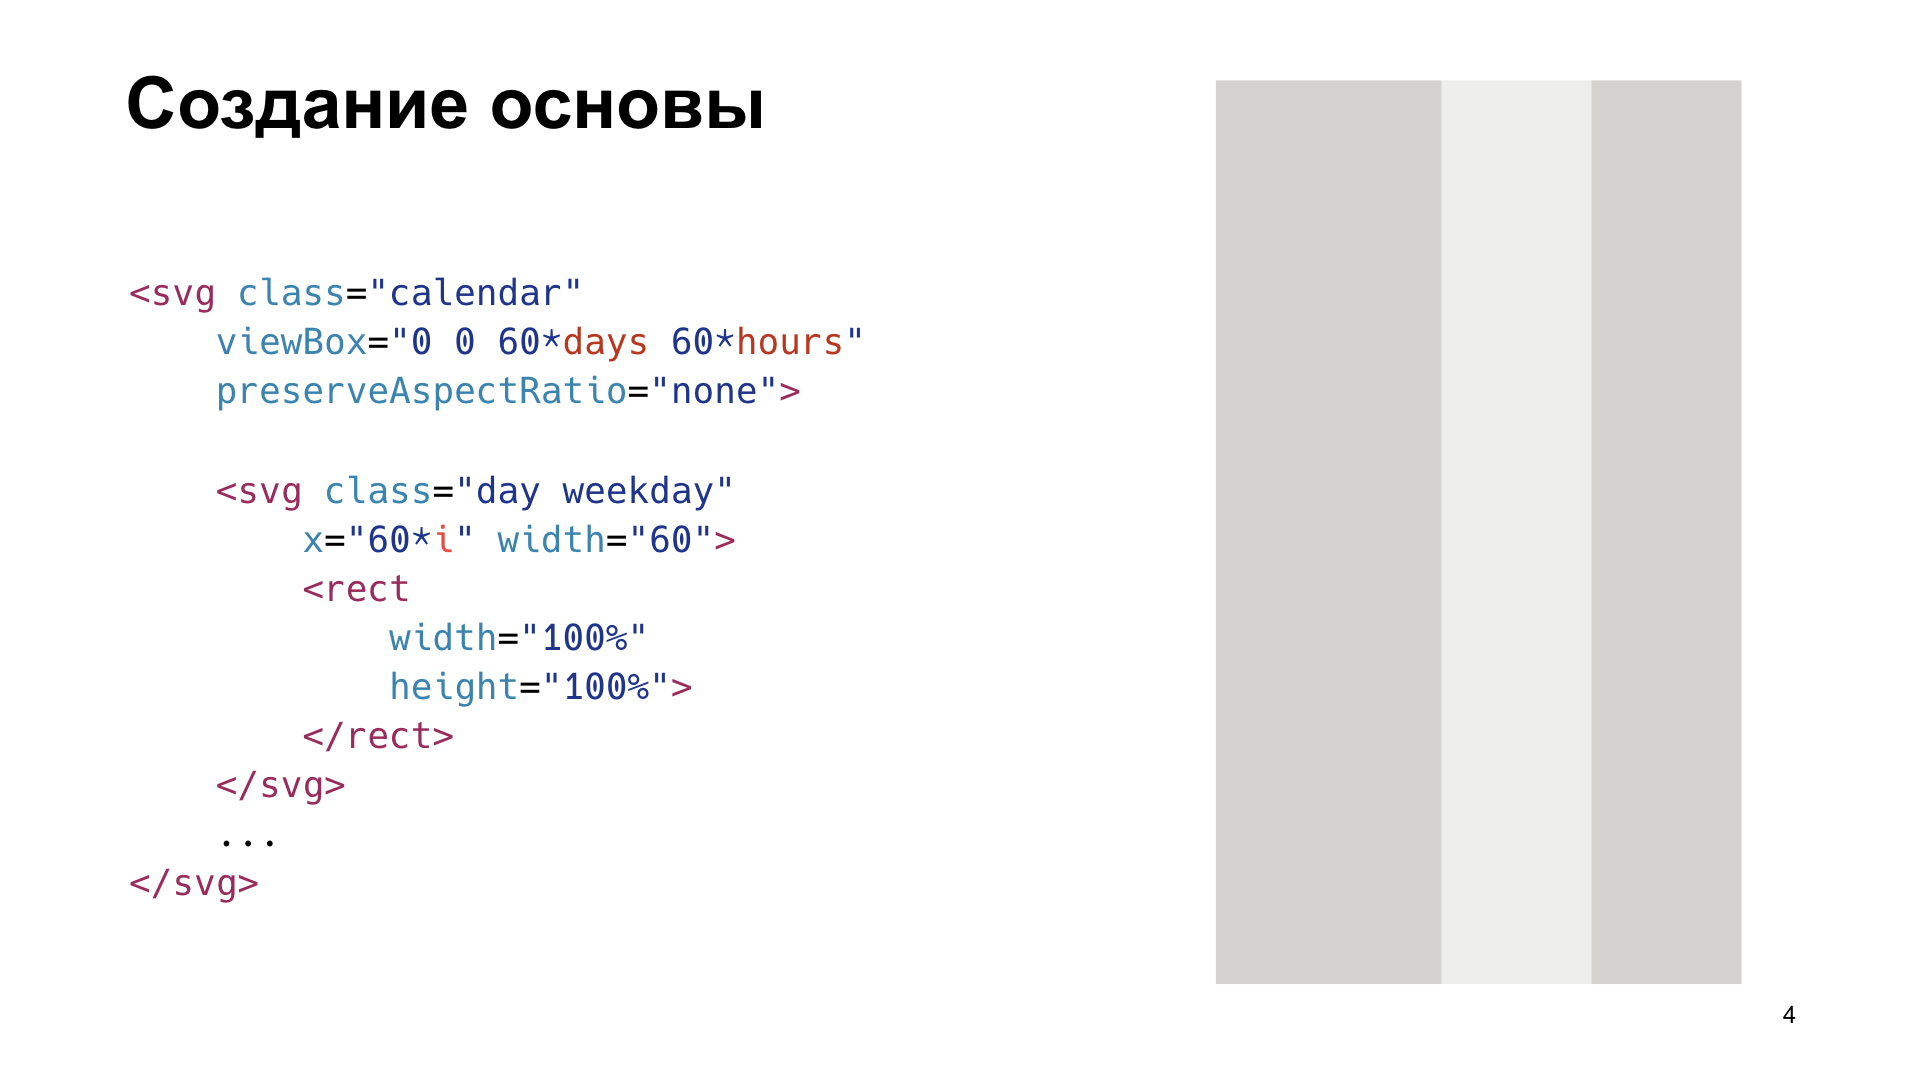
Viewbox is set by four parameters. The first two are the upper left point in the coordinate system, from which the viewBox is considered, for us it is 0.0. The width is 60 * for the number of days, and the height is 60 * for the number of hours.
It is valid to insert other SVG documents inside the SVG, which will have their own coordinate system inside. And so that the events in the day could be positioned only along the vertical axis, we decided that for each day we’ll have a separate SVG, and we just shift them horizontally by 60 * to the position of the day in the calendar. Then all the events can be simply set vertically in Y, it will be very convenient. And inside each SVG, which is a day, we put a rectangle that will display the fill of the day.
This rectangle, since no fill color is specified, will inherit the fill property from SVG. In this case, this day is working, and the weekend is two days a week, so they are flooded with light. This is just determined by the classes.
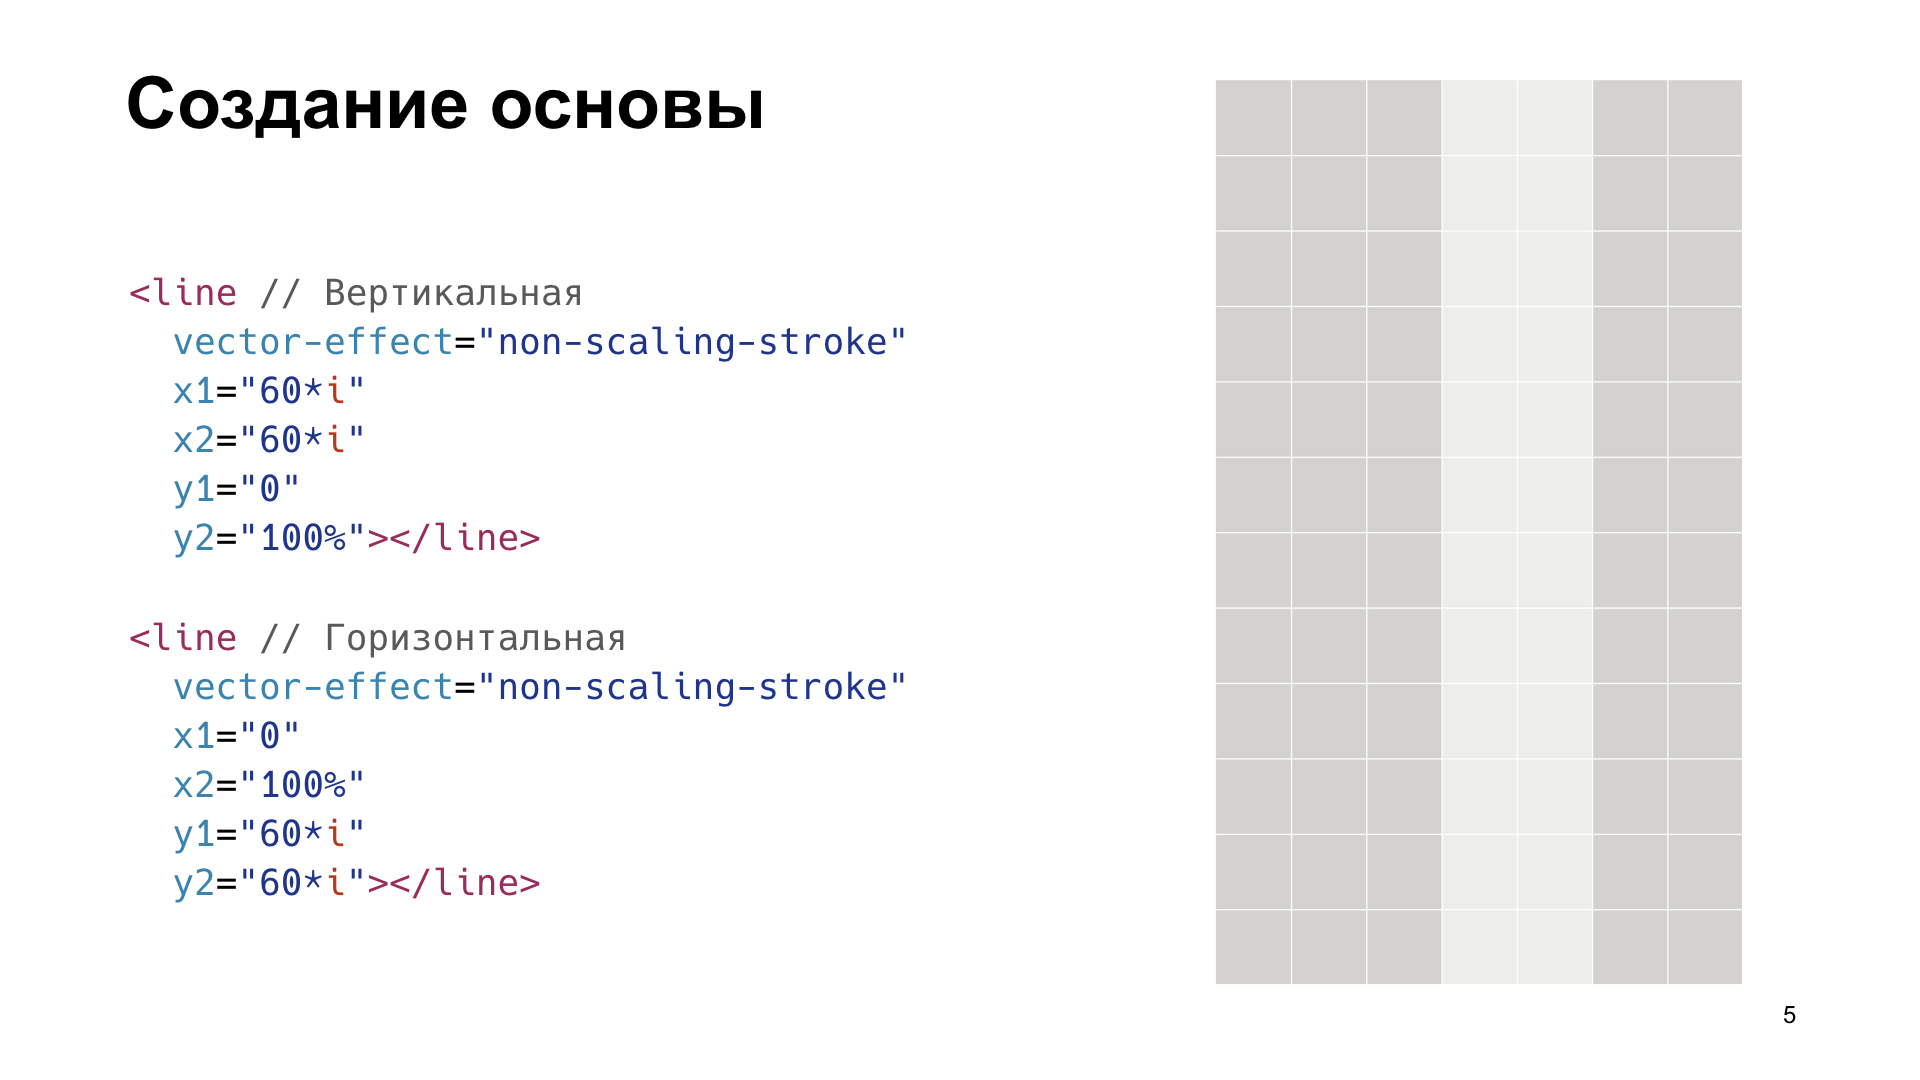
There is a blank. Now you need to add the grid. Since we wanted to resize the calendar, and the grid lines should always be single-pixel, we used the vector-effect = non-scaling-stroke attribute. This leads to the fact that no matter how we resize or zoom, there will always be a one-pixel grid. It is enough just to add the right amount of horizontal and vertical lines, and there will be such a grid.

We’ve figured out the basis, let's move on to all-day events. This is such a tricky thing. You have noticed that there are events on the calendars and there is a “all day” checkmark. These events are different in that they go all day, no matter what time zone you are looking at. Therefore, if somewhere at the very beginning of time zones in Alaska the event begins early in the morning, then somewhere in 48 hours at the opposite end of the globe it will still go on. It sounds complicated, but it’s easiest to implement: just compare the date with the date of the displayed day. If it hits, it means an event on that day. If two events for the whole day fall on the day, then the one that later began is displayed. So fill shows events for the whole day.
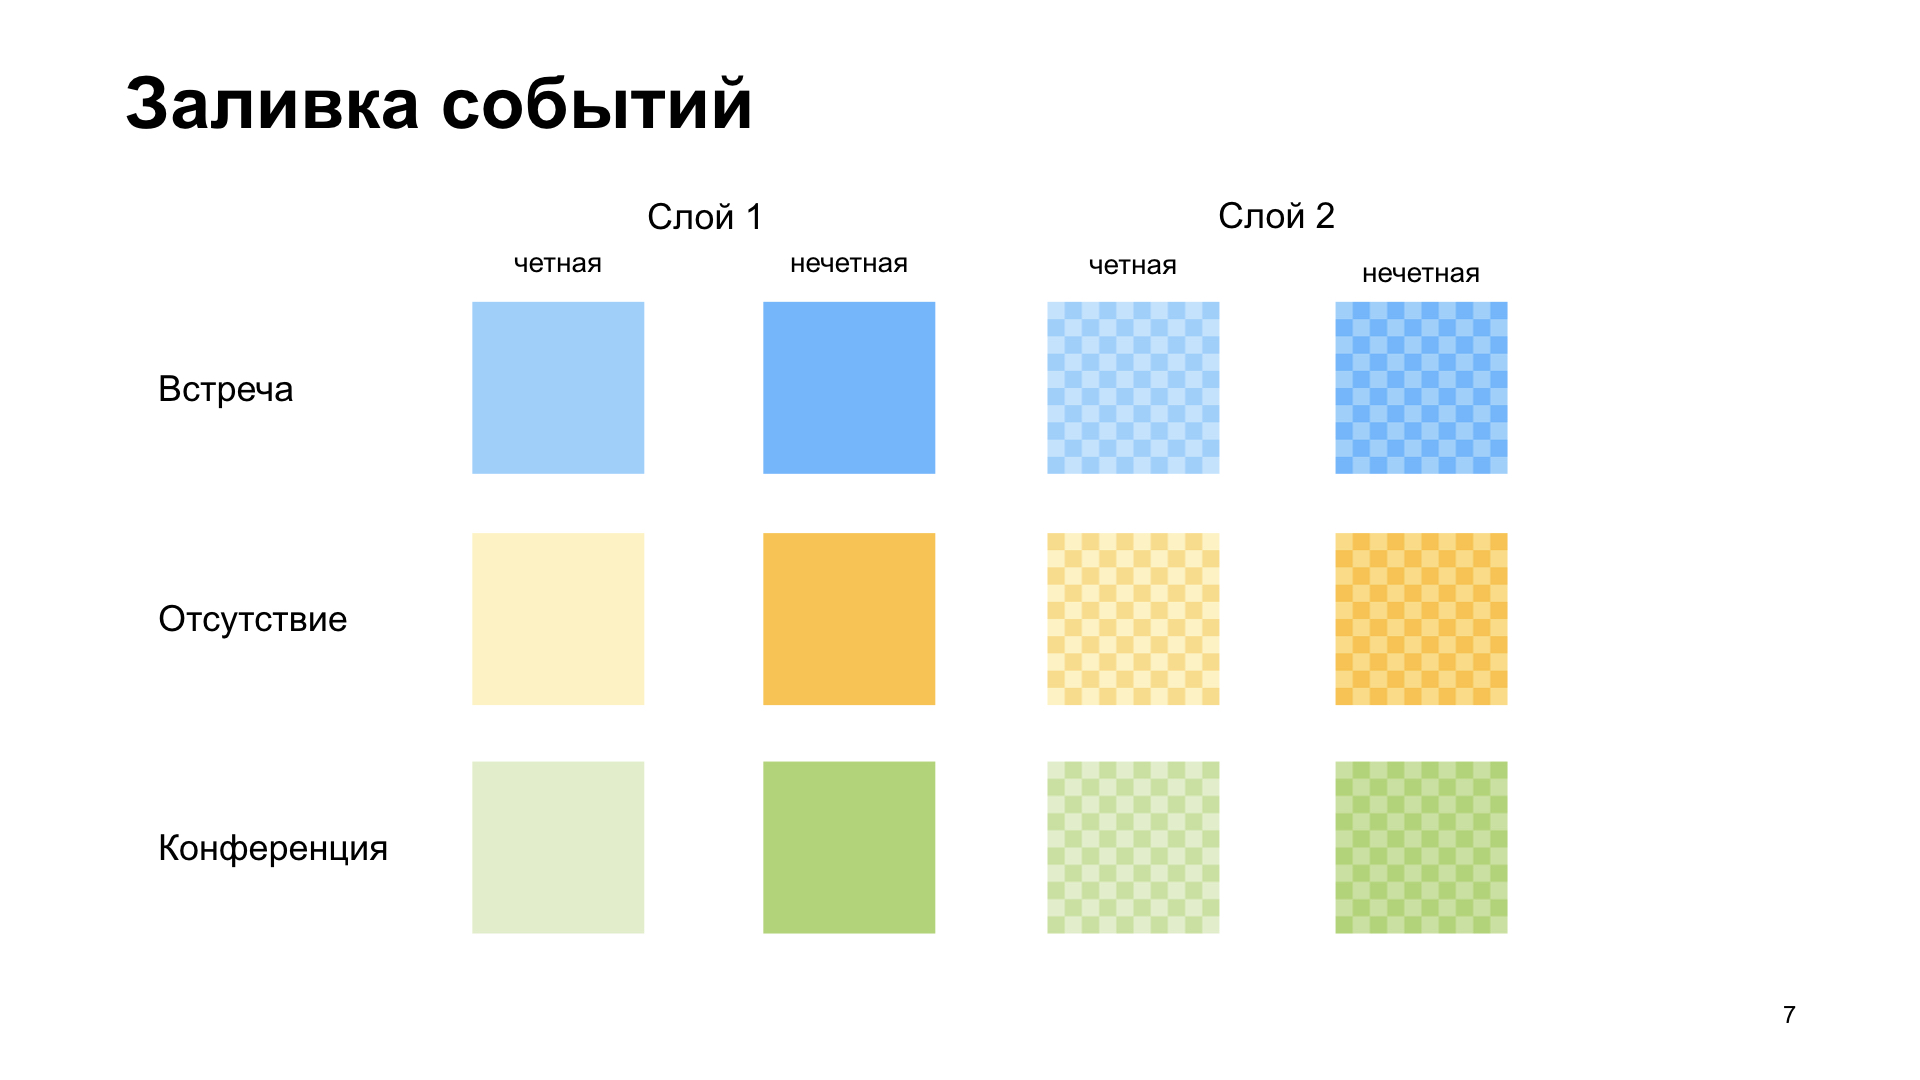
With other events it is a little more difficult. There is, let's say, a meeting. It is blue filled, everything is simple. However, if two meetings are held in a row, according to our layout, we fill them with different colors, they are even and odd.
If one meeting intersects with another, lies higher, you need to somehow display it. If there are intersections with meetings, then they are poured completely separately, in cells. And to make us even more fun, we have not only meetings, but also absences, conferences, and much more. I didn’t want to hardcode all this in layout, so we decided to figure out how it is more or less cross-browser and convenient to configure in CSS.
Now there will be the most difficult example from the whole report, be patient and watch, there will be three steps, then it will become easier.
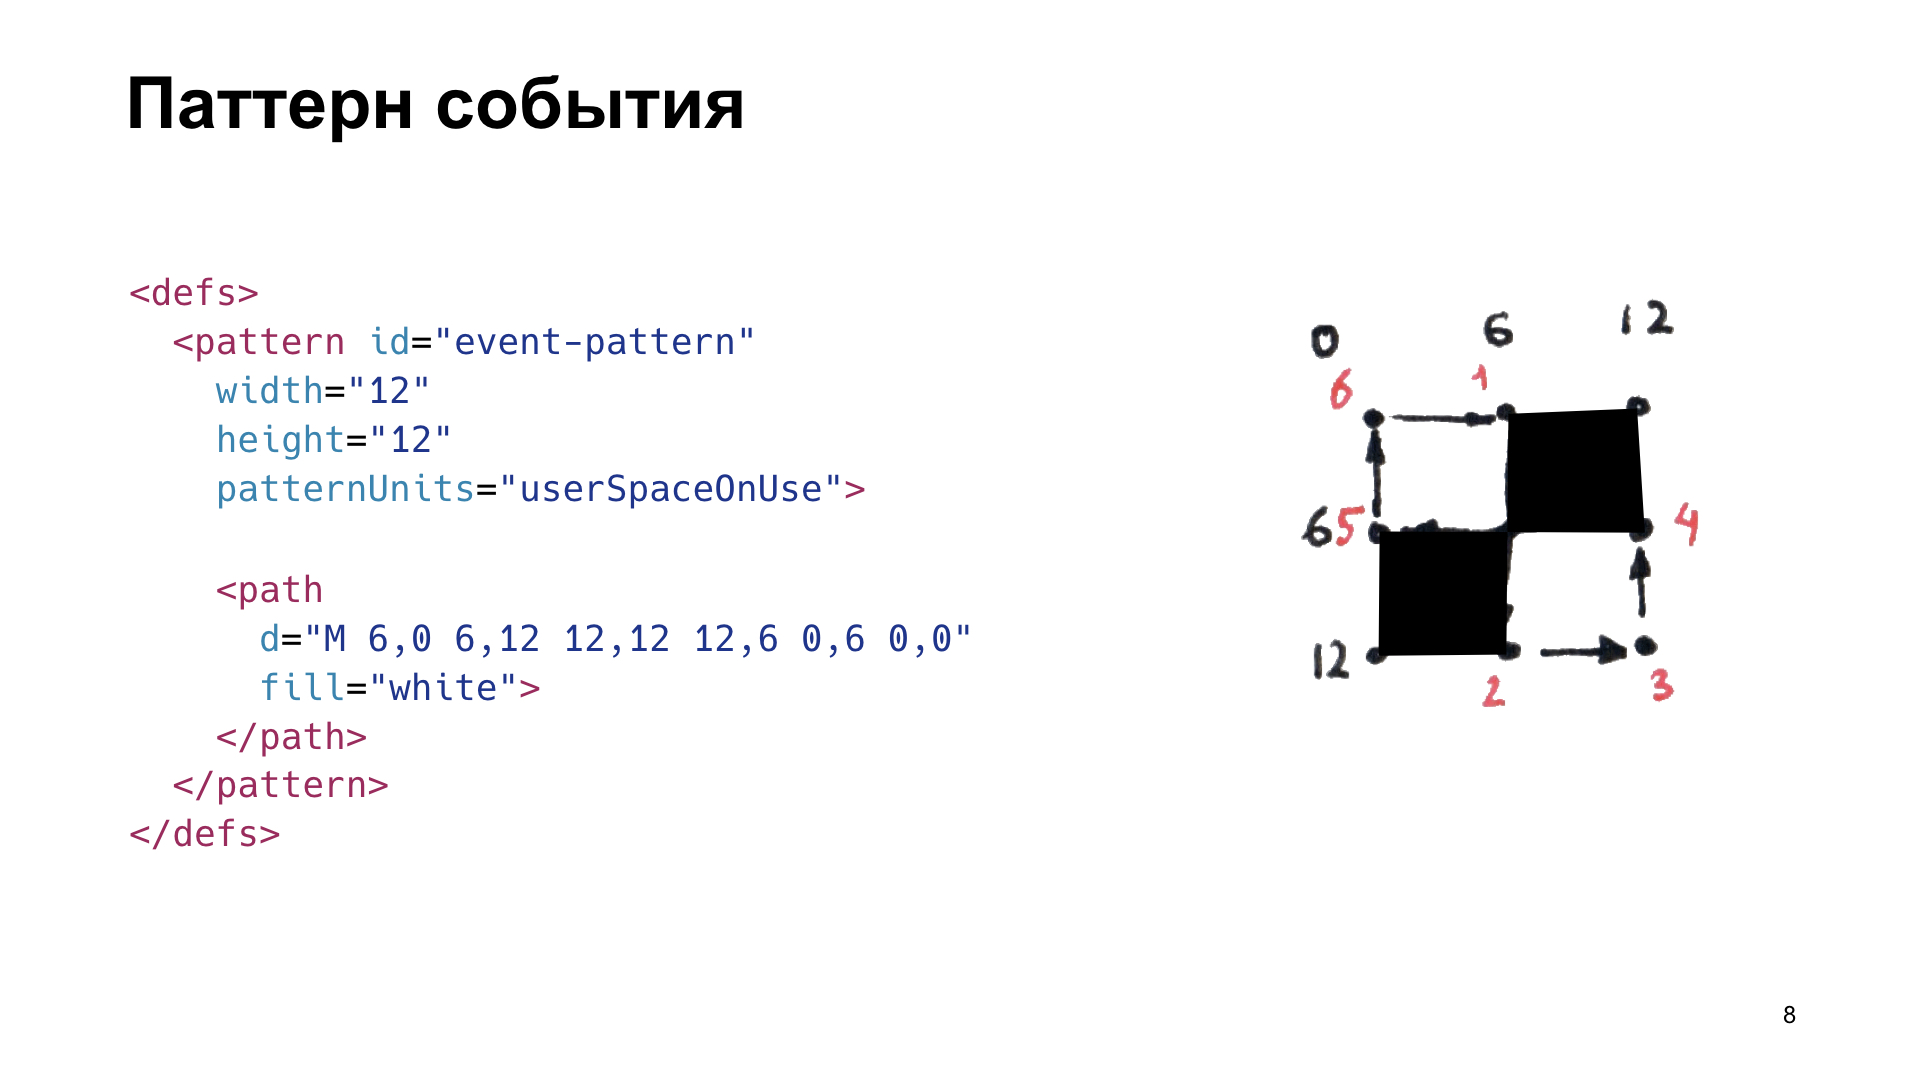
Let's start in order. There is a <defs> tag in SVG, it allows you to declare elements inside it that are not displayed, but you can use them by reference, referring to them. The first thing we will do is declare <defs> and create a pattern in it. <pattern> is a tag that allows you to declare a pattern that can be used to fill a particular element with a particular pattern.
We need to make cells in this pattern. We have 60 by 60 pixels, the cells should be 6 by 6, so we declared a 12 by 12 pattern and draw a <path> inside it, as in the diagram on the left. It has an attribute d, which indicates exactly how the line moves. It starts from the point 0,0, and then the coordinates show the arrows how it is drawn. If we fill it with white, we get the following pattern: what is not flooded with white, is flooded with black.
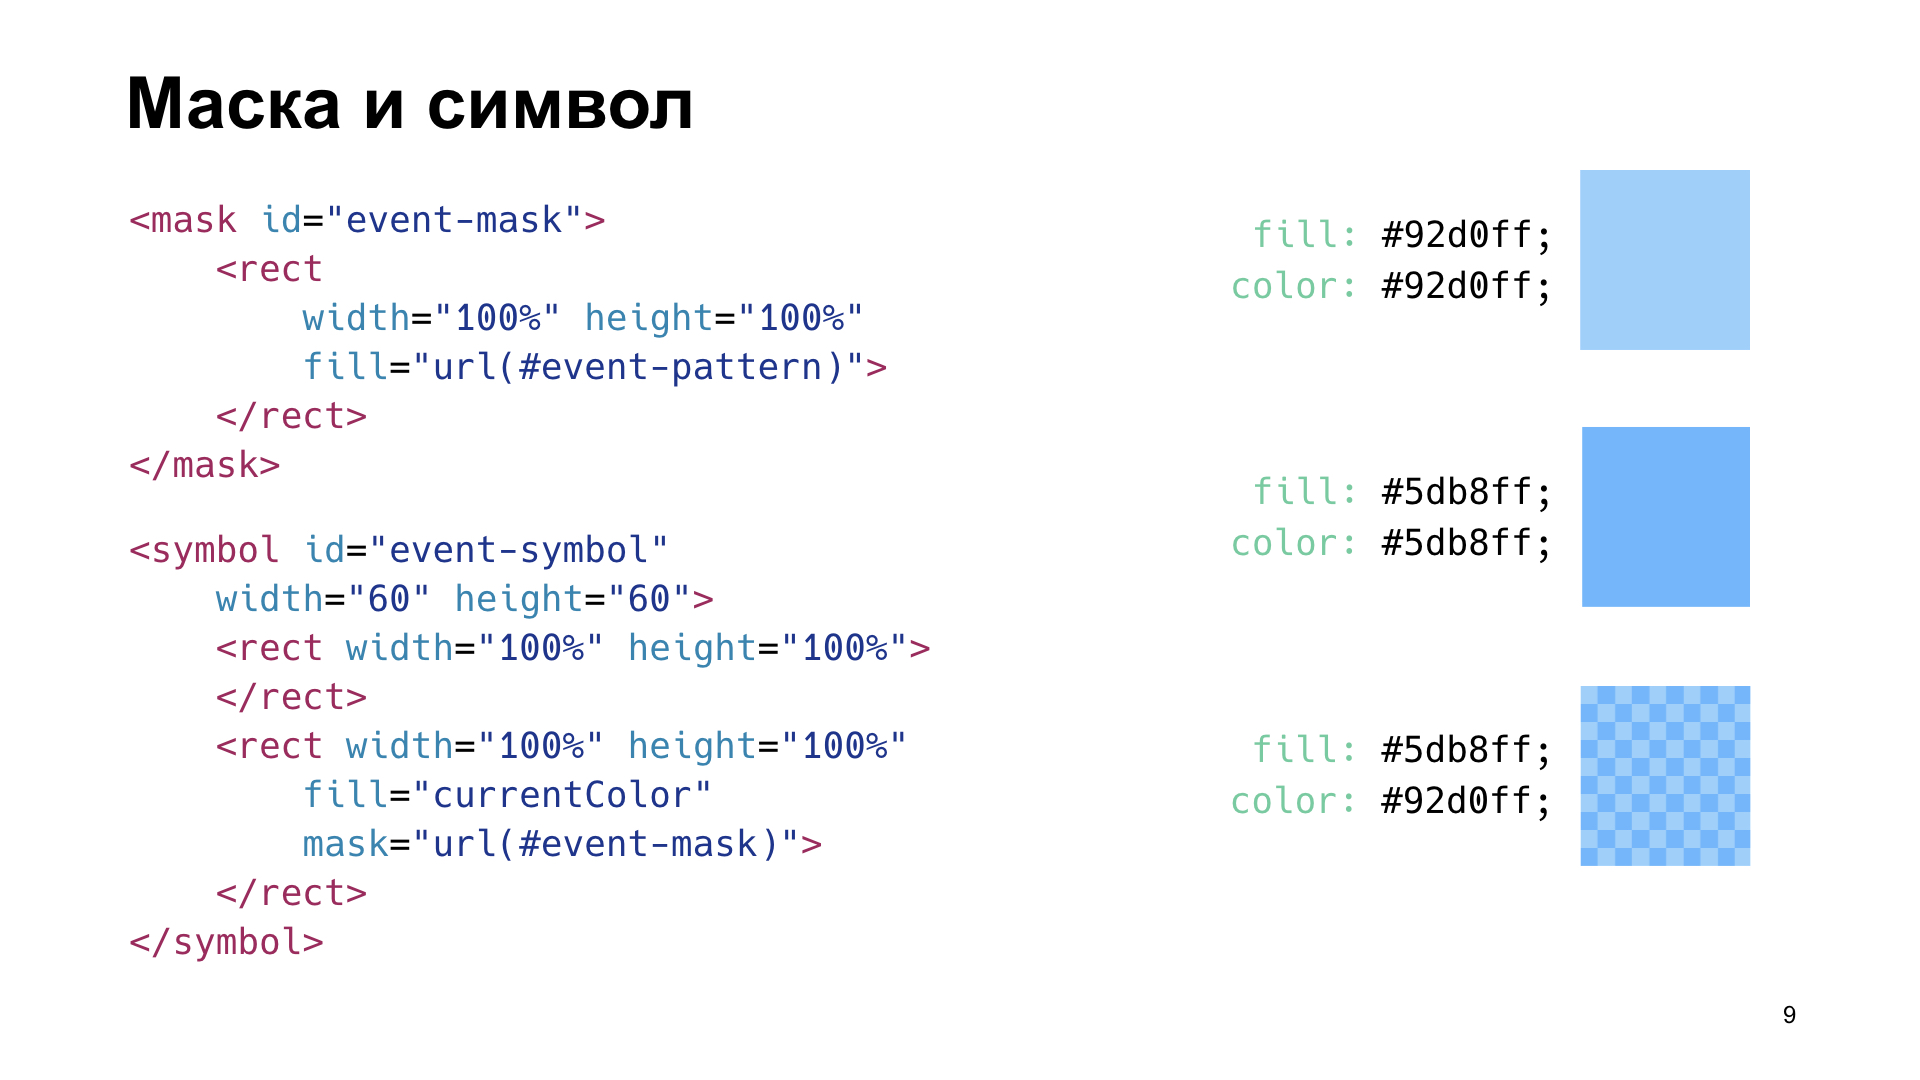
Go to the next step, now declare the mask. <mask> is such an element in SVG that allows you to add an alpha channel to other elements. What is drawn in black in the mask, in that element to which the mask is applied, is invisible, transparent. What is painted in white is opaque. What is gray is translucent. We have a black and white pattern, and we will add a rectangle inside the mask, and fill it with this pattern. Now we have a mask.
The next step is <symbol>. This is such a tag in SVG, which allows you to declare reusable graphics. Most often, symbols are used, for example, for icons. And here we declare a symbol, inside which we put two rectangles. One doesn’t fill with anything so that it inherits the fill property from the parent SVG, and the other will fill with currentColor and apply a mask to it. Now we will have two rectangles: one with holes and filled with currentColor, and the other without holes and filled with fill. And they are lying on top of each other. If we set these colors the same, we will have a solid fill. And if different - cells. This all went. Now you can simply use CSS and through classes set an arbitrary fill of two colors for all events.
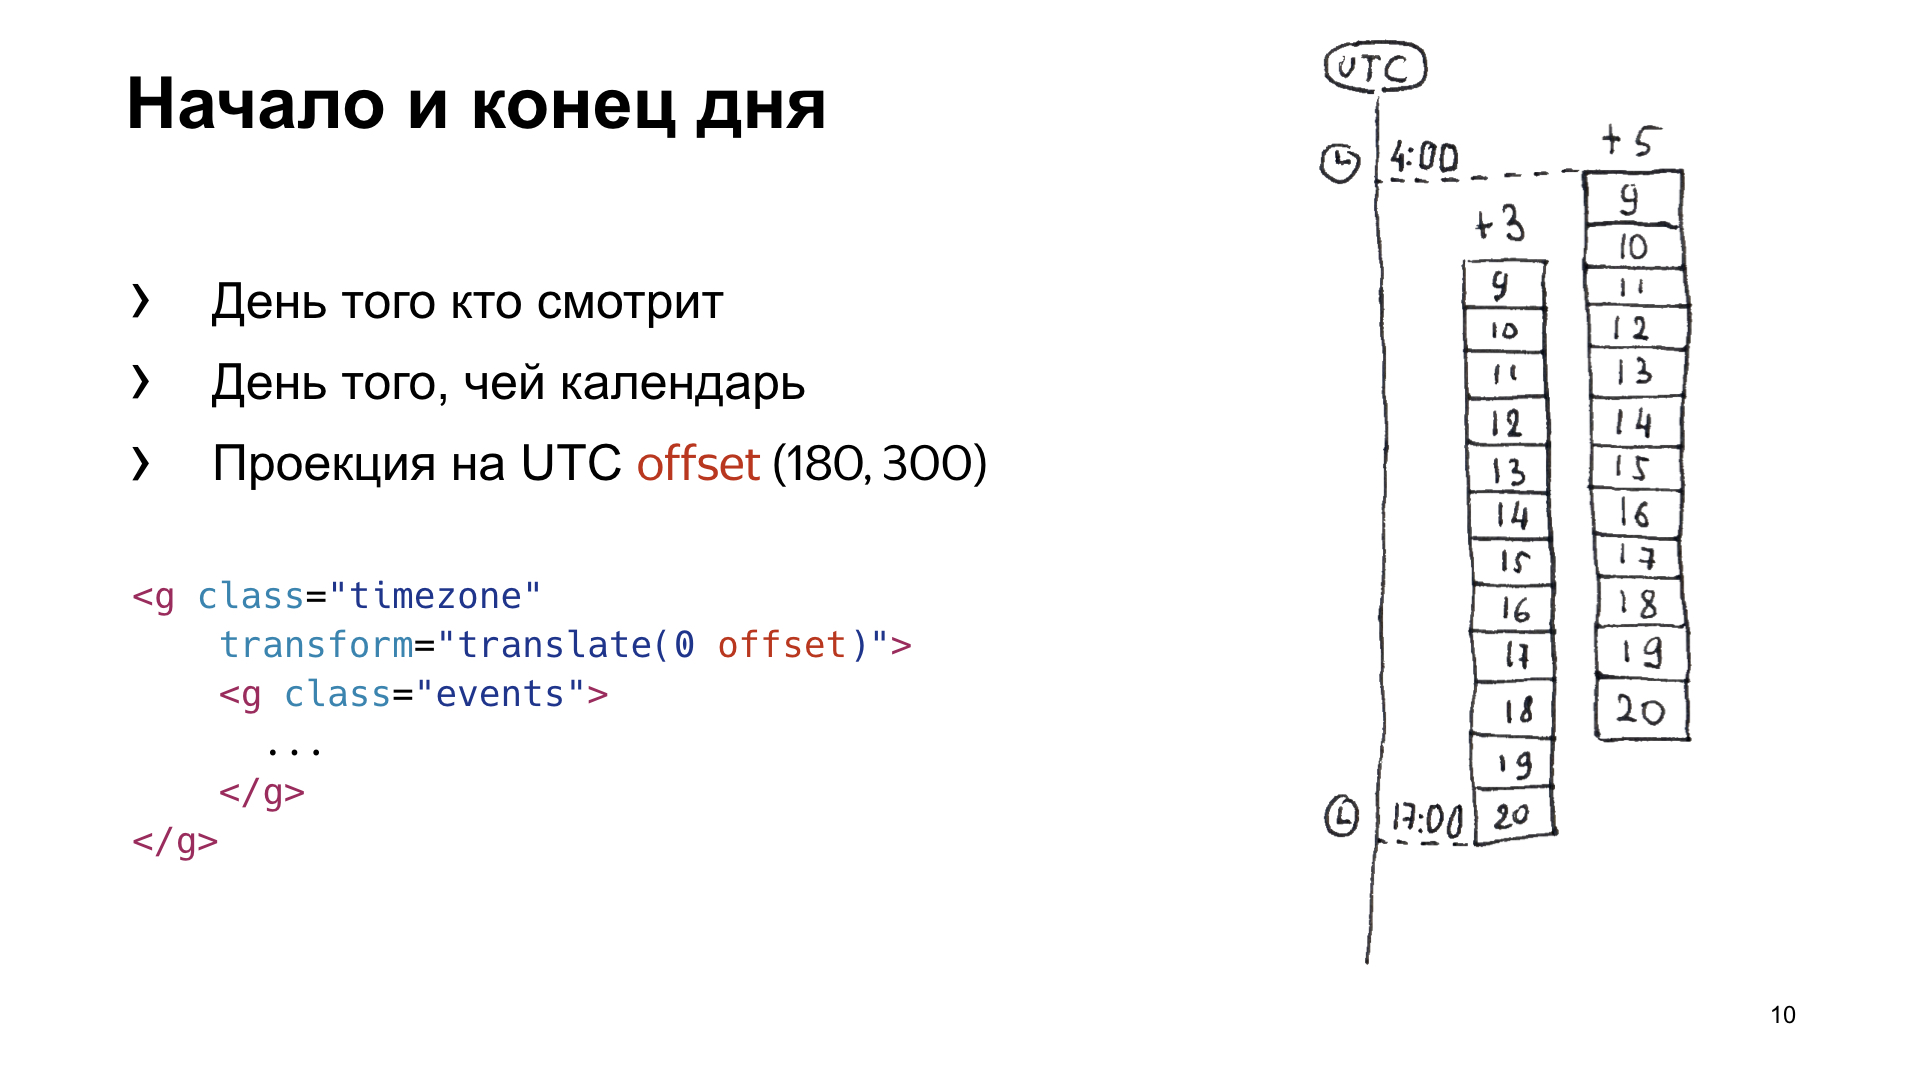
Now we need to determine exactly what events should be included in the calendar on a given day. We have a time zone of +3, in which we all sit, it has a scale from 9 to 20 hours. There is also a person who sits in conditional Orenburg, he has a time zone of +5, his scale is offset by two hours relative to us. We will make a projection on UTC, and we see that on UTC this interval from top to bottom needs to be displayed in the bottom so that the user can, switching between time zones, see both the events that fall into his calendar and the calendar of the person he is looking at .
Remember these numbers, which are in offset, because it is easiest to position the events that arrive in UTC in the same UTC. To do this, we take the <g> tag, which designates a group in SVG, and we position all events there absolutely by UTC, and we will shift <g> by the number of pixels we need to display one or another time zone.

Summing up this study, we get that we have the symbol to which we refer, there is the type of event, level, parity, there is -120 minutes from the beginning of the day in UTC and the duration is 30 minutes. By adding all the events, we get such a picture.

The current time is also done simply, it will be a line with the same non-scaling-stroke effect, so that it is always single-pixel. This is how it is displayed.
Time does not stand still, and it is necessary for the arrow to move. The coolest way we came up with is animation. We decided that we would make an animation that would shift the arrow by the number of minutes in a day, and do it in a day. And so that it does not constantly move slowly, namely, ticking once a minute, we used steps (). And as soon as we added it, time began to move. At the same time, in fact, since the animation does not guarantee that it will constantly move, it either lags behind, or something else. But we have events in the calendar updated from time to time, and somewhere every two to three minutes, or when the user left the tab and returned, the entire calendar is redrawn and the time is updated. Therefore, the animation is visible only when you are sitting and watching intently whether it is ticking or not.

There is one problem. Here I made a calendar wider so that it looked more like the one in production. It became clear that the cells are no longer square. This is because the proportions are not preserved, and if we stretch or change the aspect ratio physically, then it changes as in the picture. To avoid this, you need to write a little JS. There is the aspect ratio viewBox, which was in our original SVG, and the actual aspect ratio, which is used in our layout. If you find the ratio of these ratios and then put it into the transform of the pattern, then the cells will become square. And also this coefficient, which we got here, can be used if we want to understand where the user clicked. Since we have one minute in the original SVG equal to one pixel, then by the coordinates of the click multiplied by this coefficient, we can understand at what time the user got.

It remains to add HTML so that there are letters and numbers on top. Get a calendar.

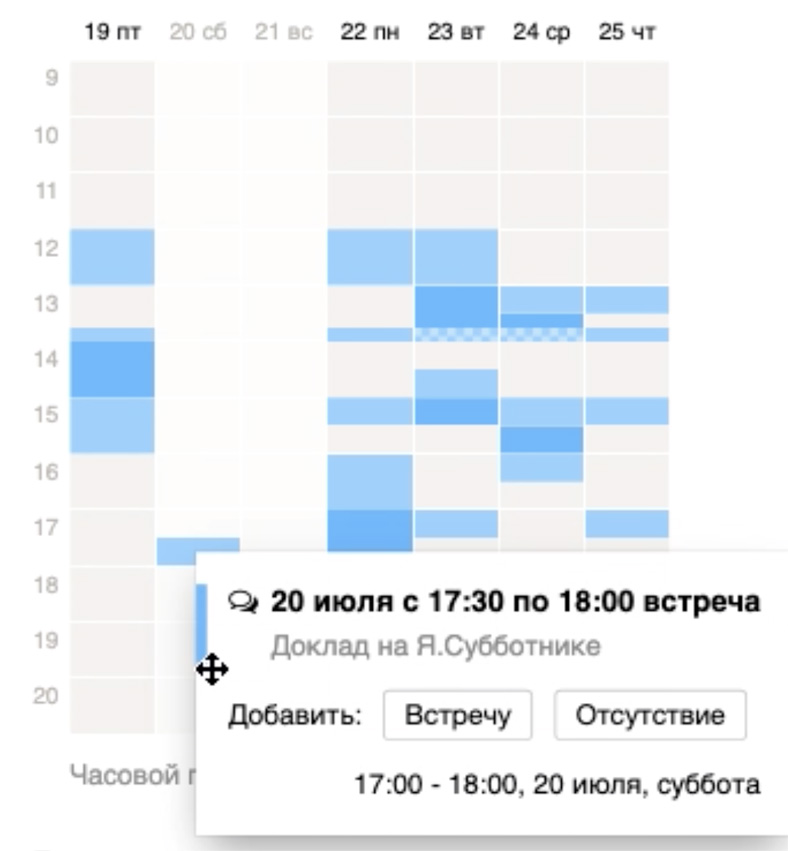
So this thing looks in production through the eyes of a user who sits in the time zone +5. Below is a toggle switch that my colleague presses, and the calendar moves in time zones. Then he clicks on the event and sees that on Saturday in the time zone +5, that is, right now, my report is on.
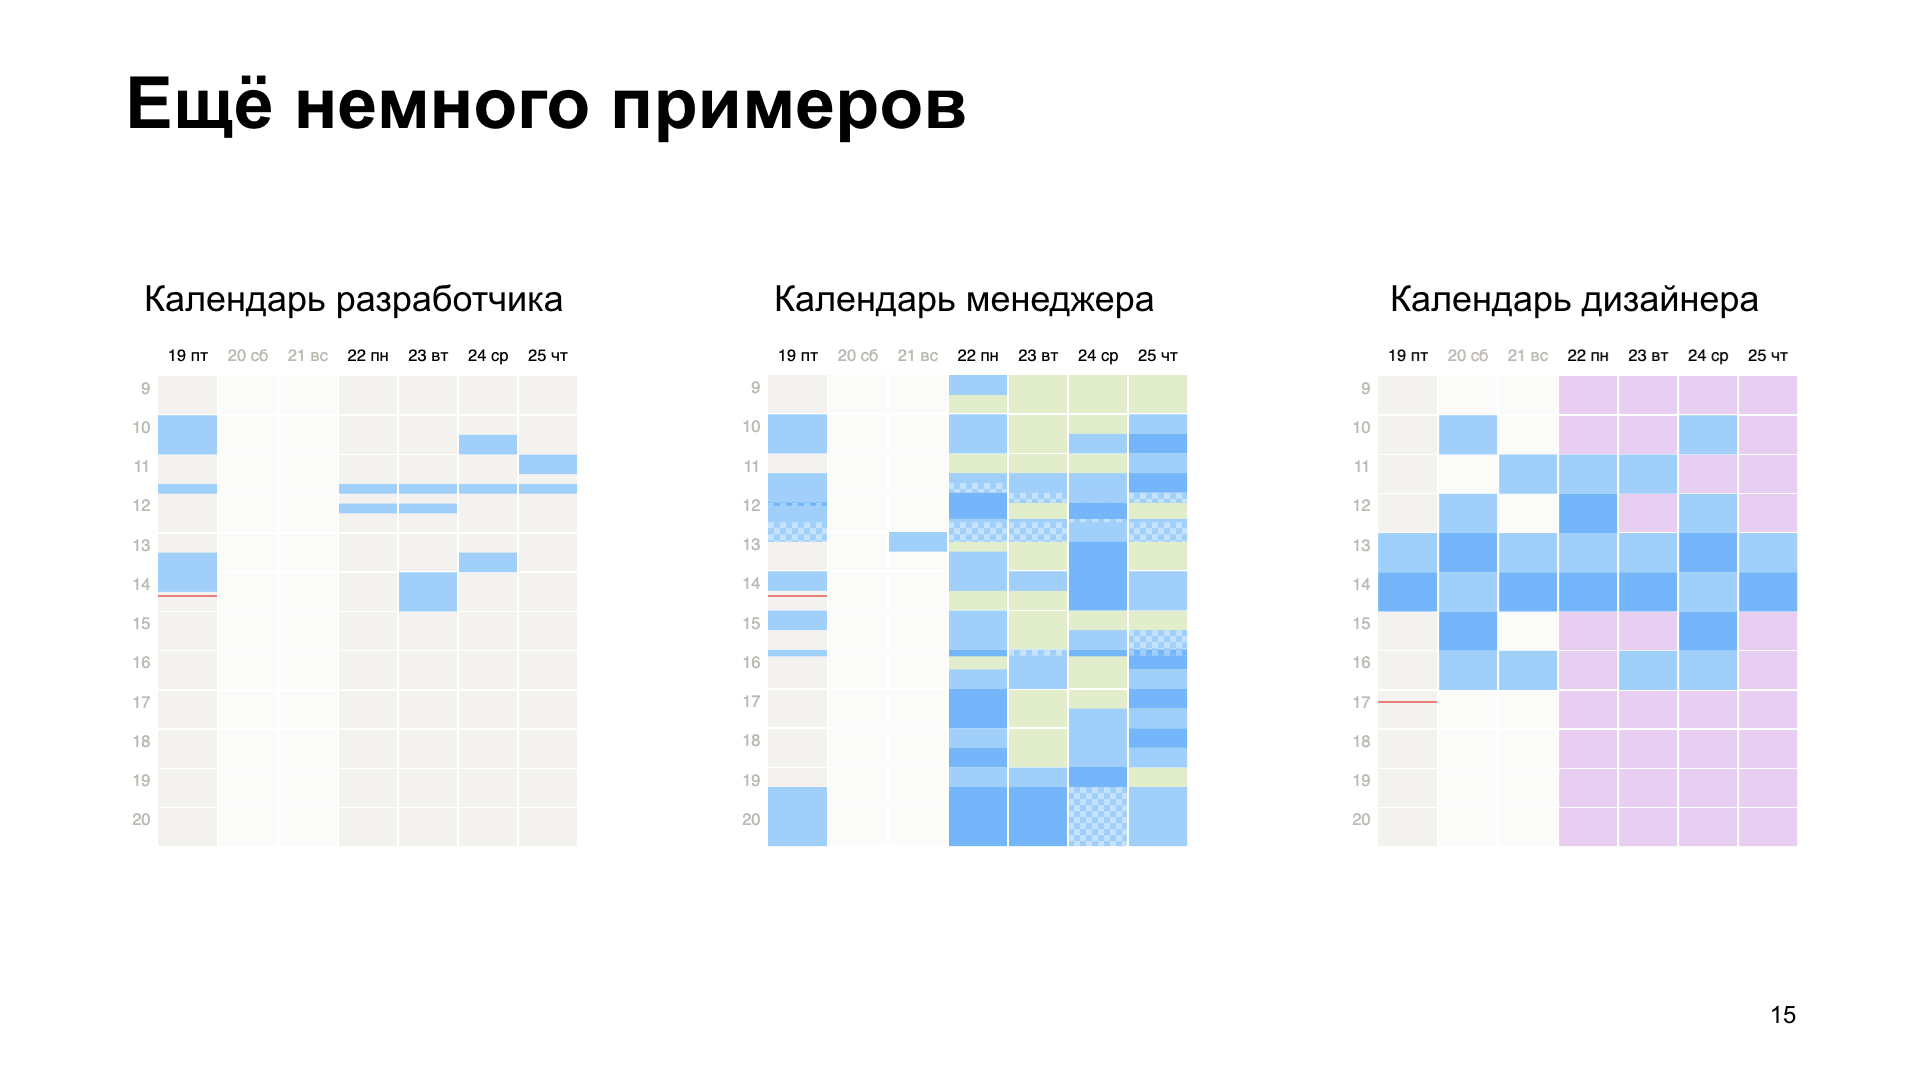
A few more examples. Here is the developer’s calendar, he has stand-ups, several regular meetings and that’s it. Here is the calendar manager. And here is the designer.
Use CSS, use SVG. Thank!
- There are a lot of people working in Yandex, all in different cities, in different time zones, and you need to understand when your colleagues are busy, and when you can meet and talk with them. We decided to design a calendar that will help to find out.
')
We started, of course, with a layout. He looked like this:
It shows even and odd events with different fillings. Events that overlap other events, that is, are on the second layer - another fill. Events that take up all day paint over all day. The current time is displayed below. That was the goal.
We began to choose what we will do it on. Made several different prototypes. We started with canvas, but there was a lot of code, scaling manually to write. We had the idea that the calendar takes up as much space as needed, in different layouts it is of different shapes and sizes. And for canvas it was complicated.
There was a cool prototype when we generated this whole picture with linear gradients, but when it scaled and moved to retina, it moved out. Therefore, in the end, we came to SVG. Why? Firstly, there is a coordinate system that is completely independent of the document, so everything can be absolutely arranged inside, and this will not break regardless of anything. Also there is a normal operation with scaling. Even if you zoom in the browser, if you open the retina or stretch the calendar as you like, it will resize like a picture and look normal anyway. We had a cell fill on the layout, and it’s very good that SVG has a pattern fill.
To draw a calendar, you need some data. To draw the one on the layout, you need to know what date it starts - usually with the current one - to know how many days should be horizontal, how many hours should be displayed vertically and what hour does the day on the calendar begin. We need to somehow get events.
Since we have many offices in different time zones, we decided that events will always arrive in UTC, and we will already display them on the client for users, since there is a need to look at the calendar for our time zone and for the person’s time zone, whose calendar are you looking at - to understand that it is night now, and it’s better not to make an appointment. What is highlighted in red will be used later.
Let's start with the basics. SVG is a giant coordinate plane on which vector graphics can be arbitrarily placed. At the same time, the part of the area that we see is determined by the viewBox, and what is behind its borders is such overflow hidden on steroids. Whatever it is, it will not be visible. We decided that for simplicity of calculations we’ll make one pixel in the calendar equal to one minute. Therefore, one hour will occupy exactly 60 pixels. To make it even easier, we decided that the day in width would also be 60 pixels - so that everything was square, like in the army. And they began to typeset.
Viewbox is set by four parameters. The first two are the upper left point in the coordinate system, from which the viewBox is considered, for us it is 0.0. The width is 60 * for the number of days, and the height is 60 * for the number of hours.
It is valid to insert other SVG documents inside the SVG, which will have their own coordinate system inside. And so that the events in the day could be positioned only along the vertical axis, we decided that for each day we’ll have a separate SVG, and we just shift them horizontally by 60 * to the position of the day in the calendar. Then all the events can be simply set vertically in Y, it will be very convenient. And inside each SVG, which is a day, we put a rectangle that will display the fill of the day.
This rectangle, since no fill color is specified, will inherit the fill property from SVG. In this case, this day is working, and the weekend is two days a week, so they are flooded with light. This is just determined by the classes.
There is a blank. Now you need to add the grid. Since we wanted to resize the calendar, and the grid lines should always be single-pixel, we used the vector-effect = non-scaling-stroke attribute. This leads to the fact that no matter how we resize or zoom, there will always be a one-pixel grid. It is enough just to add the right amount of horizontal and vertical lines, and there will be such a grid.
We’ve figured out the basis, let's move on to all-day events. This is such a tricky thing. You have noticed that there are events on the calendars and there is a “all day” checkmark. These events are different in that they go all day, no matter what time zone you are looking at. Therefore, if somewhere at the very beginning of time zones in Alaska the event begins early in the morning, then somewhere in 48 hours at the opposite end of the globe it will still go on. It sounds complicated, but it’s easiest to implement: just compare the date with the date of the displayed day. If it hits, it means an event on that day. If two events for the whole day fall on the day, then the one that later began is displayed. So fill shows events for the whole day.
With other events it is a little more difficult. There is, let's say, a meeting. It is blue filled, everything is simple. However, if two meetings are held in a row, according to our layout, we fill them with different colors, they are even and odd.
If one meeting intersects with another, lies higher, you need to somehow display it. If there are intersections with meetings, then they are poured completely separately, in cells. And to make us even more fun, we have not only meetings, but also absences, conferences, and much more. I didn’t want to hardcode all this in layout, so we decided to figure out how it is more or less cross-browser and convenient to configure in CSS.
Now there will be the most difficult example from the whole report, be patient and watch, there will be three steps, then it will become easier.
Let's start in order. There is a <defs> tag in SVG, it allows you to declare elements inside it that are not displayed, but you can use them by reference, referring to them. The first thing we will do is declare <defs> and create a pattern in it. <pattern> is a tag that allows you to declare a pattern that can be used to fill a particular element with a particular pattern.
We need to make cells in this pattern. We have 60 by 60 pixels, the cells should be 6 by 6, so we declared a 12 by 12 pattern and draw a <path> inside it, as in the diagram on the left. It has an attribute d, which indicates exactly how the line moves. It starts from the point 0,0, and then the coordinates show the arrows how it is drawn. If we fill it with white, we get the following pattern: what is not flooded with white, is flooded with black.
Go to the next step, now declare the mask. <mask> is such an element in SVG that allows you to add an alpha channel to other elements. What is drawn in black in the mask, in that element to which the mask is applied, is invisible, transparent. What is painted in white is opaque. What is gray is translucent. We have a black and white pattern, and we will add a rectangle inside the mask, and fill it with this pattern. Now we have a mask.
The next step is <symbol>. This is such a tag in SVG, which allows you to declare reusable graphics. Most often, symbols are used, for example, for icons. And here we declare a symbol, inside which we put two rectangles. One doesn’t fill with anything so that it inherits the fill property from the parent SVG, and the other will fill with currentColor and apply a mask to it. Now we will have two rectangles: one with holes and filled with currentColor, and the other without holes and filled with fill. And they are lying on top of each other. If we set these colors the same, we will have a solid fill. And if different - cells. This all went. Now you can simply use CSS and through classes set an arbitrary fill of two colors for all events.
Now we need to determine exactly what events should be included in the calendar on a given day. We have a time zone of +3, in which we all sit, it has a scale from 9 to 20 hours. There is also a person who sits in conditional Orenburg, he has a time zone of +5, his scale is offset by two hours relative to us. We will make a projection on UTC, and we see that on UTC this interval from top to bottom needs to be displayed in the bottom so that the user can, switching between time zones, see both the events that fall into his calendar and the calendar of the person he is looking at .
Remember these numbers, which are in offset, because it is easiest to position the events that arrive in UTC in the same UTC. To do this, we take the <g> tag, which designates a group in SVG, and we position all events there absolutely by UTC, and we will shift <g> by the number of pixels we need to display one or another time zone.
Summing up this study, we get that we have the symbol to which we refer, there is the type of event, level, parity, there is -120 minutes from the beginning of the day in UTC and the duration is 30 minutes. By adding all the events, we get such a picture.
The current time is also done simply, it will be a line with the same non-scaling-stroke effect, so that it is always single-pixel. This is how it is displayed.
Time does not stand still, and it is necessary for the arrow to move. The coolest way we came up with is animation. We decided that we would make an animation that would shift the arrow by the number of minutes in a day, and do it in a day. And so that it does not constantly move slowly, namely, ticking once a minute, we used steps (). And as soon as we added it, time began to move. At the same time, in fact, since the animation does not guarantee that it will constantly move, it either lags behind, or something else. But we have events in the calendar updated from time to time, and somewhere every two to three minutes, or when the user left the tab and returned, the entire calendar is redrawn and the time is updated. Therefore, the animation is visible only when you are sitting and watching intently whether it is ticking or not.
There is one problem. Here I made a calendar wider so that it looked more like the one in production. It became clear that the cells are no longer square. This is because the proportions are not preserved, and if we stretch or change the aspect ratio physically, then it changes as in the picture. To avoid this, you need to write a little JS. There is the aspect ratio viewBox, which was in our original SVG, and the actual aspect ratio, which is used in our layout. If you find the ratio of these ratios and then put it into the transform of the pattern, then the cells will become square. And also this coefficient, which we got here, can be used if we want to understand where the user clicked. Since we have one minute in the original SVG equal to one pixel, then by the coordinates of the click multiplied by this coefficient, we can understand at what time the user got.
It remains to add HTML so that there are letters and numbers on top. Get a calendar.
So this thing looks in production through the eyes of a user who sits in the time zone +5. Below is a toggle switch that my colleague presses, and the calendar moves in time zones. Then he clicks on the event and sees that on Saturday in the time zone +5, that is, right now, my report is on.
A few more examples. Here is the developer’s calendar, he has stand-ups, several regular meetings and that’s it. Here is the calendar manager. And here is the designer.
Use CSS, use SVG. Thank!
Source: https://habr.com/ru/post/461571/
All Articles