Visualization of the sleep of the first year of the child on the patterns of the blanket

The IT father visualized data on the sleep and wakefulness of his son’s first year of life. I did it myself - programmatically processed the data and tied a blanket, which shows the activity of his baby for a year.
A very creative dad named Lee Son decided to capture the tangible moments of his son’s wakefulness and sleep .

')
Data collection and processing
Lee Son collected his son’s sleep and wakefulness data, manually registering it using the Baby Connect app .
Further, the data from the BabyConnect application was exported to CSV files, which were filtered and converted to JSON (using Google Apps Script and Python) using a script.
Lee’s script divided sleep data into 6-minute intervals in table 366x240, where 240 is the stitches per day (24x10), 366 is the number of days per year, given the different color of the situation — whether the sleep phase occurred in these six minutes or the child was awake and active.
Lee left the first two lines completely white - for testing and connection to an external protective circuit.

In this way, Lee got the right data components for visualization.
Lee also mastered the tricks of knitting, learned several techniques and practiced double loops (hereinafter referred to as stitches to simplify).
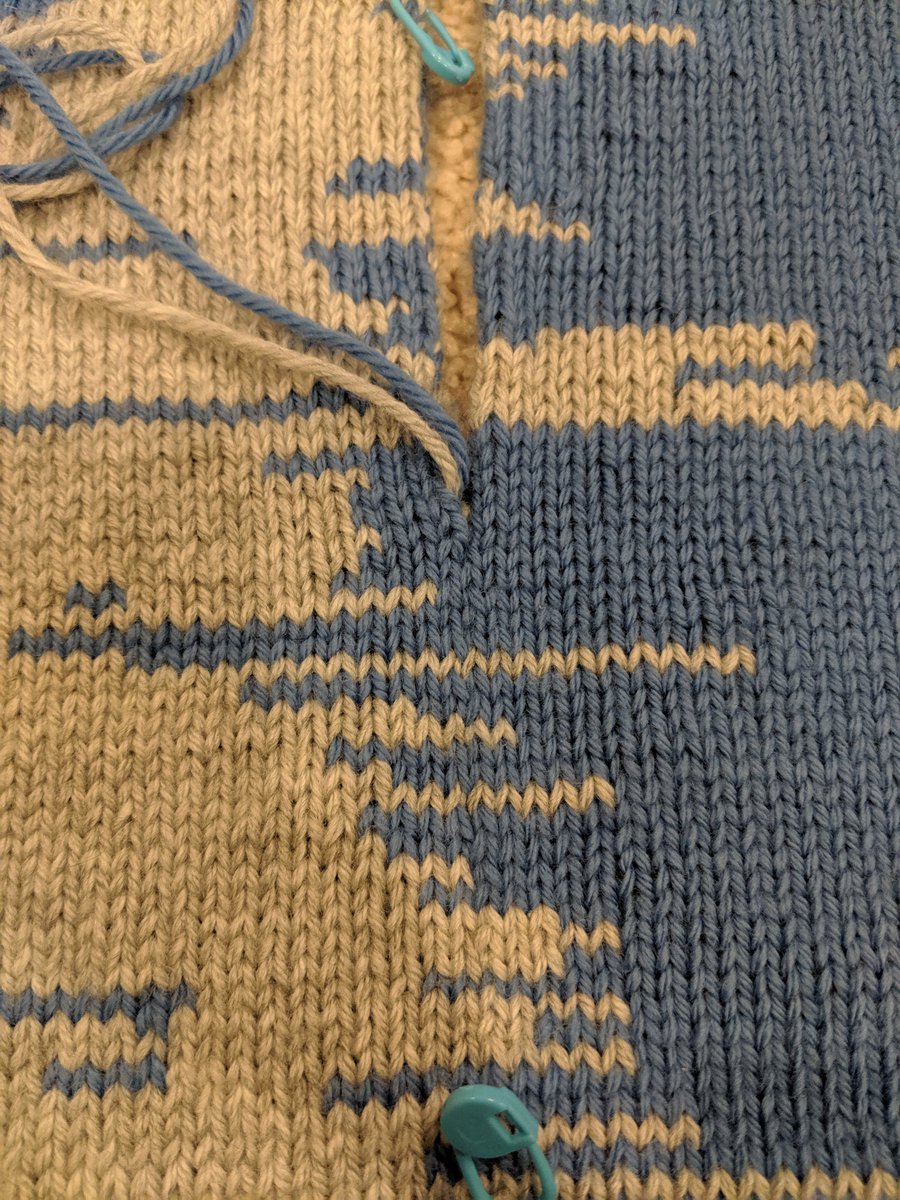
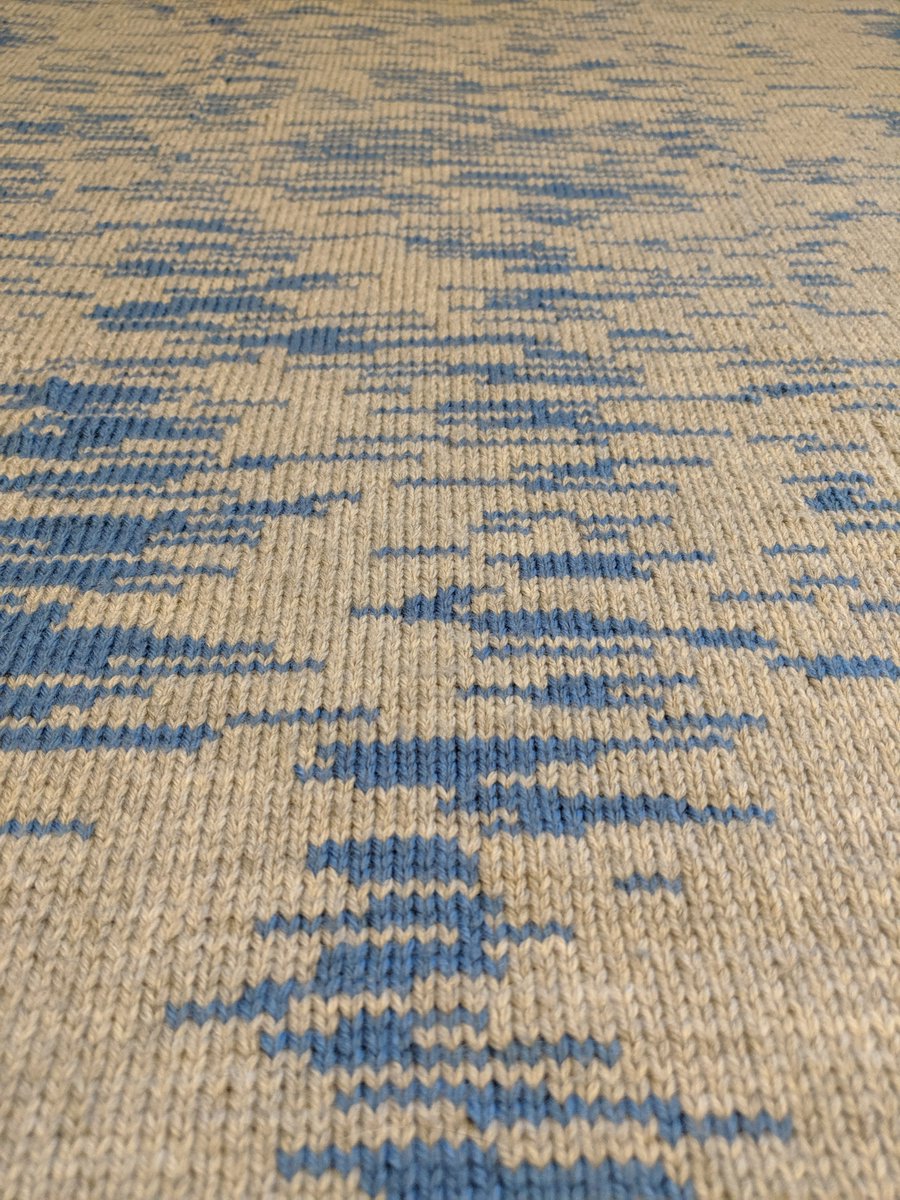
By the way, this pattern is called " Double-sided Jacquard ."
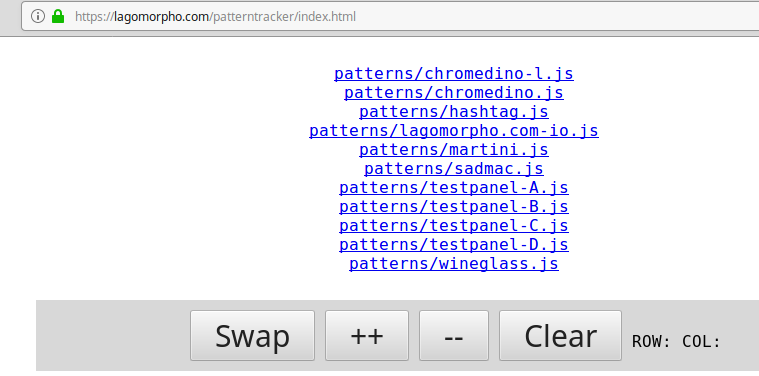
Then Lee created his sewing-browser tool in HTML / Javascript, which converted data into colors and stitch layouts, and also allowed Lee to work with data from any device, wherever he was.
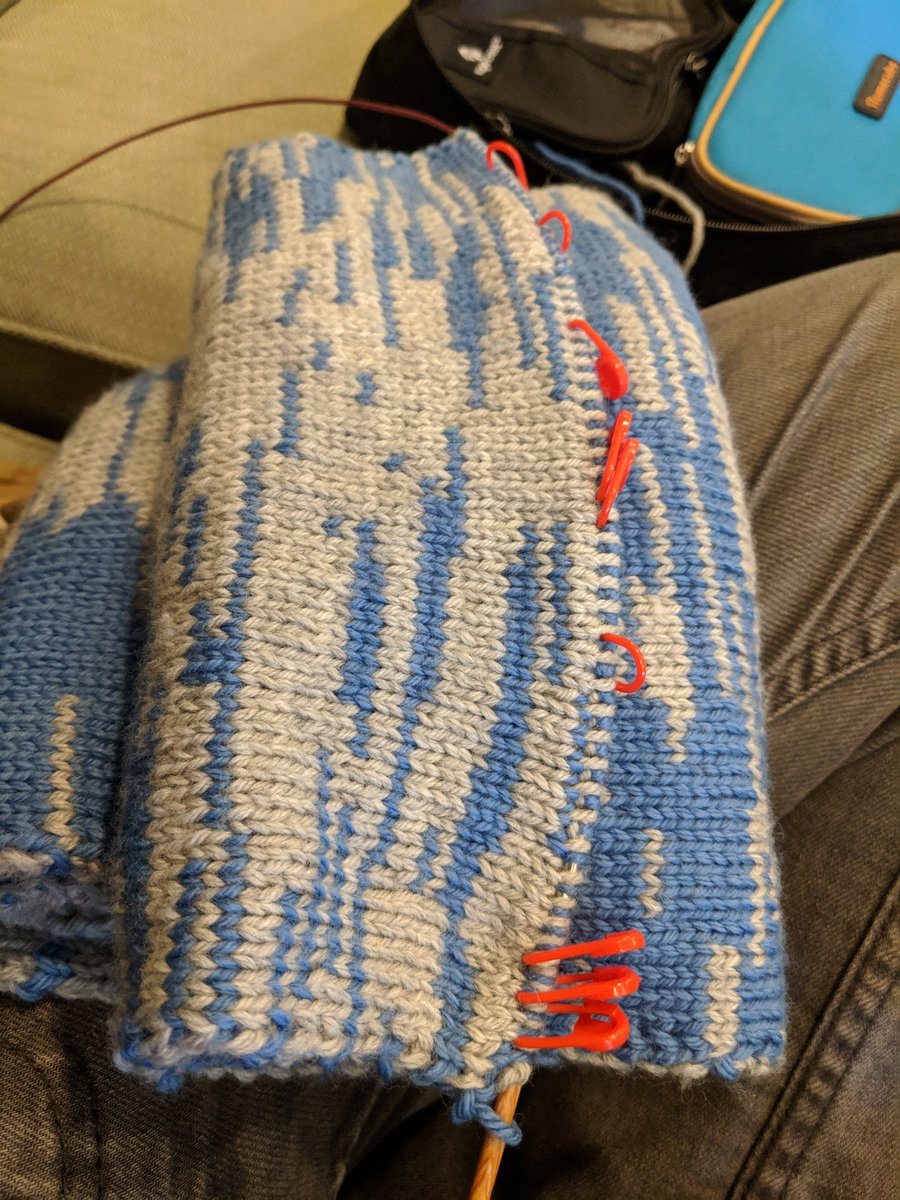
With this tool, Lee placed stitch markers, noted where to change the color, and tracked the overall progress of processing and converting data into blanket elements when he knitted.
Link to the Lee tool.

Lee spent a lot of preparatory work before he began to make his first real attempts to knit the elements of the blanket.
Making a Sleeping Blanket
After receiving and processing data on the periods of wakefulness and sleep of his son, Lee was left to visualize them using two colors (blue - sleep \ light - activity) and three hundred hours of hand knitting.
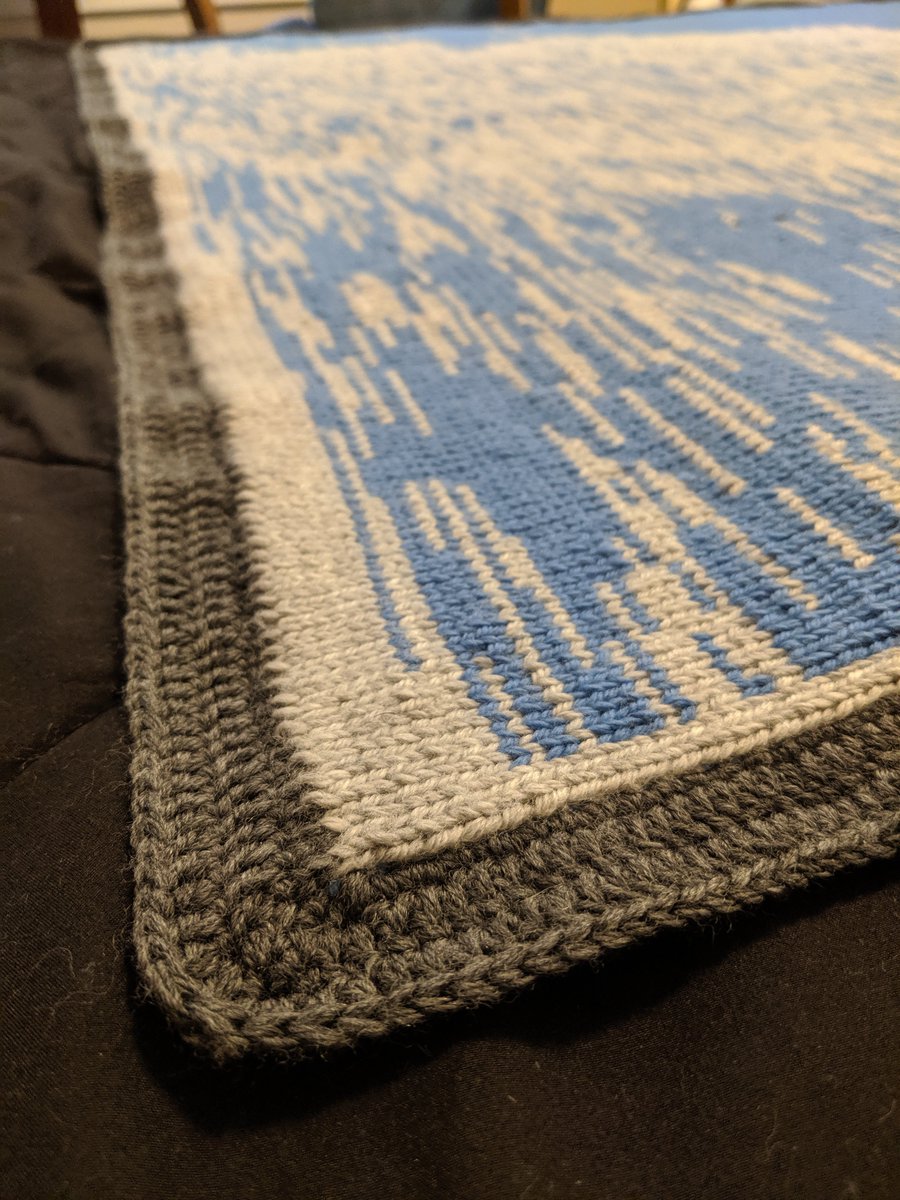
Lee's initial plan was to crochet the entire blanket, but then he realized that it was better to use double stitches, because in this case the data is much more clearly visualized, and changing the color of the stitches (there were literally thousands) is much easier to do.

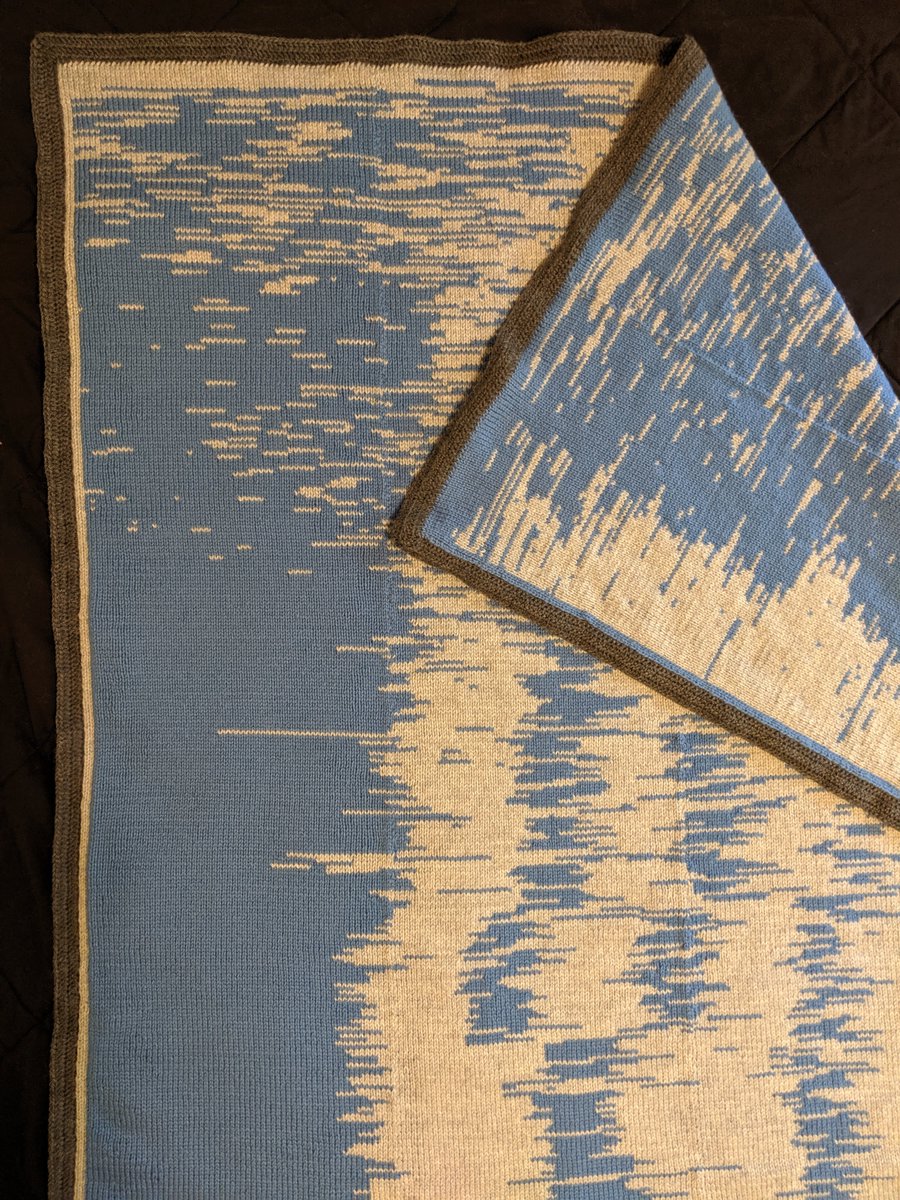
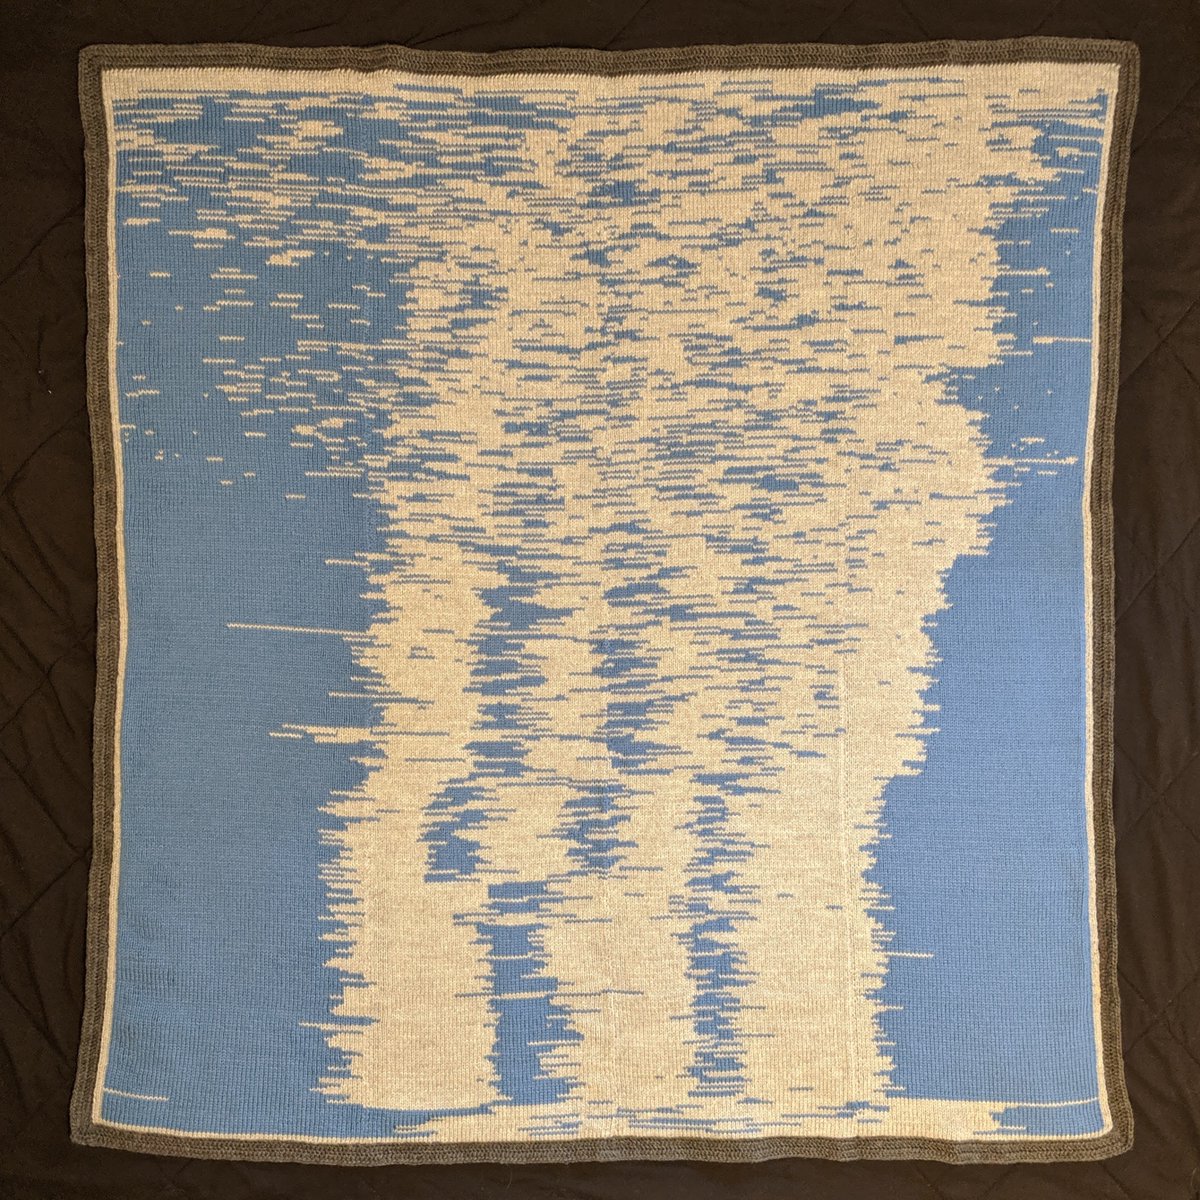
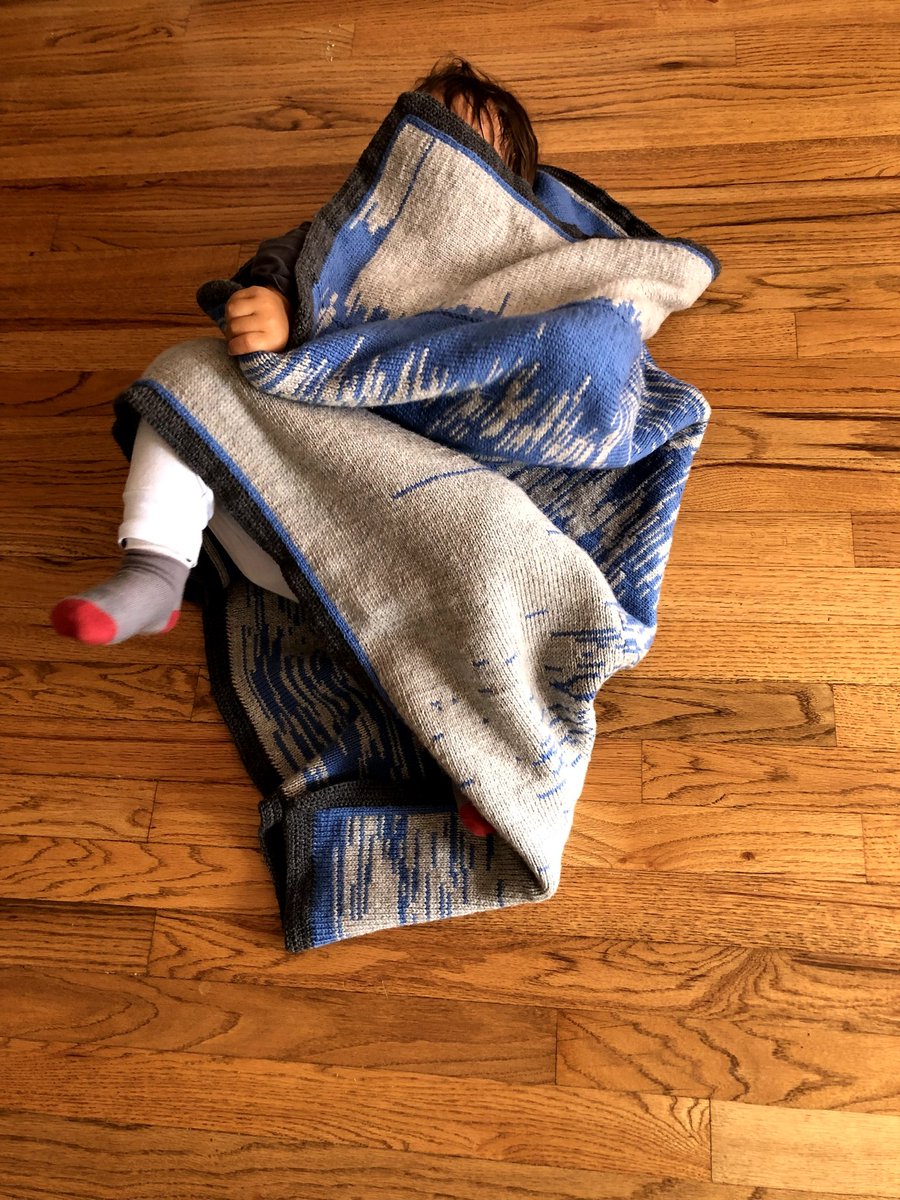
As a result, Lee managed to create a “Sleeping Blanket” - a wonderful keepsake telling the story of the first year of life of a child and even his parents.
Blanket Parameters:
- 366 lines (+ external protective circuit + 2 lines white for the inner perimeter), each line represents one day in the life of the child;
- 185,000 stitches (including stitches for the outer loop), each stitch inside the loop represents 6 minutes of time spent by son Lee awake or asleep;
- blanket size 42x45 inches (107x114 cm);
- Spent time knitting about 300 hours (in real time 104 days).
How to read blankets
Each row on a blanket represents one day of the life of Lee's son.
The top row is when the baby was born, and the bottom row is the first birthday of Lee's son.
Each stitch represents six minutes of time spent by the child awake (gray) or sleeping (blue).
The blanket is “read” from left to right, with the leftmost line starting at 12:00 AM and the rightmost line ending at 11:54 PM.
The change in Lee’s sleep patterns towards the end of the blanket can be explained by a cross-country trip that the family took to celebrate the child’s birthday.
Lee considered adjusting these timestamps, but left them as part of his son’s story.
The accuracy of knitting on such a blanket makes it an excellent medium for visualizing data, and it is priceless to keep and hold in your hands the history of the first year of a child’s life.
Source: https://habr.com/ru/post/461533/
All Articles