Debugging algorithms on graphs - now with pictures
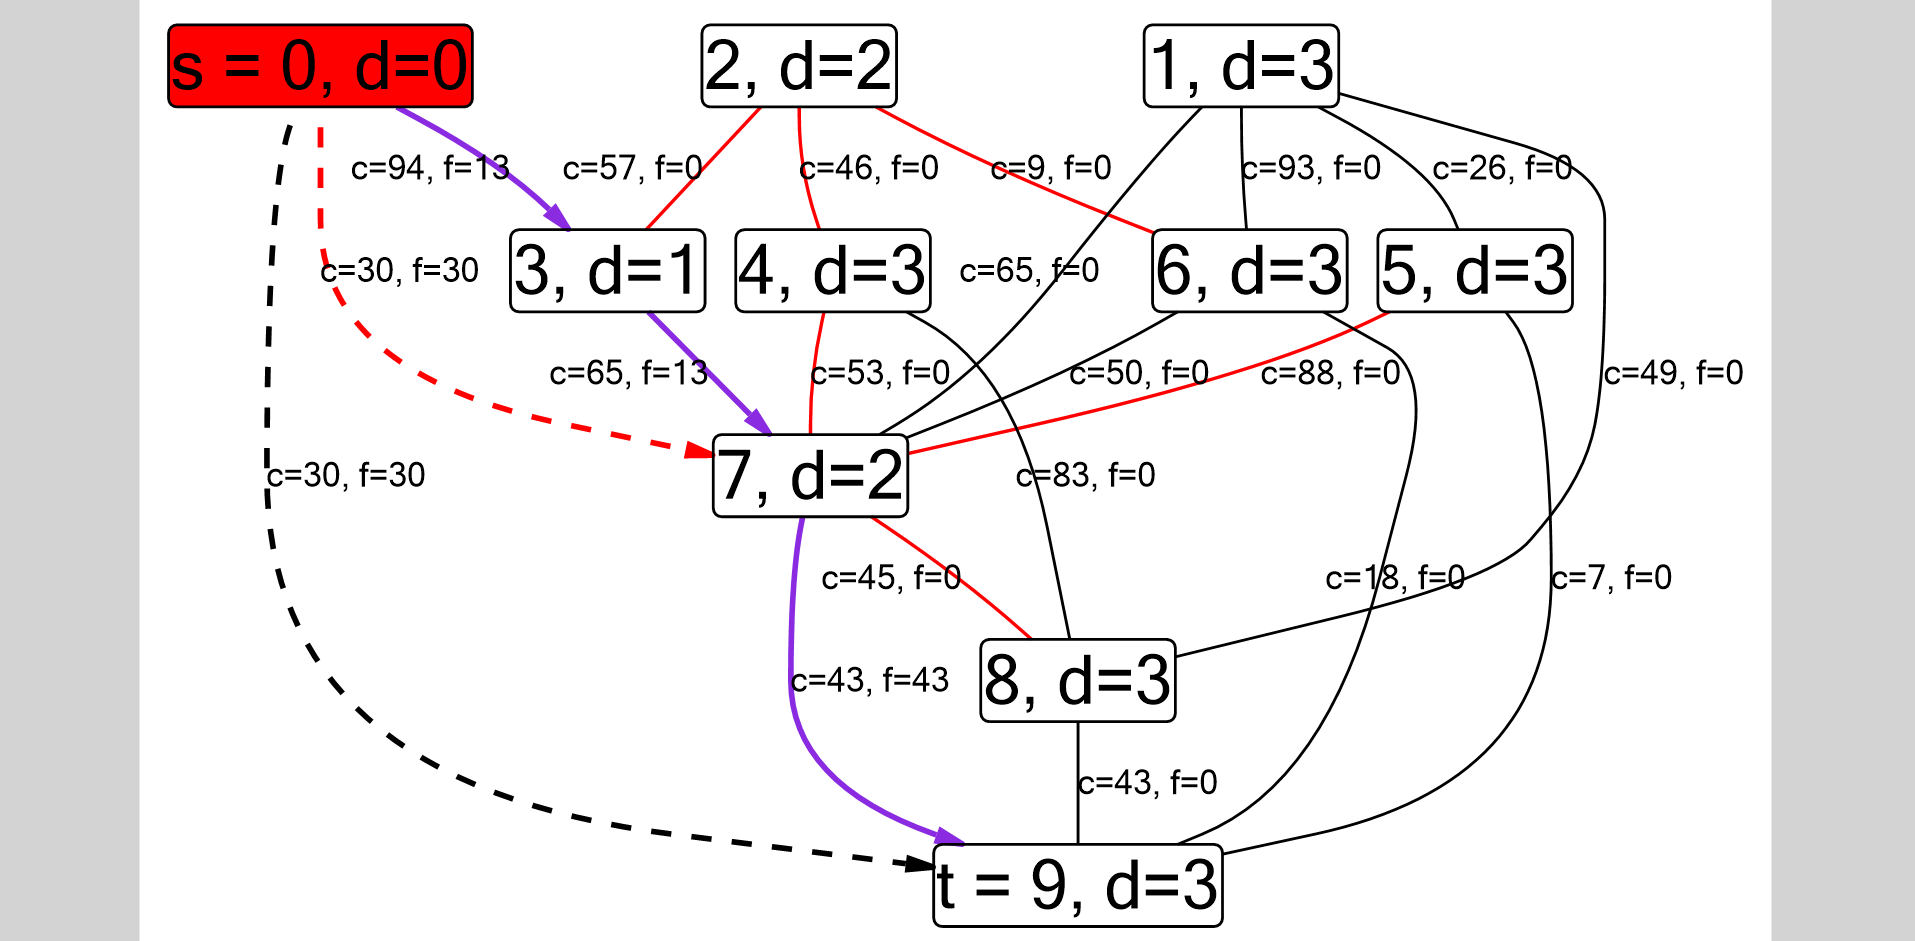
Let's imagine a typical situation in the first year: you read about the Dinits algorithm , implemented it, but it didn’t work, and you don’t know why. The standard solution is to start debugging in steps, each time drawing the current state of the graph on a piece of paper, but this is terribly inconvenient. I tried to correct the situation as part of a semester project on Software Engineering, and in a post I will tell you how I ended up with a plug-in for Visual Studio. You can download it here , the source code and documentation can be found here . Here is a screenshot of the graph obtained for the Dinitsa algorithm.
My name is Olga, I graduated from the third year of the direction "Applied Mathematics and Computer Science" at the St. Petersburg HSE with a degree in Software Engineering. Before entering the university, I was not involved in programming.
')
At our faculty practice semester research work. Usually this happens like this: at the beginning of the semester, a presentation of research works takes place - representatives of different companies offer all kinds of projects. Then students choose their favorite projects, supervisors choose their favorite students, and so on. In the end, each student finds a project for himself.
But there is another way: you can independently find a supervisor and a project, and then convince the curator that this project can really be a full-fledged R&D. To do this, prove that:
I chose the second way. The first thing to do after I agreed with the supervisor was to find the topic of the project. The list of ideas included: code style checker for Lua, a debugger that allows you to calculate expressions in parts, and a tool for olympiads / programming training, which allows you to visualize what is happening in the code. That is, a visualizer for arbitrary data structures combined with a debugger. For example, a person writes a Cartesian tree , and in the process peaks, edges, the current peak and so on are drawn. In the end, I decided to stay on this option.
My work on the project consisted of the following stages:
I have always carried out planning with my supervisor. We also always came up with and discussed all ideas that arose along the way. In addition, the supervisor advised me on the code and helped with time management. About all technical problems (incomprehensible bugs, etc.) I also always reported, but most often I managed to solve them myself.
To begin with, our leadership should have been convinced that this topic deserves to be my research work. And you should start from the first point: the search for analogues.
As it turned out, there are many analogues. But most of them were designed for visualization of memory. That is, they would have done a great job with the visualization of the Cartesian tree, but they cannot understand that a bunch on an array should not be drawn as an array, but as a tree. Among these analogues were gdbgui , Data Display Debugger , a plug-in for Eclipse jGRASP, and a plug-in for Visual Studio Data Structures Visualizer . The latter was also created for the problems of olympiad programming, but was able to visualize only data structures on pointers.
There were several more tools: Algojammer for python (and we wanted pluses, as the most popular language among olympiadniki) and the Lens tool developed in 1994. The latter, judging by the description, did almost what it needed, but, unfortunately, it was created under Sun OS 4.1.3 (an operating system from 1992). So, despite the availability of source codes, it was decided not to waste time on this dubious archeology.
So, after some research it was found that Tula, which would do exactly what we wanted, and at the same time work on modern machines, is not in nature yet.
The second step was to prove that this task is quite complicated, but doable. To do this, it was necessary to propose something more specific than “I want a beautiful picture, and that everything becomes clear from it immediately”.
In this project, we decided to concentrate on visualizing only graphs: there are many algorithms on graphs that can be implemented in different ways, and even when narrowed, the task still remains non-trivial.
It is also more or less obvious that the tool must somehow be integrated with the debugger. We need to be able to view the values of variables and expressions, and draw a finished picture from these values.
After that, it was necessary to come up with a certain language that allows us to build a graph according to the current state of the program the way we want. In addition to the graph itself, it was necessary to provide for the ability to change the color of the vertices and edges, add arbitrary labels to them and change other properties. Accordingly, the first idea was:
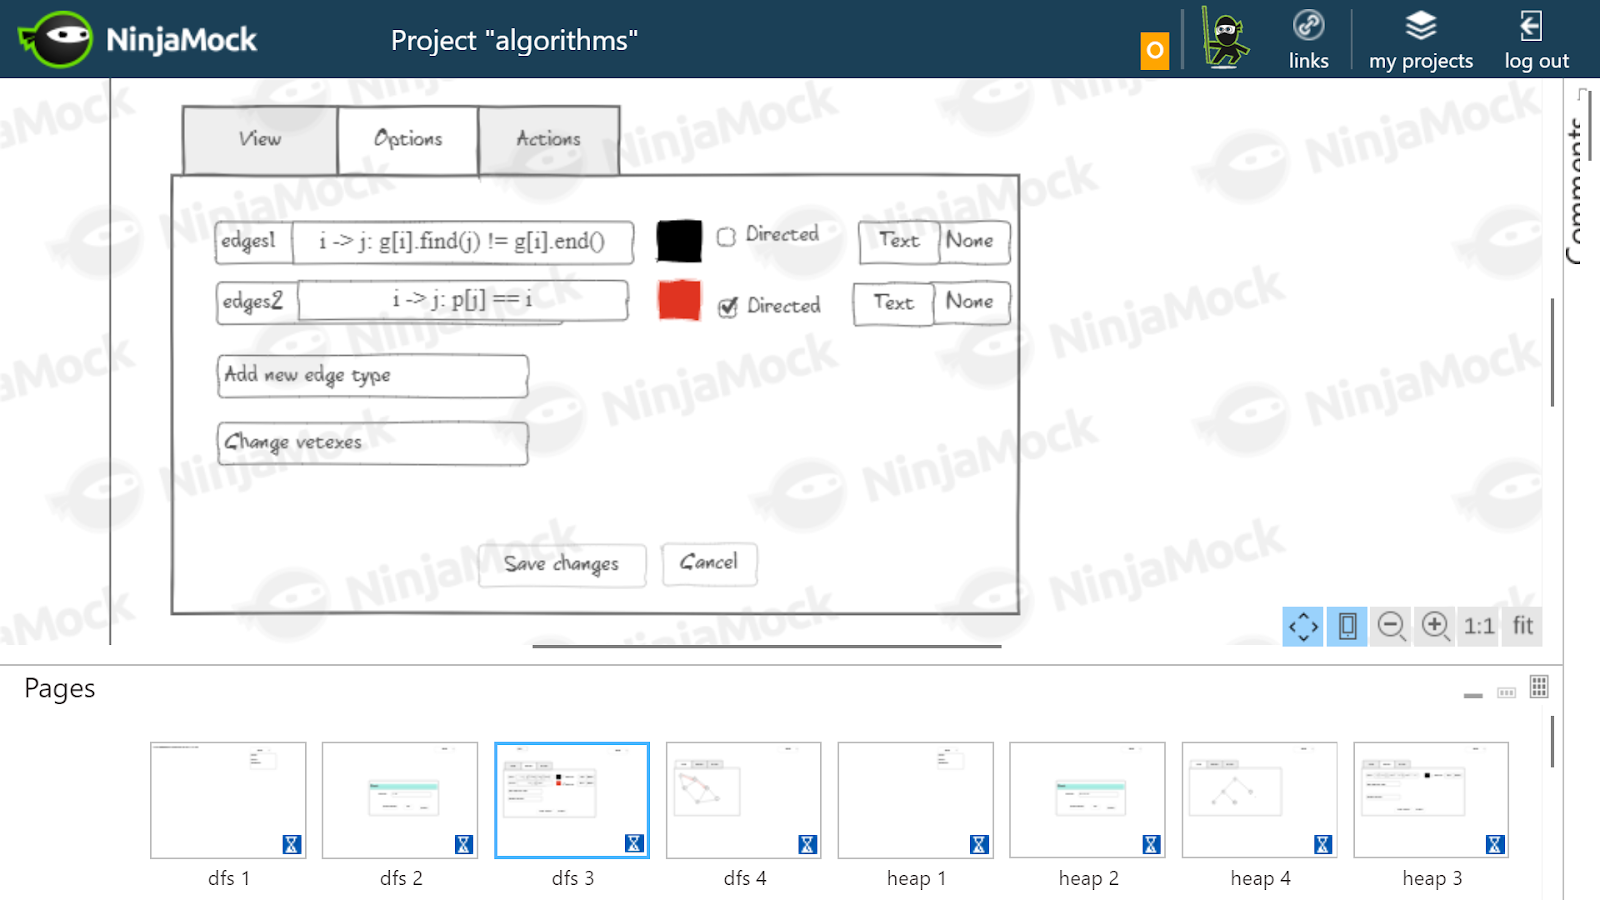
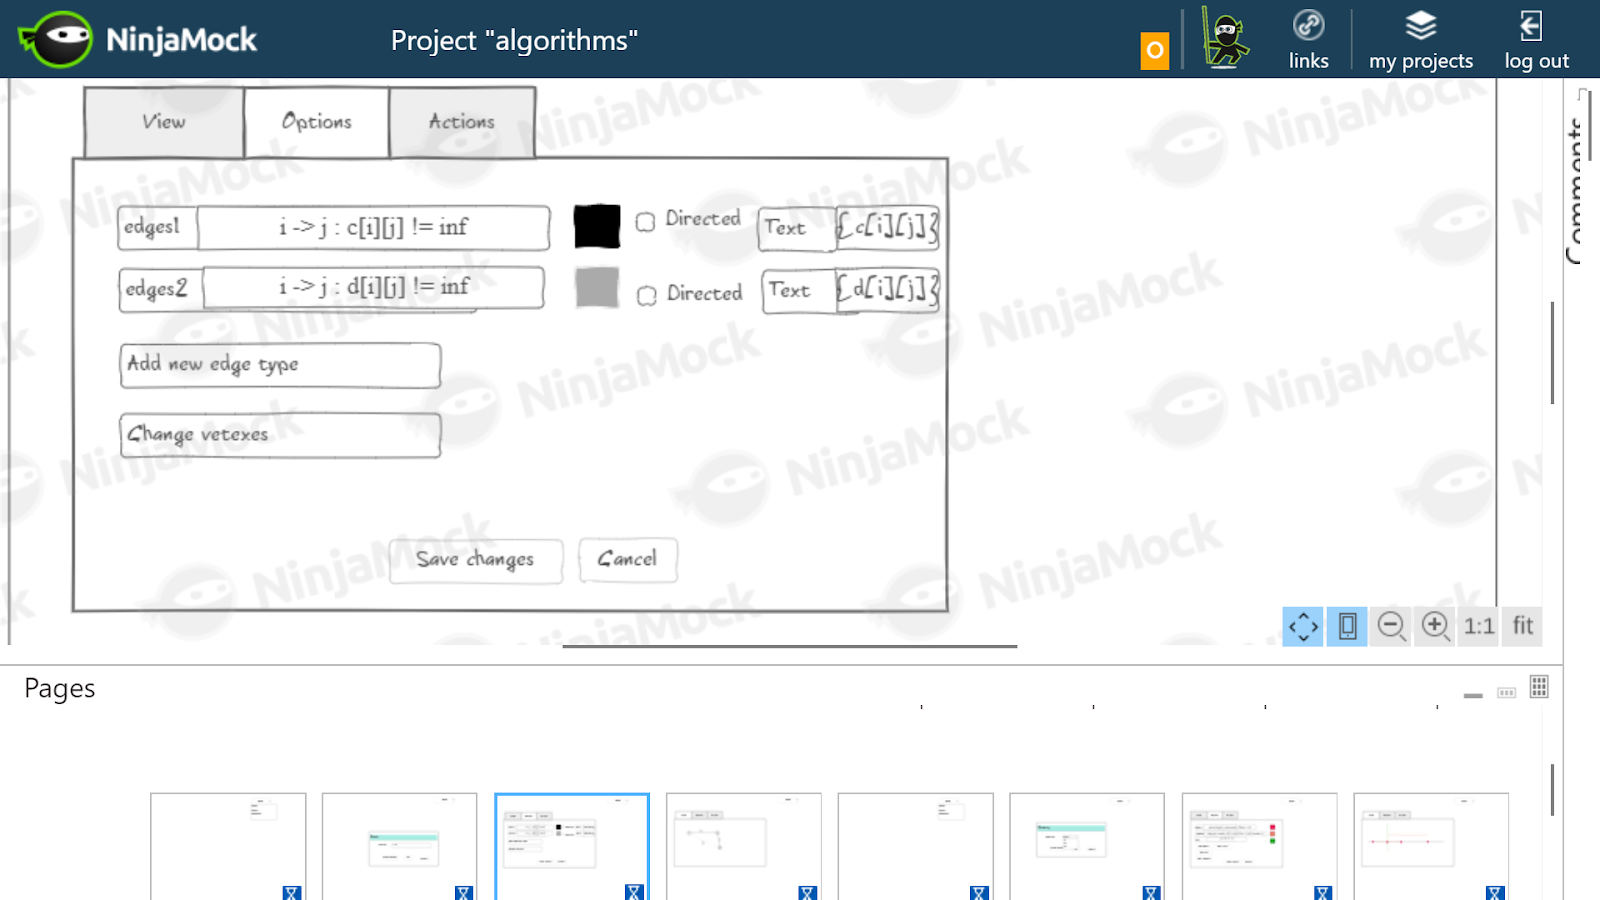
The user interface prototype I drew in NinjaMock . This was required to better understand how the interface will look from the point of view of the user, and what actions he will need to perform. If there were problems with the prototype, we would understand that there are some logical inconsistencies, and this idea should be discarded. For fidelity, I took a few algorithms. The picture below shows examples of how I imagined the DFS visualization settings and the Floyd algorithm .
As I imagined settings for DFS. The graph is stored as an adjacency list, so the edge between the vertices i and j is determined by the condition
I assumed that for Floyd's algorithm, it would be necessary to draw black the real edges stored in array
For the next step, it was necessary to understand exactly how to do all this. First of all, integration with a debugger was required. The first thing that comes to mind when the word "debugger" is gdb, but then you would have to create the entire graphical interface from scratch, which is really difficult for a student to do in a semester. The second obvious idea is to make a plugin for some existing development environment. As options I considered QTCreator, CLion and Visual Studio.
The CLion option was dropped almost immediately, because, firstly, it has closed source code, and secondly, everything is very bad with the documentation (and no one needs additional difficulties). QTCreator, unlike Visual Studio, is cross-platform and open source, and therefore, at first we decided to dwell on it.
It turned out, however, that QTCreator is poorly adapted for extension using plugins. The first step in creating a plugin for QTCreator is to build from source. It took me a week and a half. In the end, I sent two bug reports ( here and there ) regarding the assembly process. Yes, that’s how much effort was put into building QTCreator just to discover that the debugger in QTCreator does not have a public API. I returned to another option, namely Visual Studio.
And this turned out to be the right decision: Visual Studio has not only a great API, but also excellent documentation for it. Expression
Of course, it was not supposed that I would be engaged in visualization of graphs from scratch - there are a lot of special libraries for this. The most famous of them is Graphviz , and we planned to use it at first. But for a plug-in for Visual Studio, it would be more logical to use the library for C #, since I was going to write on it. I googled a little and found the MSAGL library: it had all the required functionality and had a simple and intuitive interface.
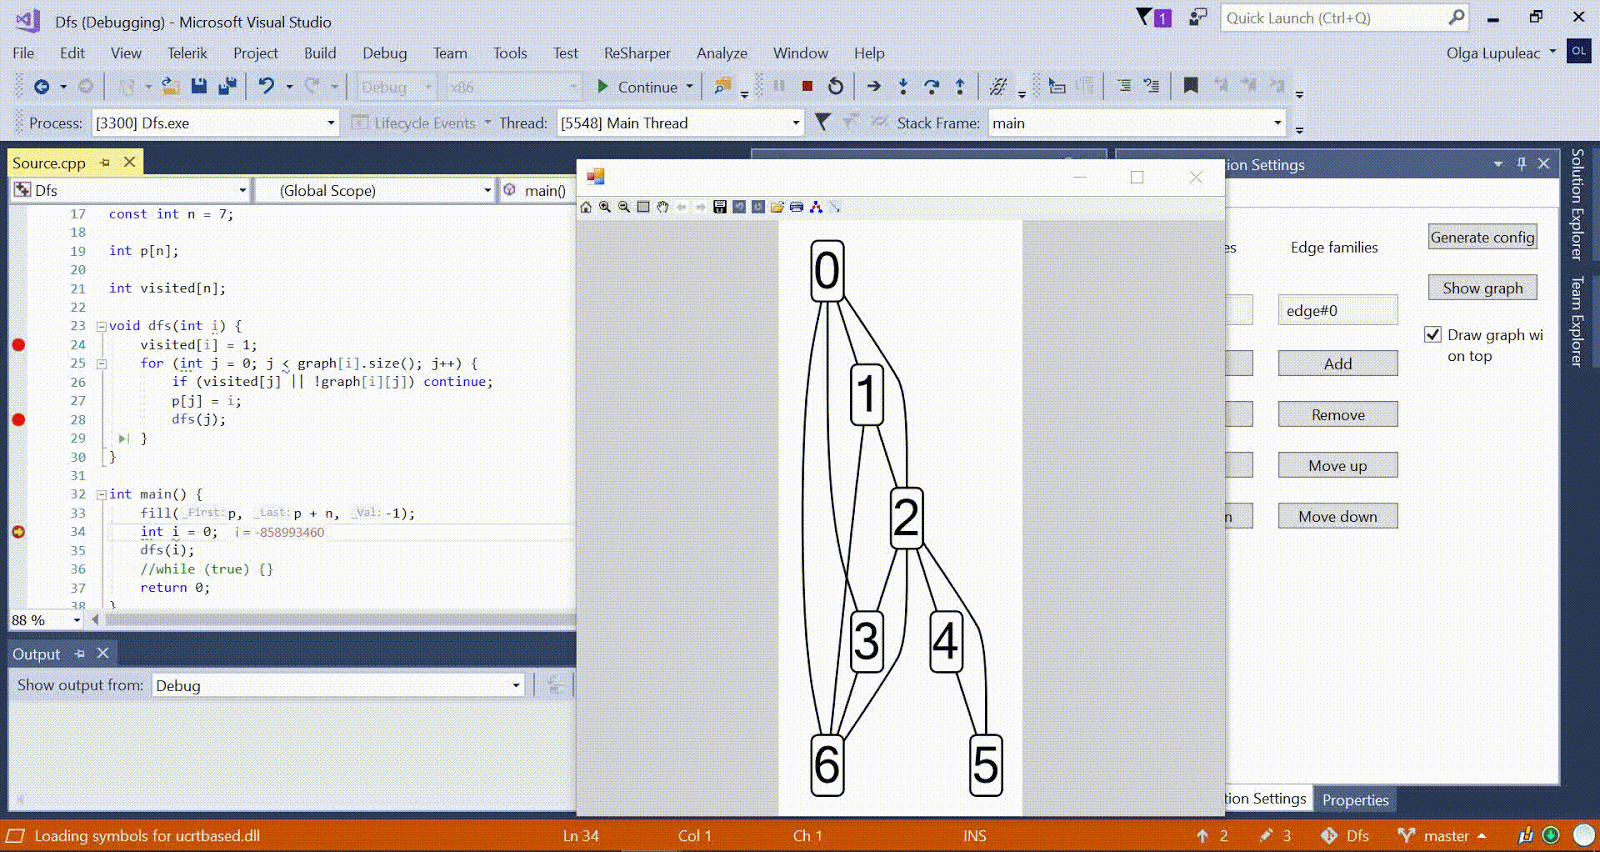
Now, having a mechanism for calculating arbitrary expressions on the one hand and a library for visualizing graphs on the other, it was necessary to make a prototype. The first prototype was made for DFS, then the Dinits algorithm , the Kuhn algorithm , the search for doubly connected components , the Cartesian tree, and the SNM were taken as examples. I took my old implementations of these algorithms from the first to second year, created a new plug-in, drew a graph corresponding to this task (all variable names were hardcoded). Here is an example of a graph that I got for the Kuhn algorithm:
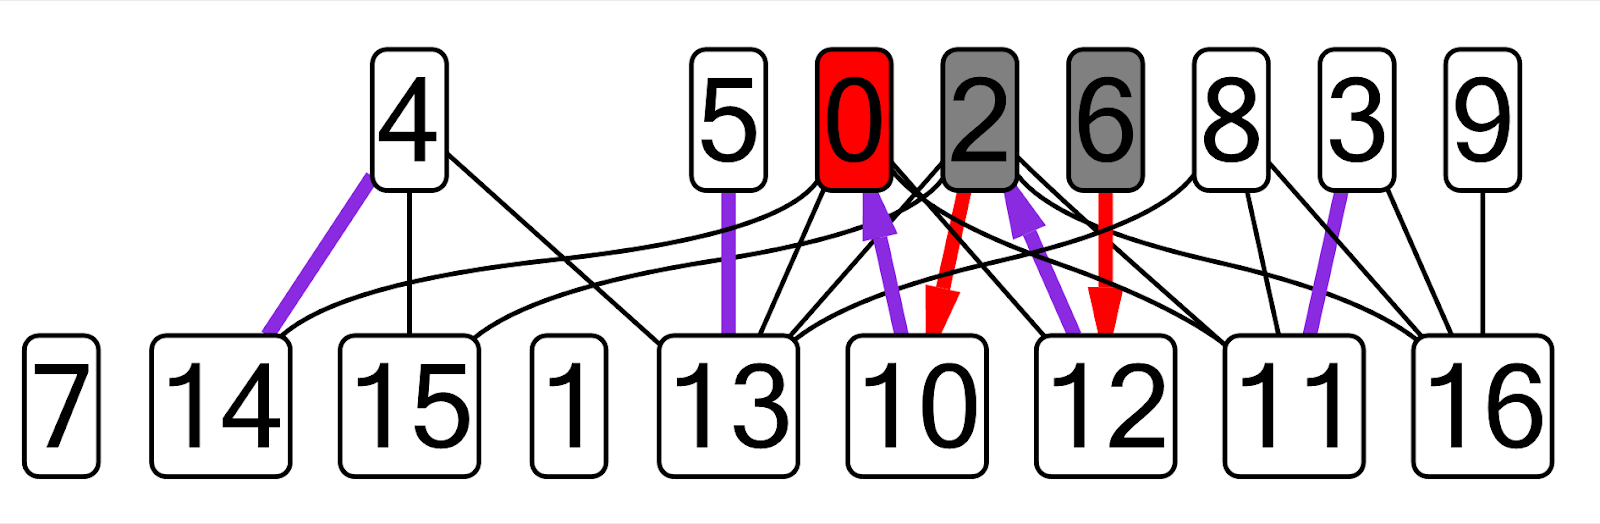
On this graph, the current matching edges are shown in purple, the current dfs vertex is shown in red, the visited vertices are gray, the edges of an alternating chain not from the matching are shown in red.
I considered it permissible to slightly modify the algorithm code to make it easier to visualize. For example, in the case of the Cartesian tree, it turned out that it is easier to add all the created nodes into a vector than to bypass the tree inside the plugin.
An unpleasant discovery was that the debugger in Visual Studio does not support calling methods and functions from the STL. This meant that it was not possible to check for the presence of an element in the container using
In my trial plugins, something like this happened (if the graph was stored as an adjacency list):
At that time, I wrote the code “as necessary”, without trying to come up with a general scheme for all the algorithms, or write the code at least somehow beautifully. The creation of each new plugin began with the copy-paste of the previous one.
After the research, it was necessary to draw up a general scheme that could be applied to all algorithms. The first thing that was introduced was the indexes for the vertices and edges. Each index has a unique name and range ends, calculated using
For each vertex or edge, index values are substituted, and after that it is calculated in the debugger. Templates were used to filter out some index values (if the graph is stored as the adjacency matrix
A graph can have different types of vertices and edges. For example, in the case of searching for the maximum matching in a bipartite graph, each share can be indexed separately. Therefore, the concept of a family was introduced for vertices and edges. For each family, indexing and all properties are determined independently. In this case, edges can connect vertices from different families.
You can assign specific properties to a vertex or edge family that will be selectively applied to elements in the family. The property is applied if the condition is met. The condition consists of a template that evaluates to
Properties are very diverse. For vertices: label, fill color, border color, border width, shape, border style (for example, dotted line). For edges: label, color, width, style, orientation (you can set two arrows - from beginning to end or vice versa; in this case, there can be two arrows at the same time).
It is important that each time the graph is drawn from scratch, and the previous state is not taken into account in any way. This can be a problem if the graph dynamically changes during the algorithm - the vertices and edges can dramatically change their position, and then it is difficult to understand what is happening.
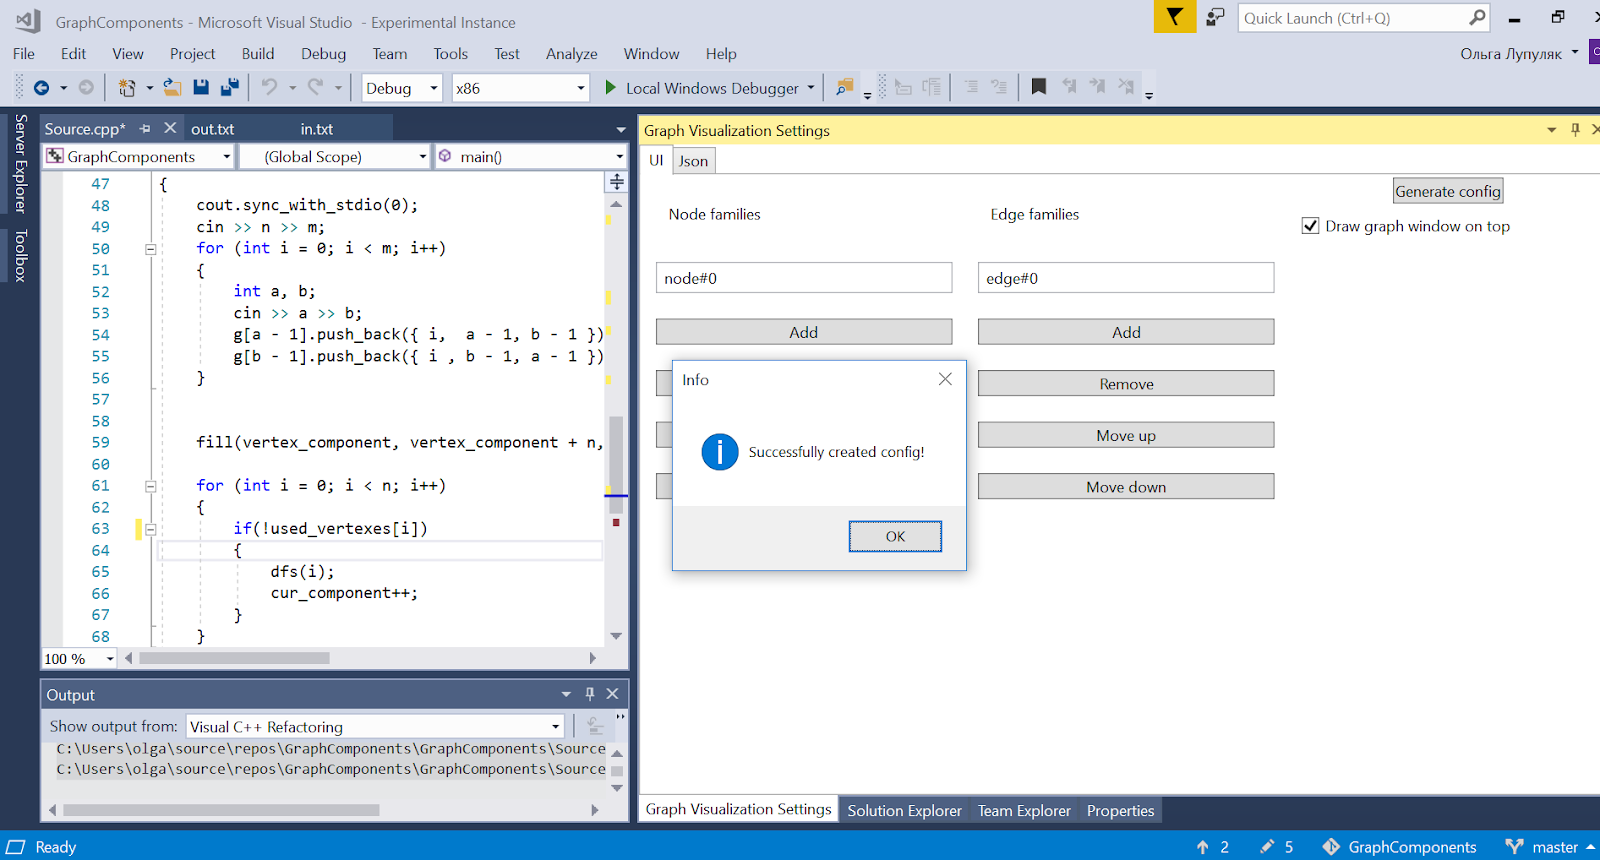
A detailed description of the graph configuration can be found here .
With the interface, I decided not to bother much. The main window with the settings ( ToolWindow ) contains textarea for the config serialized in JSON and a list of vertex and edge families. Each family has its own window with settings, and each property in the family has one more window (three levels of nesting are obtained). The graph itself is drawn in a separate window. It did not work to put it in ToolWindow, so I sent a bug report to the MSAGL developers, but they answered that this is not the target use case. Another bug report was sent to Visual Studio, as TextBoxes sometimes hung in additional configuration windows.
In order to configure the graph, the plugin has a user interface and the ability to (de) serialize the config in JSON. The general scheme of interaction of all components is as follows:
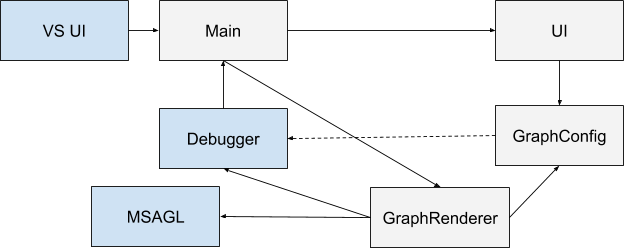
Blue shows the components that existed originally, gray - which I created. When Visual Studio starts, the extension is initialized (here the main component is designated as Main). The user gets the opportunity to specify the configuration through the interface. Each time the debugger context is changed, the main component is notified. If the configuration is defined and the program being debugged is executed, GraphRenderer is launched. He receives a config input and with the help of a debugger builds a graph on it, which is then displayed in a special window.
As a result, I created a tool that allows you to visualize graph algorithms and requires small changes in the code. It has been tested on eight different tasks. Here are some resulting pictures:
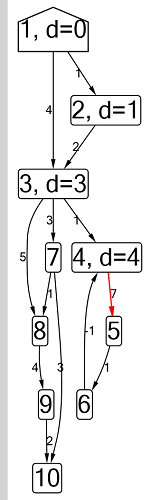
Ford-Bellman algorithm : the vertex to which we count the shortest paths is indicated by a house, the current shortest distance found for the vertices is d, red indicates the edge along which relaxation passes.
Animation with DFS - the current vertex is shown in red, the vertices in the stack are gray, and the other visited vertices are green. Raspberry ribs indicate the direction of the bypass.
More sample algorithms are available here.
To protect research work, students are required to talk about their work in a semester in seven minutes. In this case, regardless of whether the topic was proposed as part of the presentation of research work or the student found it on their own, you need to be able to answer to justify why the topic of the project falls under the requirements described at the beginning. Typically, a report is structured as follows: first there is motivation, then a review of analogues, it is said about why they do not suit us, then goals and objectives are formulated, and then each of the tasks is described how it was solved. At the end there is a slide with the results, which once again says that the goal has been achieved and all tasks are solved.
Since I decided on the motivation and review of analogues at the initial stage, I just needed to collect all the information together and compress it to seven minutes. As a result, I succeeded, the defense went smoothly, and I was given the maximum score for research.
About myself
My name is Olga, I graduated from the third year of the direction "Applied Mathematics and Computer Science" at the St. Petersburg HSE with a degree in Software Engineering. Before entering the university, I was not involved in programming.
')
Research: requirements
At our faculty practice semester research work. Usually this happens like this: at the beginning of the semester, a presentation of research works takes place - representatives of different companies offer all kinds of projects. Then students choose their favorite projects, supervisors choose their favorite students, and so on. In the end, each student finds a project for himself.
But there is another way: you can independently find a supervisor and a project, and then convince the curator that this project can really be a full-fledged R&D. To do this, prove that:
- You are going to do something new. Of course, the project may have analogues, but your option should have some advantages over them.
- The task should be quite difficult, that is, the work there should be for a semester, and not for a day. At the same time, it is necessary that the project really be done in a semester.
- Your project should be useful to the world. That is, when asked why this is necessary, you should not answer: "Well, I need to do some kind of research."
I chose the second way. The first thing to do after I agreed with the supervisor was to find the topic of the project. The list of ideas included: code style checker for Lua, a debugger that allows you to calculate expressions in parts, and a tool for olympiads / programming training, which allows you to visualize what is happening in the code. That is, a visualizer for arbitrary data structures combined with a debugger. For example, a person writes a Cartesian tree , and in the process peaks, edges, the current peak and so on are drawn. In the end, I decided to stay on this option.
Project work plan
My work on the project consisted of the following stages:
- The study of the subject area was required to understand whether this problem had already been solved (then the project topic would have to be changed), what are their analogues, what are their advantages and disadvantages, which I could take into account in my work.
- Defining the specific functionality that the created tool will have. The theme of the project was stated quite abstractly, and this was necessary in order to make sure that the task is quite complicated, but at the same time it is realistic to complete it in a semester.
- Creating a prototype user interface was required to demonstrate how the created tool can be used. It added even more specificity than a set of features described by words.
- Choice of dependencies - you need to understand how everything will be arranged from the point of view of the developer and decide on the tools that will be used in the process of writing code.
- Creating a prototype (proof-of-concept) , that is, a minimal example in which most would be hardcoded. With this example, I had to figure out all the tools that I was going to use, and also learn how to solve all the difficulties that arose along the way, so that the final version would already be written “clean”.
- Work on the content part , that is, the development and implementation of the logic of the tool.
- Project protection is required in order to quickly talk about the work done and to give an opportunity to evaluate it to everyone, even people who do not rummage in the subject. It is a training before graduation. At the same time, a well-made project does not guarantee that the report will turn out to be good, since it requires other skills, for example, the ability to speak to the public.
I have always carried out planning with my supervisor. We also always came up with and discussed all ideas that arose along the way. In addition, the supervisor advised me on the code and helped with time management. About all technical problems (incomprehensible bugs, etc.) I also always reported, but most often I managed to solve them myself.
Subject research
To begin with, our leadership should have been convinced that this topic deserves to be my research work. And you should start from the first point: the search for analogues.
As it turned out, there are many analogues. But most of them were designed for visualization of memory. That is, they would have done a great job with the visualization of the Cartesian tree, but they cannot understand that a bunch on an array should not be drawn as an array, but as a tree. Among these analogues were gdbgui , Data Display Debugger , a plug-in for Eclipse jGRASP, and a plug-in for Visual Studio Data Structures Visualizer . The latter was also created for the problems of olympiad programming, but was able to visualize only data structures on pointers.
There were several more tools: Algojammer for python (and we wanted pluses, as the most popular language among olympiadniki) and the Lens tool developed in 1994. The latter, judging by the description, did almost what it needed, but, unfortunately, it was created under Sun OS 4.1.3 (an operating system from 1992). So, despite the availability of source codes, it was decided not to waste time on this dubious archeology.
So, after some research it was found that Tula, which would do exactly what we wanted, and at the same time work on modern machines, is not in nature yet.
Functionality Definition
The second step was to prove that this task is quite complicated, but doable. To do this, it was necessary to propose something more specific than “I want a beautiful picture, and that everything becomes clear from it immediately”.
In this project, we decided to concentrate on visualizing only graphs: there are many algorithms on graphs that can be implemented in different ways, and even when narrowed, the task still remains non-trivial.
It is also more or less obvious that the tool must somehow be integrated with the debugger. We need to be able to view the values of variables and expressions, and draw a finished picture from these values.
After that, it was necessary to come up with a certain language that allows us to build a graph according to the current state of the program the way we want. In addition to the graph itself, it was necessary to provide for the ability to change the color of the vertices and edges, add arbitrary labels to them and change other properties. Accordingly, the first idea was:
- Determine what we have vertices, for example, numbers from 0 to n.
- Determine the presence of an edge between the vertices using the Boolean condition. In this case, the edges are of different types, and each type has its own set of properties.
- Further, we can define vertex properties such as color, also using the Boolean condition.
- Walk through the steps with the debugger: all expressions are calculated, all conditions are checked, and, depending on this, a graph is drawn.
User Interface Prototyping
The user interface prototype I drew in NinjaMock . This was required to better understand how the interface will look from the point of view of the user, and what actions he will need to perform. If there were problems with the prototype, we would understand that there are some logical inconsistencies, and this idea should be discarded. For fidelity, I took a few algorithms. The picture below shows examples of how I imagined the DFS visualization settings and the Floyd algorithm .
As I imagined settings for DFS. The graph is stored as an adjacency list, so the edge between the vertices i and j is determined by the condition
g[i].find() != g[i].end() (in fact, in order not to duplicate the edges, we need to check that i <= j ). The DFS path is shown separately: p[j] == i . These edges will be oriented. I assumed that for Floyd's algorithm, it would be necessary to draw black the real edges stored in array
c , and gray - the shortest paths found at this stage, stored in array d . For each edge and shortest path, its weight is written.Dependency Selection
For the next step, it was necessary to understand exactly how to do all this. First of all, integration with a debugger was required. The first thing that comes to mind when the word "debugger" is gdb, but then you would have to create the entire graphical interface from scratch, which is really difficult for a student to do in a semester. The second obvious idea is to make a plugin for some existing development environment. As options I considered QTCreator, CLion and Visual Studio.
The CLion option was dropped almost immediately, because, firstly, it has closed source code, and secondly, everything is very bad with the documentation (and no one needs additional difficulties). QTCreator, unlike Visual Studio, is cross-platform and open source, and therefore, at first we decided to dwell on it.
It turned out, however, that QTCreator is poorly adapted for extension using plugins. The first step in creating a plugin for QTCreator is to build from source. It took me a week and a half. In the end, I sent two bug reports ( here and there ) regarding the assembly process. Yes, that’s how much effort was put into building QTCreator just to discover that the debugger in QTCreator does not have a public API. I returned to another option, namely Visual Studio.
And this turned out to be the right decision: Visual Studio has not only a great API, but also excellent documentation for it. Expression
_debugger.GetExpression(...).Value simplified by calling _debugger.GetExpression(...).Value . Visual Studio also provides the ability to iterate over the frames, and evaluate the expression in the context of any of them. To do this, change the property CurrentStackFrame to the required one. You can also track updates to the debugger contest to redraw the image when changing.Of course, it was not supposed that I would be engaged in visualization of graphs from scratch - there are a lot of special libraries for this. The most famous of them is Graphviz , and we planned to use it at first. But for a plug-in for Visual Studio, it would be more logical to use the library for C #, since I was going to write on it. I googled a little and found the MSAGL library: it had all the required functionality and had a simple and intuitive interface.
Proof-of-concept
Now, having a mechanism for calculating arbitrary expressions on the one hand and a library for visualizing graphs on the other, it was necessary to make a prototype. The first prototype was made for DFS, then the Dinits algorithm , the Kuhn algorithm , the search for doubly connected components , the Cartesian tree, and the SNM were taken as examples. I took my old implementations of these algorithms from the first to second year, created a new plug-in, drew a graph corresponding to this task (all variable names were hardcoded). Here is an example of a graph that I got for the Kuhn algorithm:
On this graph, the current matching edges are shown in purple, the current dfs vertex is shown in red, the visited vertices are gray, the edges of an alternating chain not from the matching are shown in red.
I considered it permissible to slightly modify the algorithm code to make it easier to visualize. For example, in the case of the Cartesian tree, it turned out that it is easier to add all the created nodes into a vector than to bypass the tree inside the plugin.
An unpleasant discovery was that the debugger in Visual Studio does not support calling methods and functions from the STL. This meant that it was not possible to check for the presence of an element in the container using
std::find , as originally assumed. This problem can be solved either by creating a user-defined function, or by duplicating the property "the element is contained in the container" in a Boolean array.In my trial plugins, something like this happened (if the graph was stored as an adjacency list):
- First comes the
forloop from0to_debugger.GetExpression("n").Value, which added all the vertices to the graph, each with its own number. - Then there are two nested
for_debugger.GetExpression($"g[{i}].size()").Value, the first fori- from0ton, the second forj- from0to_debugger.GetExpression($"g[{i}].size()").Value, and the edge{i, _debugger.GetExpression($"g[{i}][{j}]").Value}. - If required, some additional information was added to the labels of the vertices and edges. For example, the value of the array
d, which is responsible for the distance to the selected vertex. - If the algorithm was based on dfs, then after that a cycle went through all the glass frames, and all the vertices on the stack (
stackFrame.FunctionName.Equals("dfs") && stackFrame.Arguments.Item(1) == v) were highlighted in gray. - Then, for each
ifrom0ton, denoting the numbers of the vertices, some conditions were checked, and if they were satisfied, then some properties changed at the vertex, most often the color.
At that time, I wrote the code “as necessary”, without trying to come up with a general scheme for all the algorithms, or write the code at least somehow beautifully. The creation of each new plugin began with the copy-paste of the previous one.
Graph configuration
After the research, it was necessary to draw up a general scheme that could be applied to all algorithms. The first thing that was introduced was the indexes for the vertices and edges. Each index has a unique name and range ends, calculated using
_debugger.GetExpression . To access an index value, use its name surrounded by __ (i.e. __x__). Expressions with places to substitute index values, as well as the name of the current function (__CURRENT_FUNCTION__) and the values of its arguments (__ARG1__, __ARG2__, ...), are called templates.For each vertex or edge, index values are substituted, and after that it is calculated in the debugger. Templates were used to filter out some index values (if the graph is stored as the adjacency matrix
c , then the indices will be a and b from 0 to n, and the template for validation is c[__a__][__b__] ). The boundaries of the index range are also templates, as they may contain previous indexes.A graph can have different types of vertices and edges. For example, in the case of searching for the maximum matching in a bipartite graph, each share can be indexed separately. Therefore, the concept of a family was introduced for vertices and edges. For each family, indexing and all properties are determined independently. In this case, edges can connect vertices from different families.
You can assign specific properties to a vertex or edge family that will be selectively applied to elements in the family. The property is applied if the condition is met. The condition consists of a template that evaluates to
true or false , and a regular expression for the function name. The condition is checked either only for the current glass frame, or for all glass frames (and then it is considered fulfilled if it is satisfied for at least one).Properties are very diverse. For vertices: label, fill color, border color, border width, shape, border style (for example, dotted line). For edges: label, color, width, style, orientation (you can set two arrows - from beginning to end or vice versa; in this case, there can be two arrows at the same time).
It is important that each time the graph is drawn from scratch, and the previous state is not taken into account in any way. This can be a problem if the graph dynamically changes during the algorithm - the vertices and edges can dramatically change their position, and then it is difficult to understand what is happening.
A detailed description of the graph configuration can be found here .
User interface
With the interface, I decided not to bother much. The main window with the settings ( ToolWindow ) contains textarea for the config serialized in JSON and a list of vertex and edge families. Each family has its own window with settings, and each property in the family has one more window (three levels of nesting are obtained). The graph itself is drawn in a separate window. It did not work to put it in ToolWindow, so I sent a bug report to the MSAGL developers, but they answered that this is not the target use case. Another bug report was sent to Visual Studio, as TextBoxes sometimes hung in additional configuration windows.
Plugin
In order to configure the graph, the plugin has a user interface and the ability to (de) serialize the config in JSON. The general scheme of interaction of all components is as follows:
Blue shows the components that existed originally, gray - which I created. When Visual Studio starts, the extension is initialized (here the main component is designated as Main). The user gets the opportunity to specify the configuration through the interface. Each time the debugger context is changed, the main component is notified. If the configuration is defined and the program being debugged is executed, GraphRenderer is launched. He receives a config input and with the help of a debugger builds a graph on it, which is then displayed in a special window.
Examples
As a result, I created a tool that allows you to visualize graph algorithms and requires small changes in the code. It has been tested on eight different tasks. Here are some resulting pictures:
Ford-Bellman algorithm : the vertex to which we count the shortest paths is indicated by a house, the current shortest distance found for the vertices is d, red indicates the edge along which relaxation passes.
Animation with DFS - the current vertex is shown in red, the vertices in the stack are gray, and the other visited vertices are green. Raspberry ribs indicate the direction of the bypass.
More sample algorithms are available here.
NIR protection
To protect research work, students are required to talk about their work in a semester in seven minutes. In this case, regardless of whether the topic was proposed as part of the presentation of research work or the student found it on their own, you need to be able to answer to justify why the topic of the project falls under the requirements described at the beginning. Typically, a report is structured as follows: first there is motivation, then a review of analogues, it is said about why they do not suit us, then goals and objectives are formulated, and then each of the tasks is described how it was solved. At the end there is a slide with the results, which once again says that the goal has been achieved and all tasks are solved.
Since I decided on the motivation and review of analogues at the initial stage, I just needed to collect all the information together and compress it to seven minutes. As a result, I succeeded, the defense went smoothly, and I was given the maximum score for research.
References
Source: https://habr.com/ru/post/461473/
All Articles