CLion 2019.2 released: embedded development support, debugger for MSVC, search for unused header files
Hello, Habr!
The summer outside the window flies for us almost imperceptibly, because we have devoted all these months to working on the new release 2019.2 of our cross-platform development environment for C ++ - CLion. We managed to do quite a lot of things: conduct an internal Hackathon, try new ideas, and bring a number of corrections and new features to an immediate release. But first things first.

')
In short, in this release we:
This, of course, is not all . We’ll talk in more detail below, but if you are ready to try it now, then go in and download the build from our site . As usual, a free trial for 30 days is available.
In the last release, for some reason, many thought that we focused only on STM32-boards. This, of course, is one of the most interesting and extensive markets in many studies (including our domestic), but we are now trying to solve more general problems. For example, we expanded the debugging capabilities on various boards from CLion.
Previously, the only option was the configuration for the OpenOCD debugger - OpenOCD Download & Run. Now another one has appeared - Embedded GDB Server. In fact, if a board supports debugging through some compatible GDB server, you can debug it on it through CLion. The configuration covers such cases as OpenOCD, ST-Link GDB Servers, Segger J-Link GDB Server, QEMU and more.
It is enough to create and configure the appropriate configuration - specify the path to the GDB server, the arguments that you pass to it, perhaps some more advanced settings. Now run debugging in this configuration, and you can debug on the board directly from CLion!
There is one important limitation that now affects both configurations for debugging embedded systems - both of them currently only work with projects on CMake. In the future, we plan to add the ability to run them for custom design models ( CPP-16079 ).
For both existing debugging configurations of embedded systems (Embedded GDB Server and OpenOCD Download & Run), the new release now has the ability to view peripherals during debugging. In general, peripherals are specified for devices of the ARM family in .svd format files . These specifications can now be loaded into CLion and view the selected peripherals directly in the debugger window:

All peripherals are still available in read-only mode, while there is a search by name, the ability to view values in different modes (hexadecimal, decimal, octal and binary). You can read a little more about this in our blog (in English).
You read everything correctly - in release 2019.2 CLion introduced an experimental debugger for code compiled using MSVC! Now let's understand a little more detail and in order.
For a long time in CLion, when developing on the Windows platform, you can use not only the MinGW and Cygwin toolchain, but also Visual Studio. You specify the path to the installed VS in CLion, and from there we take the MSVC compiler and scripts to configure the environment. But there were problems with the debugger for a long time. The fact is that the debugger that Visual Studio itself uses is proprietary. Simply put, nowhere except Microsoft tools can it be used under license. There is an alternative technology - dbgeng.dll , on which CDB and WinGDB debuggers are implemented. The first thing we tried was her. But it seemed to us that to deal with the number of critical crashes and poor performance on binaries with a large number of PDB files is not very promising (although we initially tried). And then it turned out that there is a third option - to implement a debugger on top of LLDB. There were already achievements, and we had only to continue this work. What we did! By the way, we have put all of our changes (except for the support of native data visualizers for now) in the LLVM wizard.
How to turn on? As I already wrote, the opportunity is still experimental. It is too early to call a debugger full-fledged, it has many limitations and deficiencies, and performance requires significant optimizations. This experimental feature is enabled in the Maintenance dialog (
The debugger has initial support for native visualizers, both supplied with the studio, and custom custom found in the project. For now, the feature requires explicit inclusion in the settings: Settings | Build, Execution, Deployment | Debugger Data Views | Enable NatVis renderers for LLDB. In one of the first updates, we plan to fix several critical problems with visualizers and then probably turn them on by default.

If you plan to try a new experimental debugger, we recommend that you familiarize yourself with the list of known limitations and problems in our blog .
In addition to the new experimental debugger, we made a number of other improvements:
There are several big improvements in this area. First, we completely rewrote the Unused Includes code check and turned it on by default. Previously, it was also there, but it gave a large number of false positives, so we turned it off by default. Why is it getting better? We completely rewrote the verification based on the second additional tool for parsing code, which, in turn, is based on Clangd. So this is a clear limitation - the new version will work only if Clangd is not disabled for you (by default it is enabled). But now in the check for Unused Includes there are several strategies between which you can choose:
By default, Detect not directly used is used , which is essentially the closest to the well-known principle of Include What You Use , that is, if declarations from the header file are not used directly in this file, then such a header file is marked as unused.
In the inspection settings (Settings / Preferences | Editor | Inspections | C / C ++ | Unused code | Unused include directive), you can also choose whether to run the check in the header files themselves. True, it will only work in those header files where #pragma or header guards are present. It is also important to know that if compilation errors are present in the source file, then the check will not show unused files.
Since the last release, CLion has supported ClangFormat as an alternative code formatting tool, in addition to the built-in one. In this version, we added a built-in JSON scheme for .clang-format configuration files. And thanks to this, we were able to add several features that may be useful to those who will modify the .clang-format files in CLion:

What if the function is written (perhaps not by you) so that 3 integers are passed to it as arguments? How to understand by a function call what the transmitted values mean? Of course, you can see the function signature in the documentation window, go to the function definition or call up the parameter information (Parameter Info). And if you do not do these explicit actions?
In version CLion 2019.2, tooltips for arguments appeared - when calling a function, lambda, constructor, initialization list, or when using a macro, CLion displays the parameter names before the arguments passed: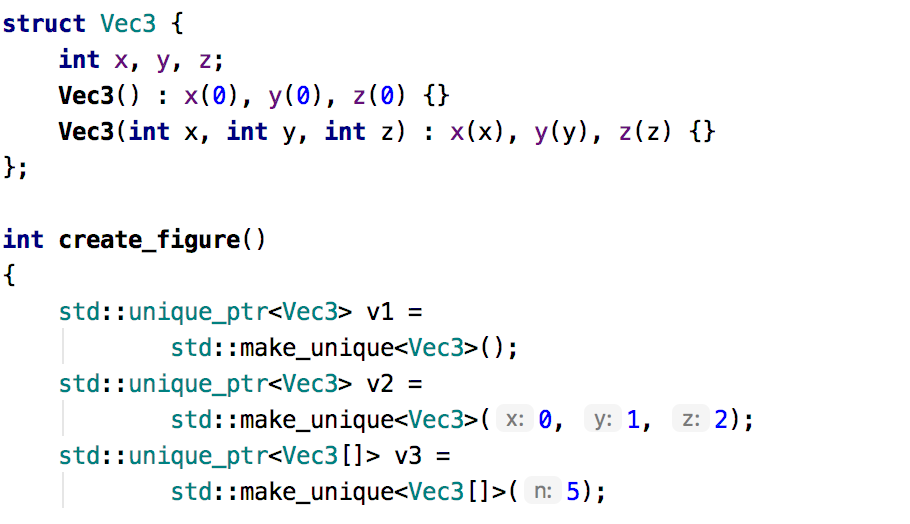
Hints are shown in cases where it is really difficult to understand what values are passed to which parameters, namely, if literals or expressions with more than one operand are used as arguments. More details at the blog post .
Of course, we are often asked about performance improvements. I repeat, for us this is the most priority task, but it turns out that there are not many point changes, and global ones take more time than 1-2 release cycles. Now there are several such big changes in work. Basically, they are related to how the parser in CLion interacts with the platform architecture (which does not always calculate that a long resolving code is hidden behind a simple action, in the case of C ++).
This summer, the team and I decided to hold an internal Hackathon to identify the most vulnerable spots in the CLion architecture and platform, try new bold ideas and test some old hypotheses. We liked the results. If possible, we plan to bring some new ideas to the release by 2019.3.
But the 2019.2 release was not left without performance improvements:
From IntelliJ platform in CLion 2019.2, many improvements have been made to work with other languages.
The syntax highlighting of more than 20 languages is now provided by TextMate grammars (a full list of languages can be found in Settings / Preferences | Editor | TextMate Bundles). Of course, if for this language there is extended support in CLion (Python, JavaScript, HTML, Objective-C, SQL), then it will be used, but for languages such as Ruby, the simplest highlighting can be useful:

Often in C ++ projects there are a variety of scripts . The Script Scripting plugin is now integrated into CLion. It provides not only code highlighting, but also auto-completion and text renaming:

The Rust plugin has received many useful updates. From a new experimental macro expansion tool (Settings / Preferences | Languages & Frameworks | Rust | Expand declarative macros) to Duplicate code fragments , various new quick fixes and auto-completion in the debugger in Evaluate Expressions . By the way, it is in CLion that the greatest use of this plugin is now among all IDEs from JetBrains!
Traditional video about the new features of CLion 2019.2 (in English):
That's all for once. Thank you for reading to the end! Questions, wishes, bug reports and just thoughts express in the comments! We, as always, will be happy to answer.
Your JetBrains CLion Team
The drive to develop
The summer outside the window flies for us almost imperceptibly, because we have devoted all these months to working on the new release 2019.2 of our cross-platform development environment for C ++ - CLion. We managed to do quite a lot of things: conduct an internal Hackathon, try new ideas, and bring a number of corrections and new features to an immediate release. But first things first.
')
In short, in this release we:
- We continued to refine support for the development of embedded systems: new debugging capabilities and viewing peripherals appeared.
- The experimental debugger for MSVC has been brought to acceptable quality.
- We completely rewrote code verification on Unused Includes on clangd, adding the ability to configure different strategies.
- Implemented hints for function call arguments and lambdas to improve code readability.
- We conducted an intra-team Hackathon to improve performance, came up with a bunch of new approaches and managed to implement several improvements.
- We implemented syntax highlighting for more than 20 languages, built in a Shell script plugin, and updated the Rust plugin.
This, of course, is not all . We’ll talk in more detail below, but if you are ready to try it now, then go in and download the build from our site . As usual, a free trial for 30 days is available.
New features for embedded development
In the last release, for some reason, many thought that we focused only on STM32-boards. This, of course, is one of the most interesting and extensive markets in many studies (including our domestic), but we are now trying to solve more general problems. For example, we expanded the debugging capabilities on various boards from CLion.
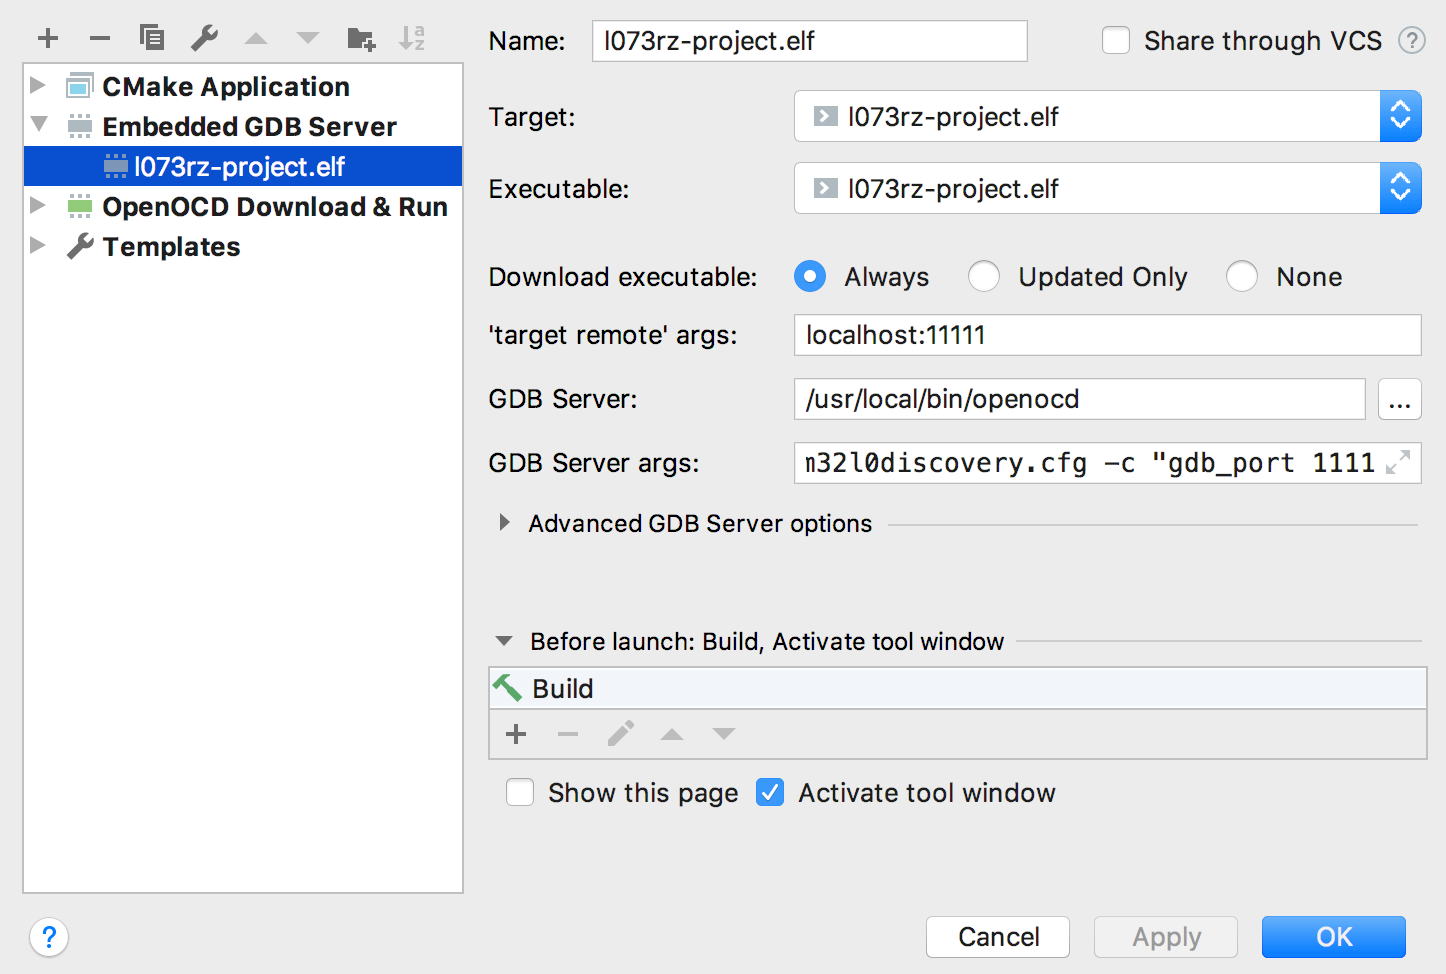
Previously, the only option was the configuration for the OpenOCD debugger - OpenOCD Download & Run. Now another one has appeared - Embedded GDB Server. In fact, if a board supports debugging through some compatible GDB server, you can debug it on it through CLion. The configuration covers such cases as OpenOCD, ST-Link GDB Servers, Segger J-Link GDB Server, QEMU and more.
It is enough to create and configure the appropriate configuration - specify the path to the GDB server, the arguments that you pass to it, perhaps some more advanced settings. Now run debugging in this configuration, and you can debug on the board directly from CLion!
There is one important limitation that now affects both configurations for debugging embedded systems - both of them currently only work with projects on CMake. In the future, we plan to add the ability to run them for custom design models ( CPP-16079 ).
For both existing debugging configurations of embedded systems (Embedded GDB Server and OpenOCD Download & Run), the new release now has the ability to view peripherals during debugging. In general, peripherals are specified for devices of the ARM family in .svd format files . These specifications can now be loaded into CLion and view the selected peripherals directly in the debugger window:
All peripherals are still available in read-only mode, while there is a search by name, the ability to view values in different modes (hexadecimal, decimal, octal and binary). You can read a little more about this in our blog (in English).
Experimental debugger for MSVC
You read everything correctly - in release 2019.2 CLion introduced an experimental debugger for code compiled using MSVC! Now let's understand a little more detail and in order.
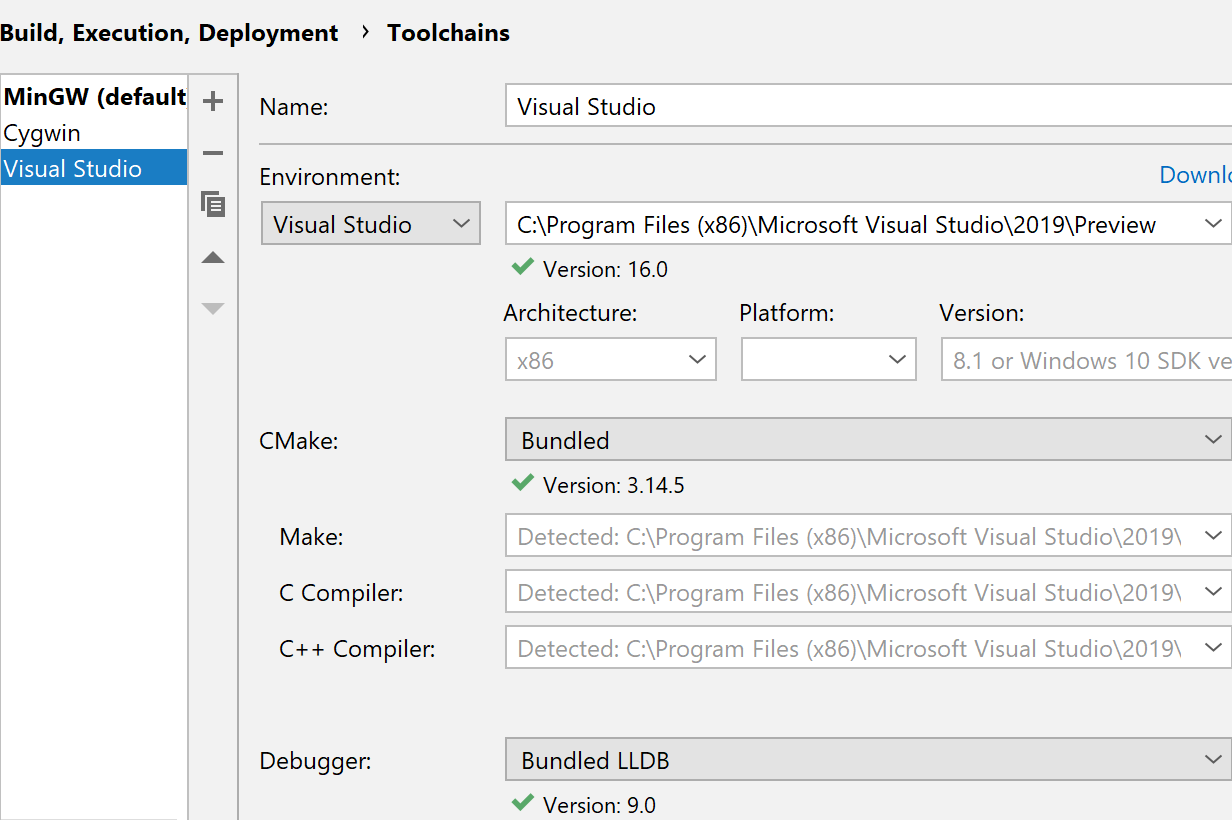
For a long time in CLion, when developing on the Windows platform, you can use not only the MinGW and Cygwin toolchain, but also Visual Studio. You specify the path to the installed VS in CLion, and from there we take the MSVC compiler and scripts to configure the environment. But there were problems with the debugger for a long time. The fact is that the debugger that Visual Studio itself uses is proprietary. Simply put, nowhere except Microsoft tools can it be used under license. There is an alternative technology - dbgeng.dll , on which CDB and WinGDB debuggers are implemented. The first thing we tried was her. But it seemed to us that to deal with the number of critical crashes and poor performance on binaries with a large number of PDB files is not very promising (although we initially tried). And then it turned out that there is a third option - to implement a debugger on top of LLDB. There were already achievements, and we had only to continue this work. What we did! By the way, we have put all of our changes (except for the support of native data visualizers for now) in the LLVM wizard.
How to turn on? As I already wrote, the opportunity is still experimental. It is too early to call a debugger full-fledged, it has many limitations and deficiencies, and performance requires significant optimizations. This experimental feature is enabled in the Maintenance dialog (
Shift+Ctrl+Alt+/ on Linux / Windows, ⌥⇧⌘/ on macOS) | Experimental features | cidr.debugger.lldb.windows . Now a new debugger is available for the Visual Studio toolchain:The debugger has initial support for native visualizers, both supplied with the studio, and custom custom found in the project. For now, the feature requires explicit inclusion in the settings: Settings | Build, Execution, Deployment | Debugger Data Views | Enable NatVis renderers for LLDB. In one of the first updates, we plan to fix several critical problems with visualizers and then probably turn them on by default.
If you plan to try a new experimental debugger, we recommend that you familiarize yourself with the list of known limitations and problems in our blog .
Other debugger improvements
In addition to the new experimental debugger, we made a number of other improvements:
- In the built-in GDB / LLDB console, in the debugger window in CLion, autocompletion of the debugger's commands now works (use
TaborCtrl+Space). - String breakpoints are now validated on the fly , and their status is updated and displayed to the user in the form of a corresponding icon. The most interesting type is Invalid , which was added to identify breakpoints that are not available in the current executable code or for which there are no debugging symbols (in this case, after loading them, the status of the breakpoint will be automatically updated):
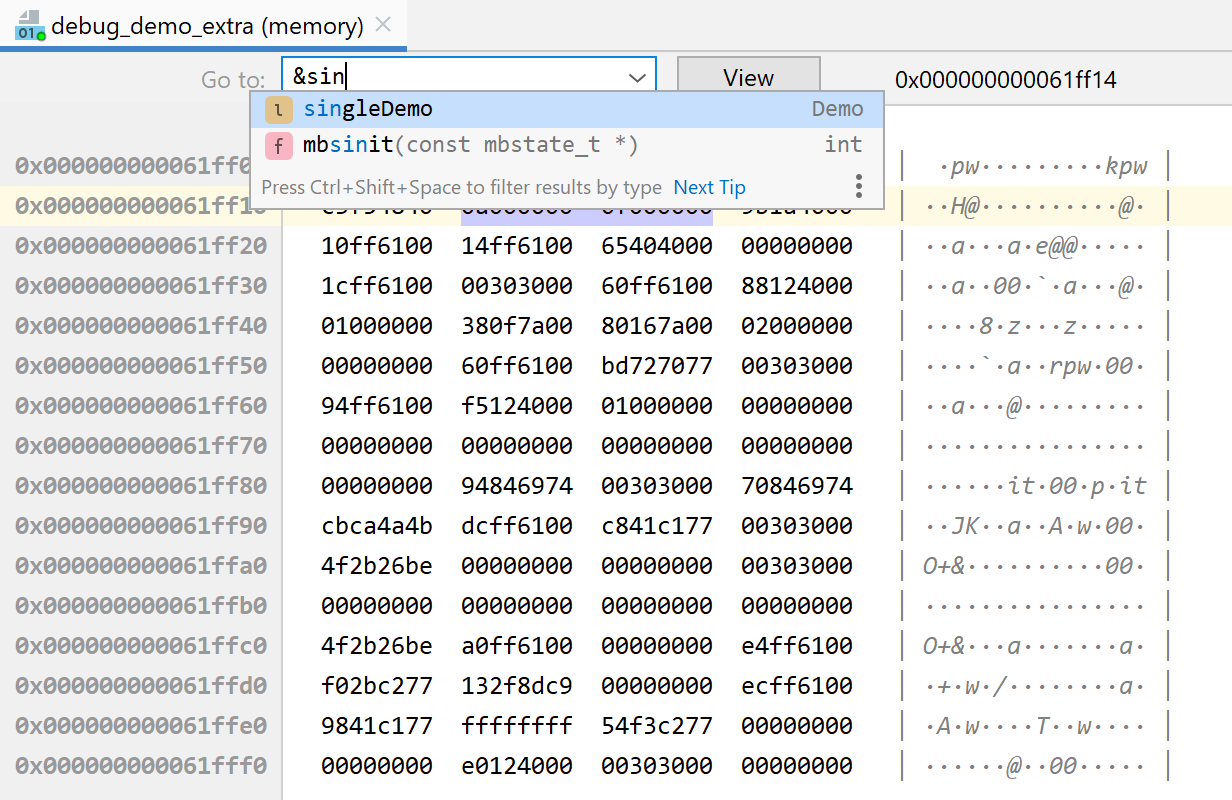
- When viewing memory in the debugger (Memory View) in the new version, it became possible to switch to an arbitrary address (by numerical address or variable name / address), as well as presenting the memory in ASCII format:
Code Editor Improvements
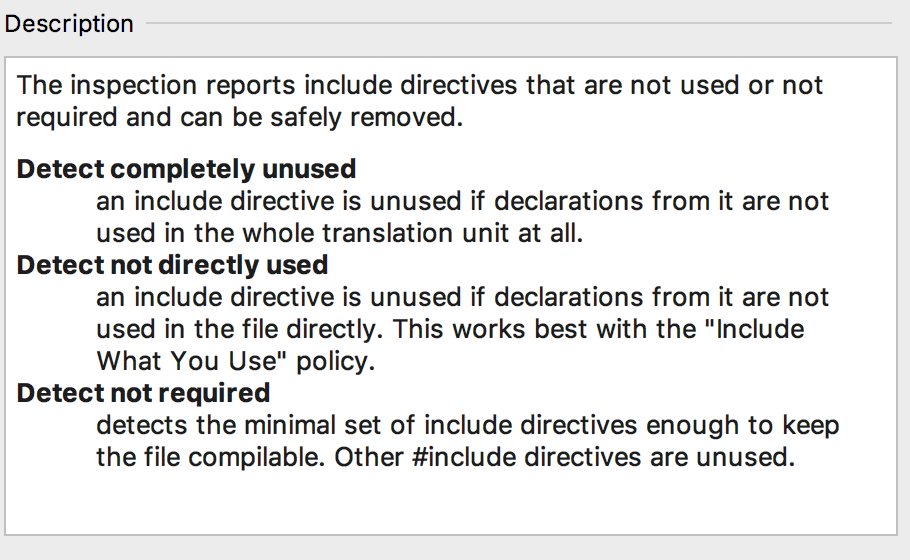
There are several big improvements in this area. First, we completely rewrote the Unused Includes code check and turned it on by default. Previously, it was also there, but it gave a large number of false positives, so we turned it off by default. Why is it getting better? We completely rewrote the verification based on the second additional tool for parsing code, which, in turn, is based on Clangd. So this is a clear limitation - the new version will work only if Clangd is not disabled for you (by default it is enabled). But now in the check for Unused Includes there are several strategies between which you can choose:
By default, Detect not directly used is used , which is essentially the closest to the well-known principle of Include What You Use , that is, if declarations from the header file are not used directly in this file, then such a header file is marked as unused.
In the inspection settings (Settings / Preferences | Editor | Inspections | C / C ++ | Unused code | Unused include directive), you can also choose whether to run the check in the header files themselves. True, it will only work in those header files where #pragma or header guards are present. It is also important to know that if compilation errors are present in the source file, then the check will not show unused files.
Since the last release, CLion has supported ClangFormat as an alternative code formatting tool, in addition to the built-in one. In this version, we added a built-in JSON scheme for .clang-format configuration files. And thanks to this, we were able to add several features that may be useful to those who will modify the .clang-format files in CLion:
- Auto-completion has appeared for options and their values.
- In the auto-completion window for options there is now a description of the options.
- The Quick Documentation documentation window (
Ctrl+Qon Windows / Linux,F1on macOS) shows the documentation for options and their meanings, with examples. - Validation of options for valid values is added.
Tips for Arguments
What if the function is written (perhaps not by you) so that 3 integers are passed to it as arguments? How to understand by a function call what the transmitted values mean? Of course, you can see the function signature in the documentation window, go to the function definition or call up the parameter information (Parameter Info). And if you do not do these explicit actions?
In version CLion 2019.2, tooltips for arguments appeared - when calling a function, lambda, constructor, initialization list, or when using a macro, CLion displays the parameter names before the arguments passed:
Hints are shown in cases where it is really difficult to understand what values are passed to which parameters, namely, if literals or expressions with more than one operand are used as arguments. More details at the blog post .
Performance
Of course, we are often asked about performance improvements. I repeat, for us this is the most priority task, but it turns out that there are not many point changes, and global ones take more time than 1-2 release cycles. Now there are several such big changes in work. Basically, they are related to how the parser in CLion interacts with the platform architecture (which does not always calculate that a long resolving code is hidden behind a simple action, in the case of C ++).
This summer, the team and I decided to hold an internal Hackathon to identify the most vulnerable spots in the CLion architecture and platform, try new bold ideas and test some old hypotheses. We liked the results. If possible, we plan to bring some new ideas to the release by 2019.3.
But the 2019.2 release was not left without performance improvements:
- We got rid of many slowdowns and freezes in refactoring In-place Rename.
- Improved auto-completion performance for qualified expressions.
- In the case of remote work, we reduced the number of I / O operations, which significantly accelerated the collection of information about the compiler, and, therefore, the download speed of the CMake project.
- And other improvements.
Not just C ++
From IntelliJ platform in CLion 2019.2, many improvements have been made to work with other languages.
The syntax highlighting of more than 20 languages is now provided by TextMate grammars (a full list of languages can be found in Settings / Preferences | Editor | TextMate Bundles). Of course, if for this language there is extended support in CLion (Python, JavaScript, HTML, Objective-C, SQL), then it will be used, but for languages such as Ruby, the simplest highlighting can be useful:
Often in C ++ projects there are a variety of scripts . The Script Scripting plugin is now integrated into CLion. It provides not only code highlighting, but also auto-completion and text renaming:
The Rust plugin has received many useful updates. From a new experimental macro expansion tool (Settings / Preferences | Languages & Frameworks | Rust | Expand declarative macros) to Duplicate code fragments , various new quick fixes and auto-completion in the debugger in Evaluate Expressions . By the way, it is in CLion that the greatest use of this plugin is now among all IDEs from JetBrains!
Demo
Traditional video about the new features of CLion 2019.2 (in English):
That's all for once. Thank you for reading to the end! Questions, wishes, bug reports and just thoughts express in the comments! We, as always, will be happy to answer.
Your JetBrains CLion Team
The drive to develop
Source: https://habr.com/ru/post/461289/
All Articles