Interesting reports on HighLoad ++ Siberia 2019 according to Plesk
Hello! A conference on the development of highly loaded applications HighLoad ++ Siberia 2019 was held in Novosibirsk in June. Earlier in the articles on Habré, we mentioned that we at Plesk conduct a retrospective of conferences and reports that we attend so as not to lose the knowledge gained and subsequently apply them. We will tell you which reports we noted for ourselves, and also share with you a retrospective recipe. The organizers are gradually posting the video here: youtube channel . Part of what we are describing can already be seen.
This is a review report on the successful migration of Redis -> PostgreSQL -> Pgbouncer + PostgreSQL -> Patroni Consul + Pgbouncer + PostgreSQL. The author gives schemes, typical pitfalls of obvious solutions, talks about alternative solutions and why they did not fit. From the interesting:
It is useful to see those who use or are going to use PostgreSQL, and who have an increasing amount of data.
')
As an introductory speaker, he made a brief comparison of some features of Kafka and RabbitMQ. Briefly: Kafka - a simple queue, a complex recipient; RabbitMQ is a complex queue, a simple receiver. The author also spoke about the types of guarantees for delivering messages from the queue. Important note: no queue can deliver a message exactly 1 time without support on the sender and recipient.
The report is dedicated to YandexMQ. YandexMQ (YMQ) is an API compatible with Amazon SQS queue. The foundation of YandexMQ is Yandex Database (YDB). Vasily showed the advantage of YandexMQ, how to achieve strict consistency and reliability, and reviewed the architecture of YMQ. YMQ implements the Competing consumers pattern - one message to one consumer. YMQ chip: when consumer asks for a message, it is hidden in the queue so that no one else takes it into processing. If there are problems during processing, then after VisibilityTimeout the message becomes visible in the queue again. The speaker claims that Apache Kafka has a data loss problem when the process is suddenly killed, Yandex MessageQueue is resistant to this.
The report is recommended to everyone who wants to understand the fundamental features of the queues.
Report on how to store and process data in the PostgreSQL time series.
TimescaleDB allows you to store large volumes through tricky partitioning, and PipelineDB provides work with streams directly in PostgreSQL (as well as integration with queues).
TimescaleDB:
The main idea: TimescaleDB is needed primarily for storing data.
PipelineDB:
The main idea: PipelineDB is needed primarily for data processing.
For tasks where a relational DBMS, NoSQL and time series are needed at the same time, this option can be quite convenient.
A good overview report on PostgreSQL, table inheritance and Tips & Tricks performance PostgreSQL 10, 11, 12+. Partitioning through inheritance, sharding. It is useful to see everyone who uses PostgreSQL and wants to make it a little faster.
About the Yandex Monitoring cloud product, which is still in the “Preview” stage, is free. Quite a bit about architecture. An interesting technique is shown - the separation of metadata from data, which enables independent scaling and optimization. Grafana is used as a GUI, while its alerts are not in Grafana.
Experience in commercial system administration of many PostgreSQL servers. It tells about which server parameters are automatically monitored, how tasks are prioritized.
Data Egret uses generalized experience in the Wiki with recipes, checklists - this is the basis for future articles and reports. Use the incident database with a description of problems and solutions - this significantly saves resources. Released a number of utilities for working with PostgreSQL, provide links to them.
Report on the architecture of a complex, highly accessible, distributed Yandex.Market application and on the processes and tools for its development, testing, updating, monitoring. From the interesting:
Report on what ClickHouse is good at and how to cook it in conjunction with Grafana. The main interesting:
In conclusion of the review of reports, I would like to note that we also really liked the report “Video Calls: from millions per day to 100 participants in one conference” ( Alexander Tobol / Odnoklassniki), which was included in the list of the best conference reports according to the voting results. This is a great overview of how videoconferencing works for a group of participants. The report is distinguished by an understandable systemic presentation. If you suddenly have to make video calls, you can see the report in order to quickly gain insight into the subject area.
And now, for dessert, about how we write a retrospective inside the company. First of all, we try to write retro in the first week after attending the conference, while our memories are still fresh. By the way, the retrospective material can then serve as the basis for the article, as you might guess;)
The purpose of writing a retrospective is not only to consolidate knowledge, but also to share it with those who were not at the conference, but want to keep abreast of the latest trends, interesting solutions. A ready-made list helps reduce the time to search for interesting reports to view. We write out the lessons that we have learned for ourselves, mark specific people with a note, why you need to see the report and think about the ideas and decisions of others. The written lessons help to focus and not lose what we wanted to do. After looking at the recordings in 3-6 months, we will understand if we have forgotten about something important.
We store documentation in the company in Confluence, for conferences we have a separate page tree, a piece of wood:
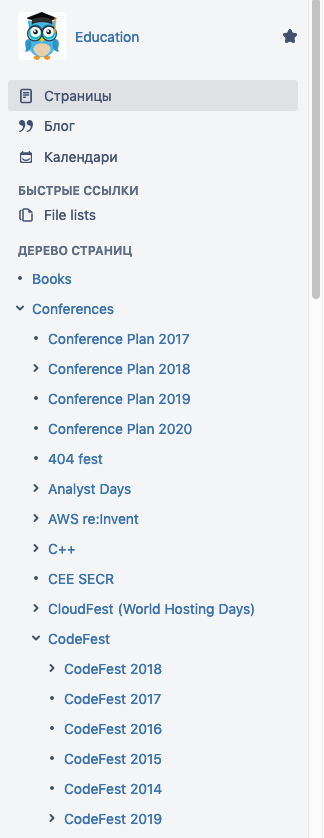
As can be seen from the screenshot, we lay out the materials by year for ease of navigation.
Inside the page dedicated to a specific conference, we store the following sections: overview with links to the event website, schedule, videos and presentations, list of participants (in person and on broadcasts), general impression (overall impression) and detailed overview (detailed overview) ) By the way, we generate a page for retro from a template in which the entire structure already exists. We also make up the contents of the headings so that you can very quickly view the list of reports and go to the right one.
The Overall impression section gives a brief assessment of the conference and gives the participants' impressions. If the participants were at the conference in past years, they can compare their levels and generally understand for themselves the usefulness of attending the event.
The Detailed overview section contains a table:
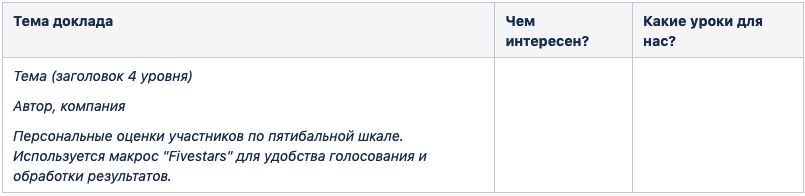
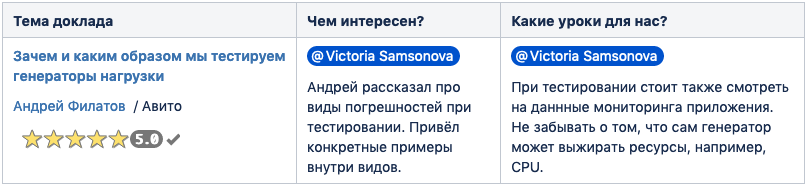
An example of filling a table:
We would be interested to know what reports you liked at Highload Siberia 2019, as well as your experience in conducting retrospectives.
Reports Overview
Failover Cluster PostgreSQL + Patroni. Real implementation experience
Victor Eremchenko (Miro)This is a review report on the successful migration of Redis -> PostgreSQL -> Pgbouncer + PostgreSQL -> Patroni Consul + Pgbouncer + PostgreSQL. The author gives schemes, typical pitfalls of obvious solutions, talks about alternative solutions and why they did not fit. From the interesting:
- Miro engineers have put together their solution so as not to pay for Amazon RDS, and this solution so far suits them.
- Likbez on connection managers for PostgreSQL.
- Describes the process of updating cluster nodes without stopping the application.
- Shows a trick to quickly update PostgreSQL.
It is useful to see those who use or are going to use PostgreSQL, and who have an increasing amount of data.
')
Implementing a geo-distributed persistent message queue using the Yandex Message Queue as an example
Vasily Bogonatov (Yandex)As an introductory speaker, he made a brief comparison of some features of Kafka and RabbitMQ. Briefly: Kafka - a simple queue, a complex recipient; RabbitMQ is a complex queue, a simple receiver. The author also spoke about the types of guarantees for delivering messages from the queue. Important note: no queue can deliver a message exactly 1 time without support on the sender and recipient.
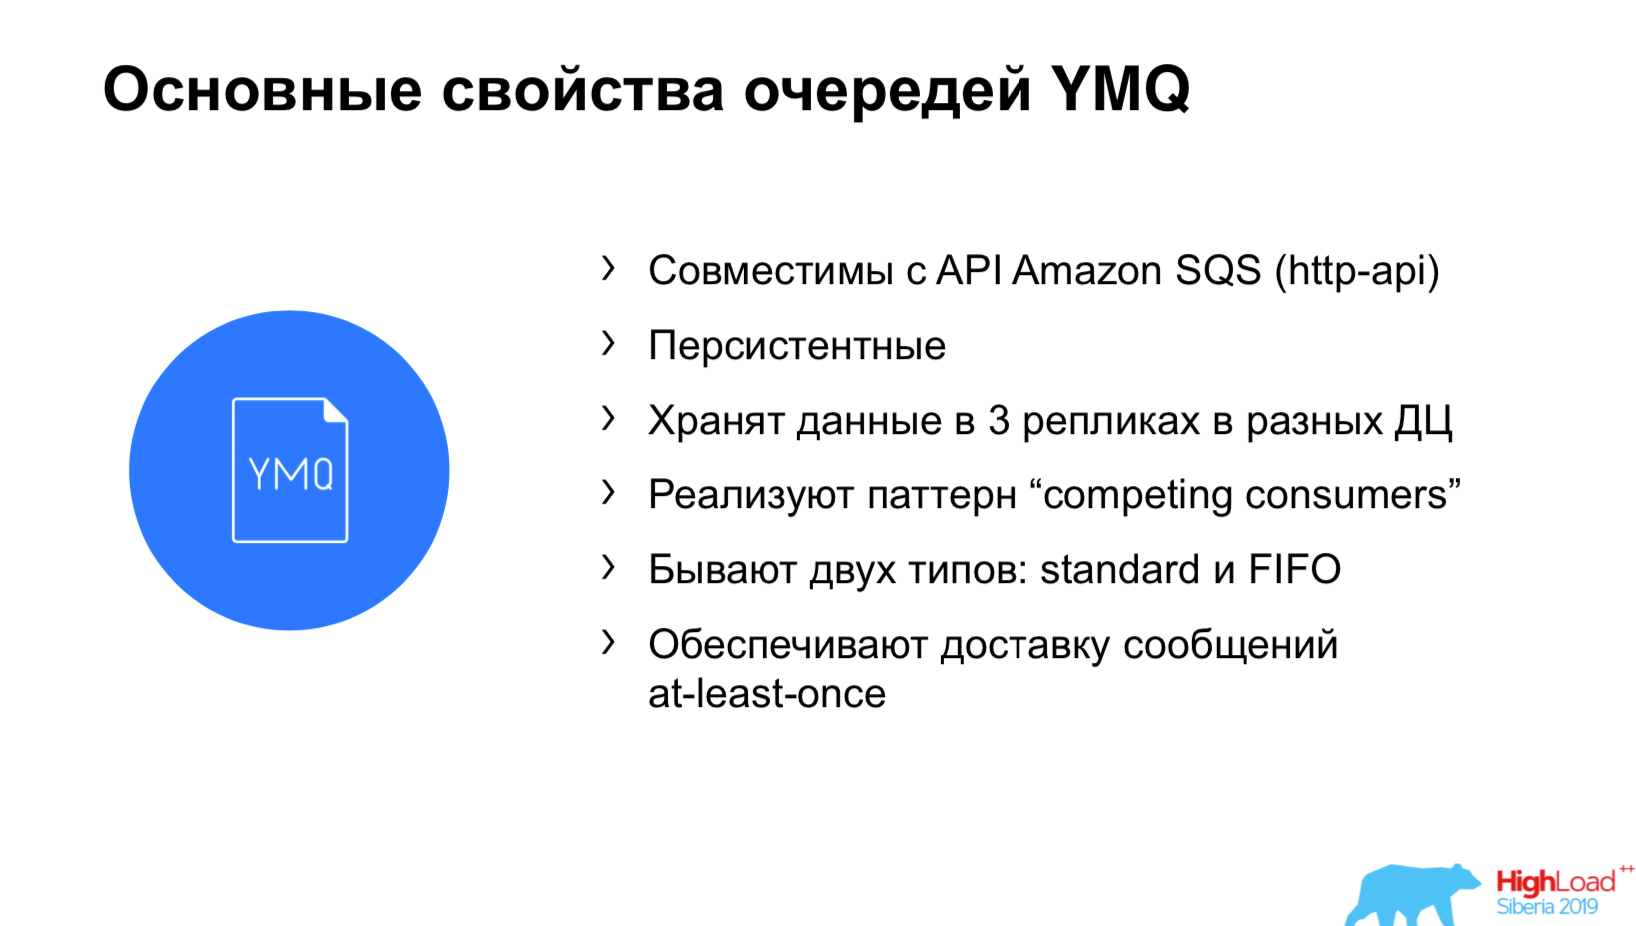
The report is dedicated to YandexMQ. YandexMQ (YMQ) is an API compatible with Amazon SQS queue. The foundation of YandexMQ is Yandex Database (YDB). Vasily showed the advantage of YandexMQ, how to achieve strict consistency and reliability, and reviewed the architecture of YMQ. YMQ implements the Competing consumers pattern - one message to one consumer. YMQ chip: when consumer asks for a message, it is hidden in the queue so that no one else takes it into processing. If there are problems during processing, then after VisibilityTimeout the message becomes visible in the queue again. The speaker claims that Apache Kafka has a data loss problem when the process is suddenly killed, Yandex MessageQueue is resistant to this.
The report is recommended to everyone who wants to understand the fundamental features of the queues.
Time series data in a relational DBMS. Extensions TimescaleDB and PipelineDB for PostgreSQL
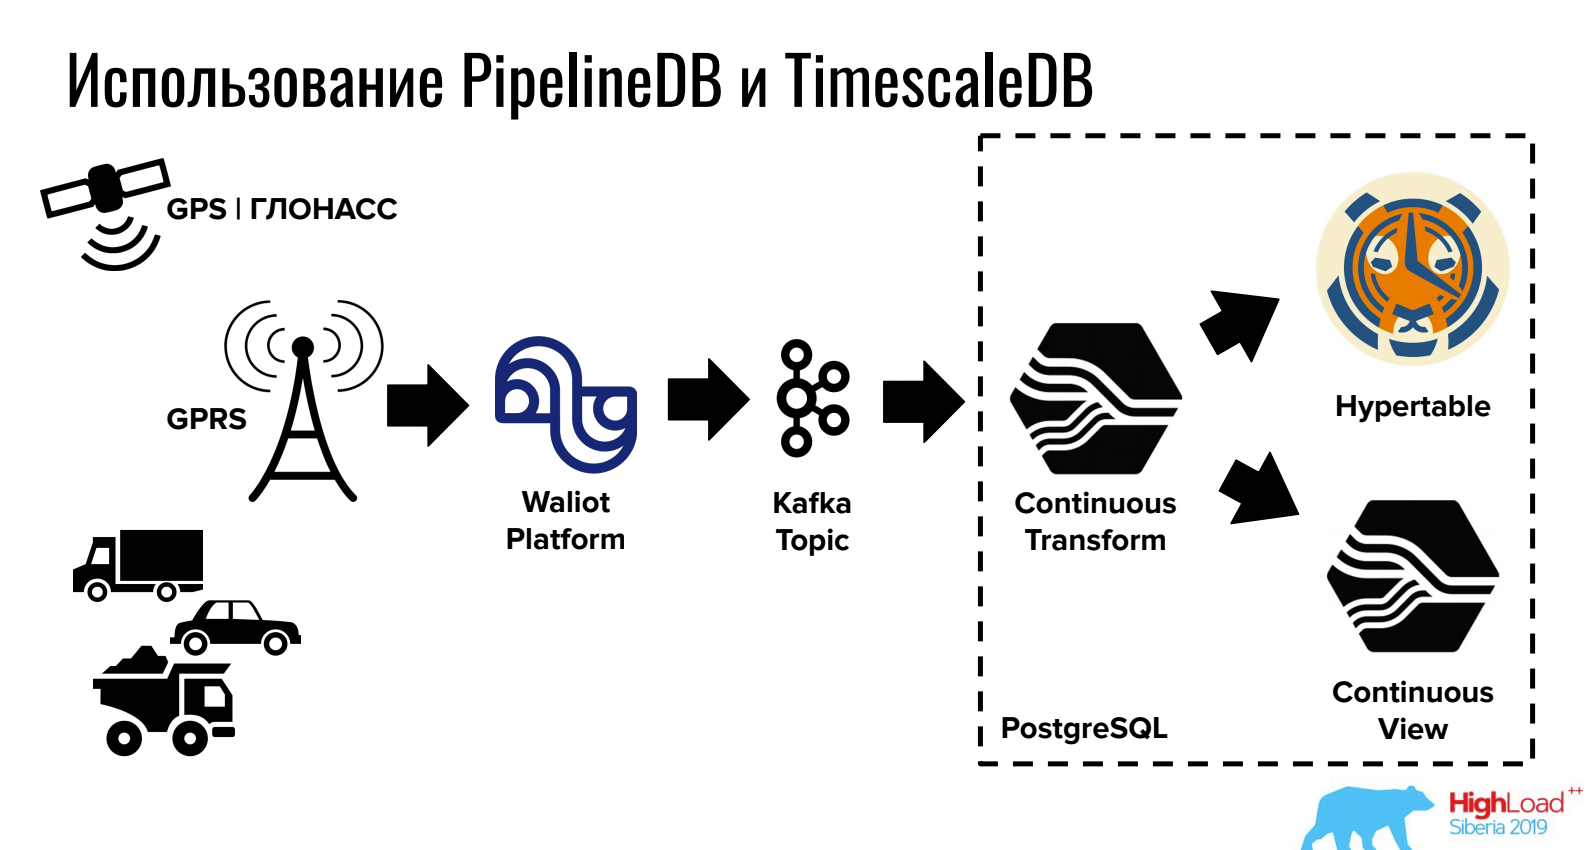
Ivan Muratov (First Monitoring Company)Report on how to store and process data in the PostgreSQL time series.
TimescaleDB allows you to store large volumes through tricky partitioning, and PipelineDB provides work with streams directly in PostgreSQL (as well as integration with queues).
TimescaleDB:
- It has a very stable recording speed with an increase in the volume of the database under heavy loads and with an increase in the number of partitions, measured in thousands.
- Allows you to use standard PostgreSQL features such as SQL, replication, backup, restore, etc.
- Declared a good set of integrations, for example, with Prometheus, Telegraf, Grafana, Zabbix, Kubernetes.
- There is a free open source version.
The main idea: TimescaleDB is needed primarily for storing data.
PipelineDB:
- Allows you to continuously process incoming data using SQL and add the result to a table.
- Has an SQL interface.
- There is a performance of stored procedures under the conditions.
- Integrations with Apache Kafka and Amazon Kinesis are possible.
- There is a free open source version.
- PipelineDB development is frozen on version 1.0, and now only bug fixes are released.
The main idea: PipelineDB is needed primarily for data processing.
For tasks where a relational DBMS, NoSQL and time series are needed at the same time, this option can be quite convenient.
Not very big data
Pavel Luzanov (Postgres Professional)A good overview report on PostgreSQL, table inheritance and Tips & Tricks performance PostgreSQL 10, 11, 12+. Partitioning through inheritance, sharding. It is useful to see everyone who uses PostgreSQL and wants to make it a little faster.
The architecture of a high-performance and highly accessible monitoring system in Yandex
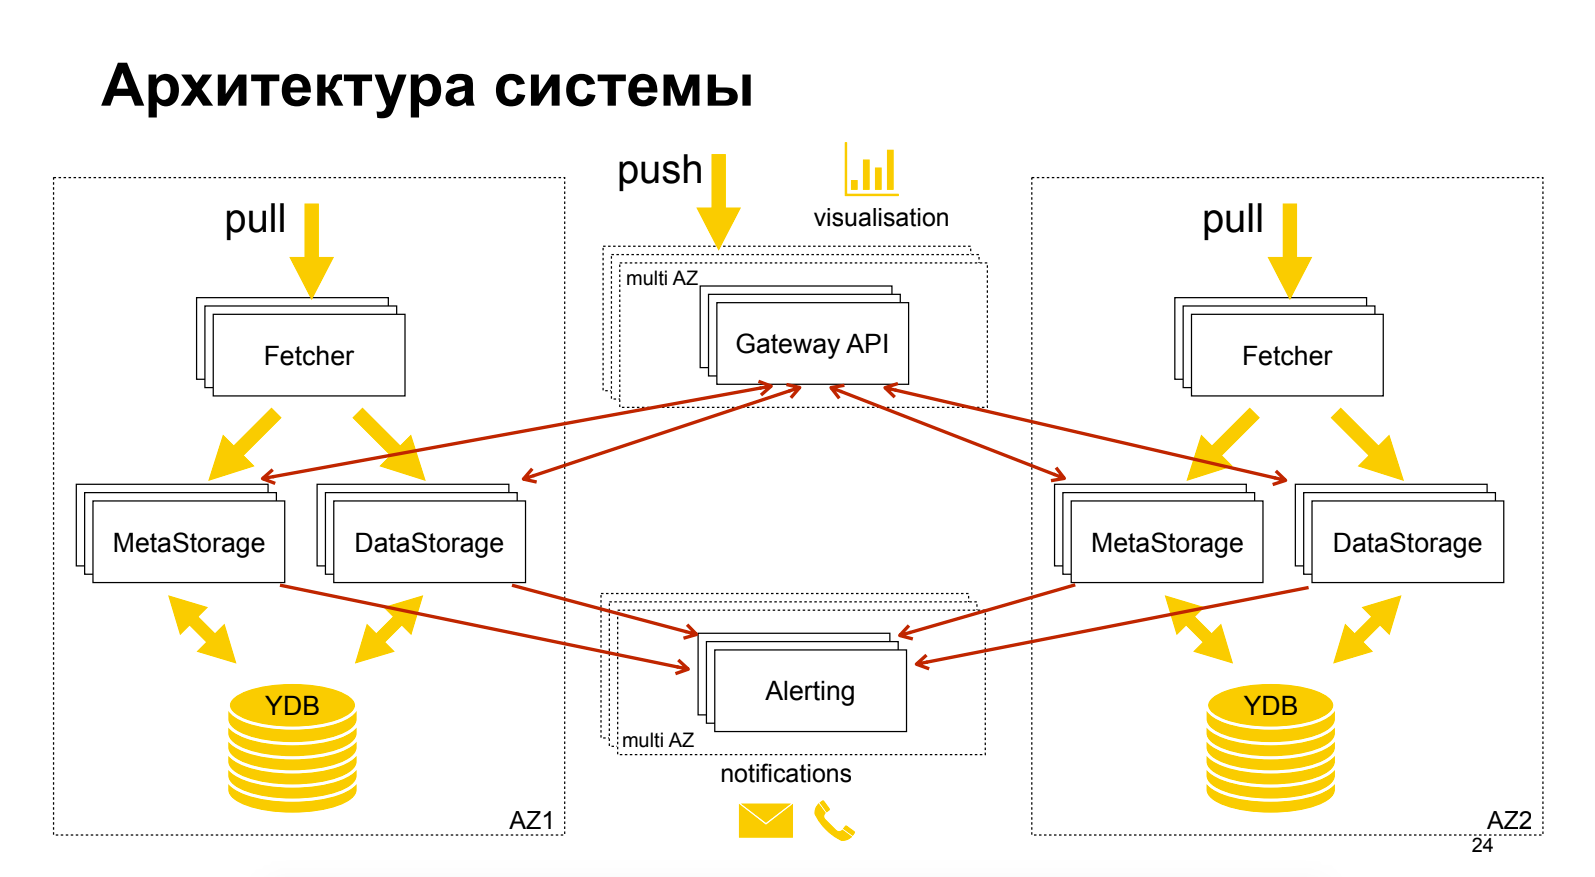
Sergey Polovko (Yandex)About the Yandex Monitoring cloud product, which is still in the “Preview” stage, is free. Quite a bit about architecture. An interesting technique is shown - the separation of metadata from data, which enables independent scaling and optimization. Grafana is used as a GUI, while its alerts are not in Grafana.
Database Administrator Routine
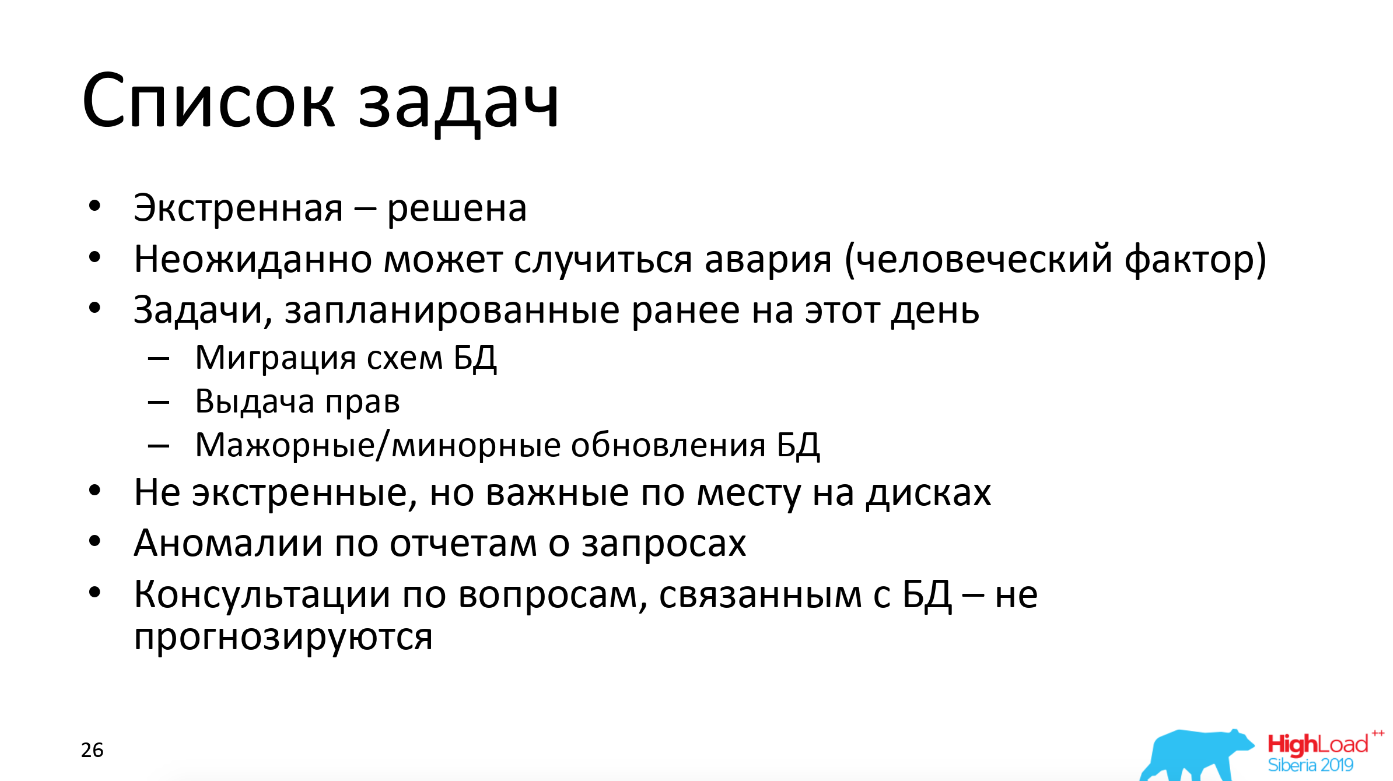
Andrey Salnikov (Data Egret)Experience in commercial system administration of many PostgreSQL servers. It tells about which server parameters are automatically monitored, how tasks are prioritized.
Data Egret uses generalized experience in the Wiki with recipes, checklists - this is the basis for future articles and reports. Use the incident database with a description of problems and solutions - this significantly saves resources. Released a number of utilities for working with PostgreSQL, provide links to them.
Yandex.Market search infrastructure
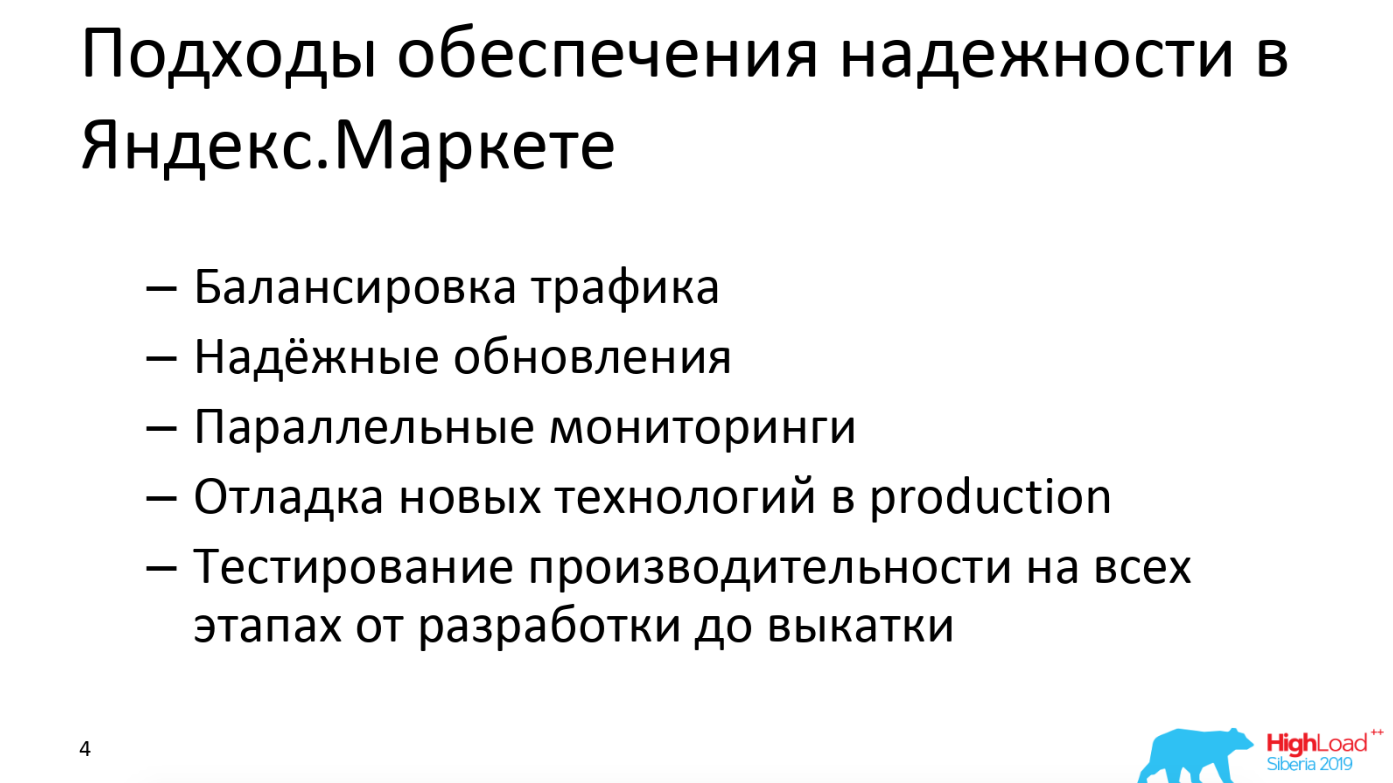
Evgeny Sokolov (Yandex.Market)Report on the architecture of a complex, highly accessible, distributed Yandex.Market application and on the processes and tools for its development, testing, updating, monitoring. From the interesting:
- “Stop-crane” is its solution for quick application and rollback of configuration, it helps to test new functionality.
- Traffic is redirected from the current data center by the balancer to another data center in case of problems.
- Graphite and Grafana are used for monitoring.
- There is duplicate basic monitoring on another technology stack.
- A Shadow cluster is used for developers, which duplicates part of the user traffic. Users do not see the responses of the Shadow cluster.
- An automatic quality calculation is performed during A / B testing.
ClickHouse and a thousand charts
Anton Alekseev (2GIS)Report on what ClickHouse is good at and how to cook it in conjunction with Grafana. The main interesting:
- If there is not enough speed, it is worth using sampling (it is argued that the accuracy of the data after sampling is enough). Sampling in ClickHouse - partial sampling of data with aggregation while maintaining the ratio of various values in the table key, allows you to speed up aggregation at the same time and at the same time have a result that is very close to real.
- ClickHouse can be used to quickly investigate incidents (an interesting example in the report).
- ClickHouse also has a MaterializedView to speed up fetching.
- ClickHouse HTTP interface for querying and data loading is described.
In conclusion of the review of reports, I would like to note that we also really liked the report “Video Calls: from millions per day to 100 participants in one conference” ( Alexander Tobol / Odnoklassniki), which was included in the list of the best conference reports according to the voting results. This is a great overview of how videoconferencing works for a group of participants. The report is distinguished by an understandable systemic presentation. If you suddenly have to make video calls, you can see the report in order to quickly gain insight into the subject area.
Plesk Conferences Retrospective Structure
And now, for dessert, about how we write a retrospective inside the company. First of all, we try to write retro in the first week after attending the conference, while our memories are still fresh. By the way, the retrospective material can then serve as the basis for the article, as you might guess;)
The purpose of writing a retrospective is not only to consolidate knowledge, but also to share it with those who were not at the conference, but want to keep abreast of the latest trends, interesting solutions. A ready-made list helps reduce the time to search for interesting reports to view. We write out the lessons that we have learned for ourselves, mark specific people with a note, why you need to see the report and think about the ideas and decisions of others. The written lessons help to focus and not lose what we wanted to do. After looking at the recordings in 3-6 months, we will understand if we have forgotten about something important.
We store documentation in the company in Confluence, for conferences we have a separate page tree, a piece of wood:
As can be seen from the screenshot, we lay out the materials by year for ease of navigation.
Inside the page dedicated to a specific conference, we store the following sections: overview with links to the event website, schedule, videos and presentations, list of participants (in person and on broadcasts), general impression (overall impression) and detailed overview (detailed overview) ) By the way, we generate a page for retro from a template in which the entire structure already exists. We also make up the contents of the headings so that you can very quickly view the list of reports and go to the right one.
The Overall impression section gives a brief assessment of the conference and gives the participants' impressions. If the participants were at the conference in past years, they can compare their levels and generally understand for themselves the usefulness of attending the event.
The Detailed overview section contains a table:
An example of filling a table:
We would be interested to know what reports you liked at Highload Siberia 2019, as well as your experience in conducting retrospectives.
Source: https://habr.com/ru/post/460885/
All Articles