How to use Voronoi diagrams to control AI
Which route will be the safest, where are the most enemies and where is the nearest first-aid kit? All these frequently encountered problems of spatial relationships can be effectively solved using mathematical partitions called “Voronoi diagrams”. From this post you will learn how to analyze game cards and receive information that ensures the realism and success of artificial intelligence.
Spatial relationship
A spatial relationship is any information that describes how one object in space is related to another. Examples: the distance between them, the area covered by each of them space and the intersection of these areas, the number of such objects located in one area.
Such relationships are constantly used in video games and can provide very useful AI information, as well as to the player himself.
')
Voronoi has an answer
The Voronoi diagram describes the spatial relationship between closely spaced points or their nearest neighbors. This is a set of connected polygons obtained from points or locations. Each line of Voronoi’s “area” is located in the middle between two points.
To understand, take a look at the picture:

As you can see, each line is exactly in the middle between two points, and all of them are connected in the center. Add a few more points to the scene and see what happens:
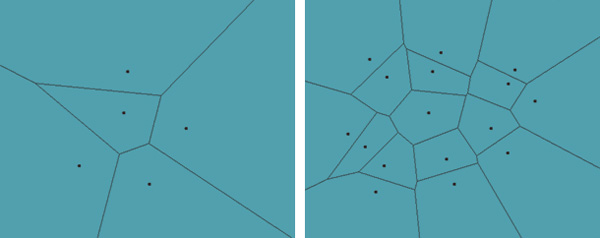
The picture has become more interesting! We are already having real areas.
What does each of the areas tell us? We know that being in the area are guaranteed to be located closest to one point, which is also in the area. This tells us a lot about what's nearby; such is the fundamental spatial relation in Voronoi diagrams.
Turn Voronoi inside out: Delaunay triangulation
The system opposite to the Voronoi diagram is called Delaunay triangulation. This diagram consists of lines from each point to its nearest neighbors, and each line is perpendicular to the Voronoi edge it intersects. Here's what it looks like:
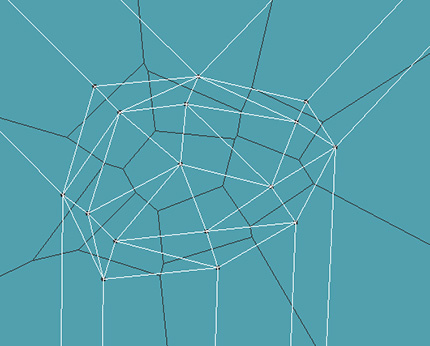
White marks the Delaunay line. Each Delaunay line corresponds to one and only one Voronoi edge. At first, it seems that some of them cross several edges, but looking closely, you will understand that this is not so.
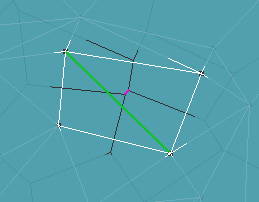
In the figure, the green Delaunay line corresponds to the pink rib of Voronoi. Just imagine that the pink rib goes further and you see that they intersect.
Thanks to Delaunay triangulation, we see that instead of polygons we now have many triangles. This is incredibly useful because we divided the area into triangles that can be rendered. This technique can be used for tessellation or triangulation of figures. Fine!
In addition, this is a great way to create a graph from multiple points in case we want to move from one point to another. For example, dots may indicate cities.
Voronoi data structure
We already know what the Voronoi diagram looks like; Now let's see how its data structure will look. First, we need to save the points that are the basis of the Voronoi diagram:
class VoronoiPoint { float x float y VoronoiRegion* region } Each
VoronoiPoint has a location (x, y) and a link to the area in which it is located.Next we need to describe
VoronoiRegion : class VoronoiRegion { VoronoiPoint* point Edge *edges[] // our list of edges } The area stores a link to its
VoronoiPoint , as well as a list of VoronoiEdges edges VoronoiEdges .Let's see what
VoronoiEdges looks VoronoiEdges : class VoronoiEdge { VoronoiPoint* pointA VoronoiPoint* pointB float distance // distance between point A and point B float x1, z1, x2, z2 // to visualize start & end of the edge } An edge knows two points that define it, as well as the distance between them. For visual display, as well as for constructing the shape of the polygonal region, we need to store the start and end points of the edge.
And that is all. With this information, we can easily build a Voronoi diagram. Below we will learn how the Voronoi diagram is generated. But for now, let's look at a couple of examples of how this data can be used.
Find your nearest medicine cabinet
Again, look at the Voronoi diagram for points.
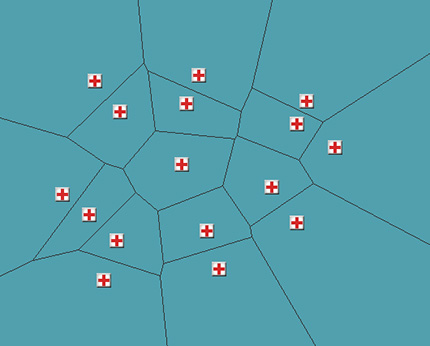
If each point indicates a first-aid kit, then we can quickly determine where the closest to us is, but first we need to determine the area in which we are. Voronoi diagrams do not provide an effective way to define an area, however, to speed up the search, we can store a link to each area in the quad tree or in the R-tree . And having learned the region, we will be able to recognize its neighbors, and the neighbors of its neighbors.
For example, if there are no more first-aid kits in your area, then you need to find a path to another nearest one. From the data structure and the pseudo-code shown above, we can understand that knowing the region, we can recognize its edges. And with the help of these ribs we can get neighbors. We will take the closest neighbor and see if there is a first-aid kit in it.
Here you can also apply Delaunay triangulation. It consists of lines between the first-aid kits. Then you can get around it using the A * path search algorithm to find the nearest first-aid kit.
Search for a safe route
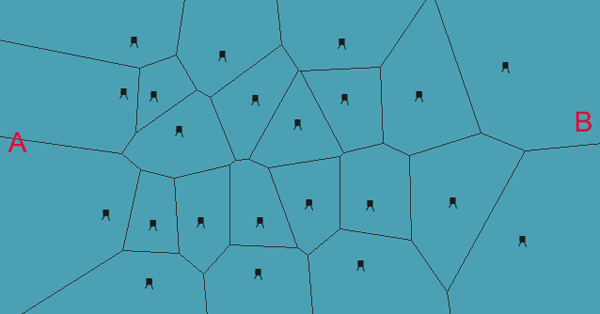
Replace all first-aid kits with enemy watchtowers. You need to find the safest route between them so as not to be caught. The standard way of graph traversal in video games is to use the A * algorithm . Since the Voronoi diagram is a graph, it is very easy to implement a search. All we need is an A * algorithm that supports general graph structures; plan ahead and it will help you in the future.
Having prepared the graph, you need to assign weight to each edge. For us, the weight value will be the distance to these watch towers, and you can get it directly from the data structure: each
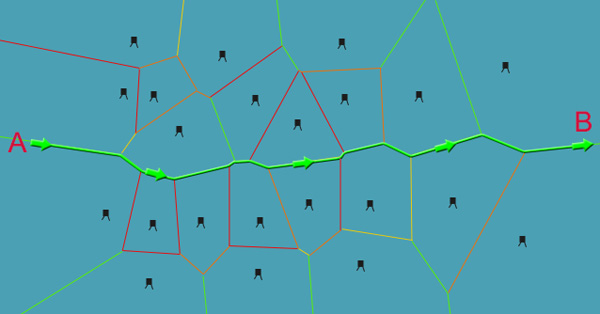
VoronoiEdge already knows its distance between two points. Usually, the smaller the value on the edge A *, the better, but in our case, the larger the value, because it indicates the distance to the tower.This is what the initial graph looks like if we want to move from point A to point B:
Applying weight to each edge, we will see which route is better to choose:
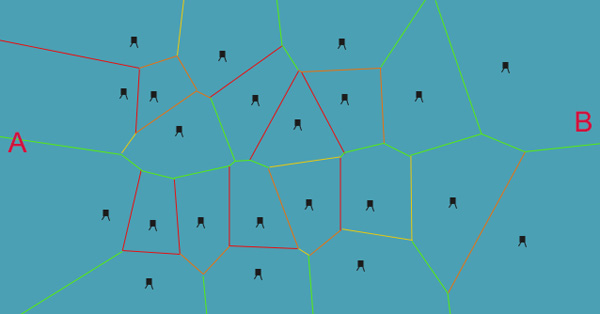
Red ribs indicate the nearest contacts with the towers. Orange indicates longer ones; yellow even more distant, and finally, green - the safest. After executing A * with these weights, we get the following path:
With this use of the scales, not the fastest , but the safest way will be chosen, which is what we need. AI should adhere to this path and not deviate from it!
You can take another step to guarantee a safe path: eliminate all edges that are closer than the minimum safe distance. For example, if each watchtower has a radius of visibility of 30 units, then all edges, the distance to which points are shorter, can be removed from the graph and not bypassed.
You can also use this method to find the widest route for large units that are unable to pass through bottlenecks. Each edge has a distance between two points, so we know if they can pass in this space.
You can also perform the opposite operation - use the Delaunay triangulation diagram, and get the lines coming from each watchtower. The guards' AI will be able to quickly determine which other towers are nearby and, if necessary, go to their aid.
Search for a tightly positioned item set
Suppose we need to drop a catnip parcel from a plane for a bunch of seals sitting on the ground. What is the best place to drop it so that the largest number of cats can use it? This can be extremely costly. But, fortunately, we can make a reasonable assumption using the Delaunay triangulation.
Hint: do not forget that Delaunay triangulation is just the inverse of the Voronoi diagram. It is formed by connecting each Voronoi point with neighboring points obtained from the list of edges.
With this collection of triangles, you can explore the area covered by each of the triangles. If we find the triangle with the smallest area, then we have three nearest points, or cats. This may not be the densest average cluster on the surface, but it will be a good assumption. If we could discard a few parcels with mint, we would just mark the triangles already selected and move on to the next ones in increasing size.
The designation of such regions is also called the circumscribed circles of the Delaunay triangulation. Each circle is the largest circle that can fit at the points of the triangle. Here is an image of the circumscribed circles for the Voronoi diagram:
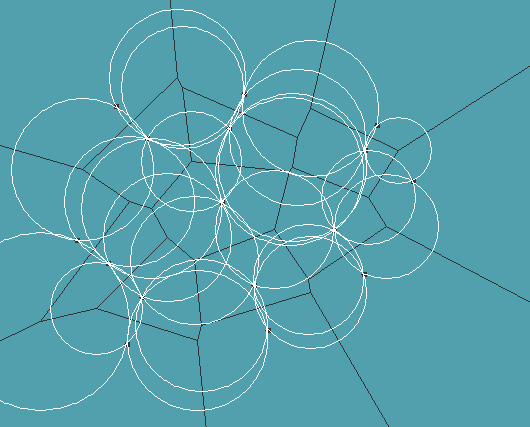
You can use the exact center of the circles to determine the center of the area where the catnip is shipped. In fact, the radius of the circle is a more suitable way to determine the best triangle to fold instead of the area of the triangle, especially if the two points of the triangle are very close to each other and the third is far away; then we get a very sharp triangle with a small area, but the points that define it are actually very far apart.
Implementation of Voronoi diagrams
There are several ways to generate Voronoi diagrams, and the choice of the method used depends on the time at which we receive the data.
Fortune Algorithm
The fastest way is called Fortune's algorithm . It runs in
O(n log(n)) and requires that all points used to generate the graph be known at the time the generation starts. If you add new points later, you will have to regenerate the entire graph. If there are few points, then this may not cause problems, but if you have 100 thousand of them, then this can take a lot of time!The implementation of this algorithm is nontrivial. Cross parabolas and special cases. However, this is the fastest method. Fortunately, there are many implementations of this open source algorithm that you can use, and I have provided links to them below.
Let's see how it works.
The algorithm consists in sliding a line (vertical or horizontal) over an area with dots. When he meets a point, he begins to draw a parabola out of it, which continues with a sweeping line. Here is the animation of this process:
Intersecting parabolas form the Voronoi ribs. But why parabolas?
To understand this, imagine each point as containing an inflatable balloon that inflates until it collides with another ball. You can transfer this idea to circles expanding on a 2D plane. We will make another ball forward and place at each point an inverted cone with an angle of inclination of 45 degrees, increasing to infinity. Then imagine a sweeping line in the form of a line, also at 45 degrees, which slides along until it collides with the cones. Since the plane and the cones are located at the same angle, when they cross, they form parabolas.
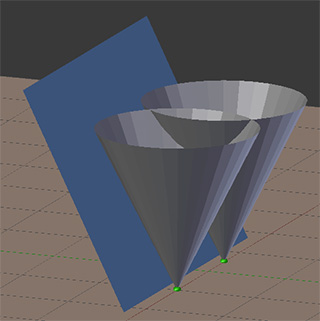
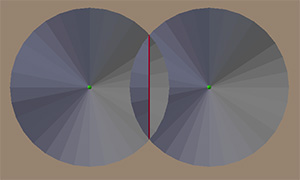
Growing up, the cones sooner or later intersect with one or more other cones. If we look at the intersection of the cones, or circles, we get straight lines of the Voronoi edges. In the figure, the red line indicates the intersection of the cones. If the cones grow even further (vertically up to infinity), then the red line will continue to stretch.
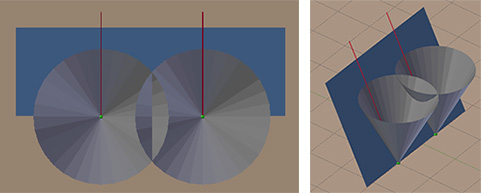
When the plane slides and the first contact with the cone occurs, the resulting line will be like this:
With further movement of the plane along the cones, we will see how parabolas form:
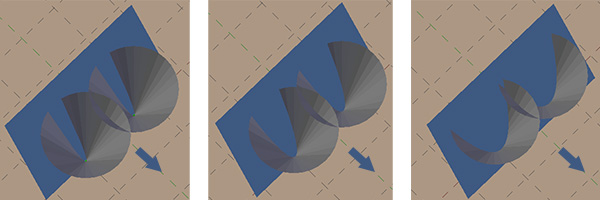
The plane continues to move around the stage. For each point it encounters, it examines neighboring points on the sweeping line that already have parabolas and starts a new parabola at that point. She continues to move on and grow until this new parabola begins to overlap not with the one that was previously superimposed. Then this previous parabola closes. This is the point at which Voronoi’s lines of three points meet.
As stated above, this is pretty hard to understand, so here are links to open source implementations that you can use and learn:
- Java on GitHub. Authors: Benny Kjær Nielsen and Allan Odgaard https://github.com/sorbits/visual-fortune-algorithm/tree/master
- Python on GitHub: https://github.com/MikkoJo/Voronoi . Posted by: Mikko Johansson
- A detailed implementation of Fortune's algorithm: http://blog.ivank.net/fortunes-algorithm-and-implementation.html
Incremental Triangle Insertion
Another method is to incrementally insert one point at a time, starting with a base triangle of three points outside the possible area of all other points. This method runs with
O(n^2) and does not require all points at the time of generation.When you insert a new point, it defines the existing area in which it falls. This area is then subdivided and new areas are created.
Here is an open source example to use and learn:
- Java source. Posted by: Paul Chew . For free use. Download the zip file . Source: http://www.cs.cornell.edu/home/chew/Delaunay.html
Conclusion
Now you have to imagine what Voronoi diagrams can give your game and its AI. If you have a properly structured graph of nodes and edges, you can request important information so that everyone gets their first-aid kits, catnip and makes their way past enemy towers.
Source: https://habr.com/ru/post/460813/
All Articles