Advanced Debug
Debug Area is a useful feature in the work of an iOS developer in Xcode. As soon as we begin to develop development under iOS, and try to move away from the usual and favorite print method, and find faster and more convenient methods for understanding the state of the system in a certain period, we begin to explore the Debug Area.
Most likely, in the Debug panel, your view will fall before you understand what is happening there. When the application first crashes, the lower menu opens automatically, it can initially serve as an aid to understanding the problem (Recall the good old “Fatal error: Index out of range”), basically at the very beginning you will not understand what Xcode wants from us and accept Google mistakes, but in the course of growth, more and more information will become clear.
From the very beginning, the programmer tries to optimize his work. To do this, we strive to understand at what point our program has moved into an incorrect state. And here, depending on the point at which the evolution of the programmer is located, the methods may differ. First, how correctly Debug is done using the “print ()” method, then the Breakpoints layout and the “po” methods are called, then the Debug Variable Input is introduced (the areas next to the console in Xcode), and then the understanding of how to compile the code comes Breakpoint methods - “expression” (At least, this was my evolution).
')
Let's try different ways that will help us understand and change the state of our application. The simplest ones like “print ()” and “po” will not be considered, I think you already understand their essence and know how to apply.
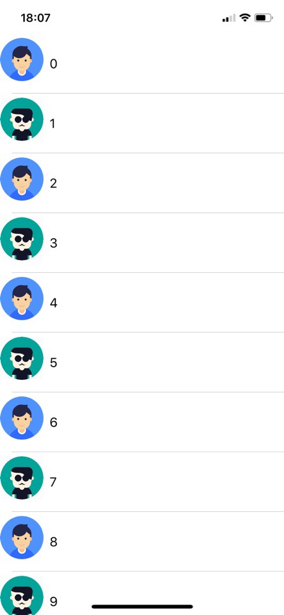
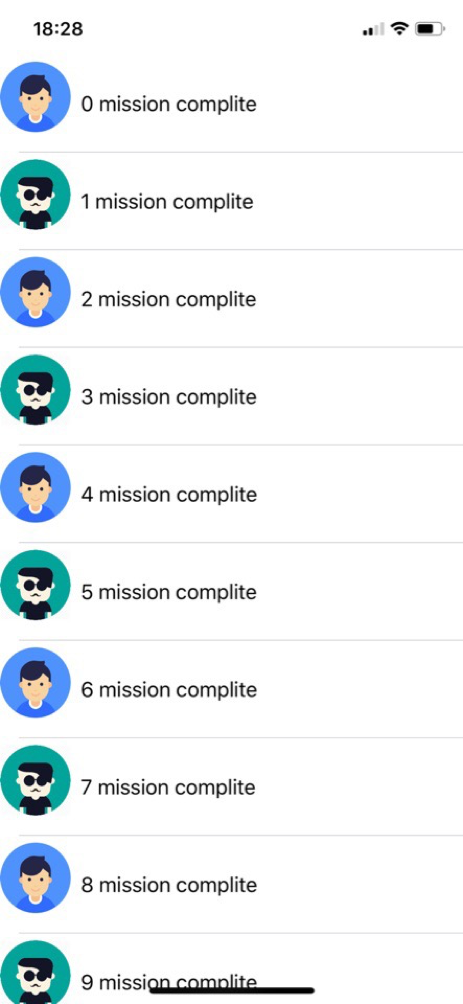
Let's create a simple application with one screen in which we will have only one type of cells (TableViewcell) with two elements inside: UIImageView and UILabel. In the cells we will write its ordinal number, and put either image1 or image2 in the image.
The tableViewCellForRowAtIndexPath method will create cells for us, fill in the data and return:

This method will generate the following table:
Let's stop our program and add some text to our label.
1. We set Breakpoint:

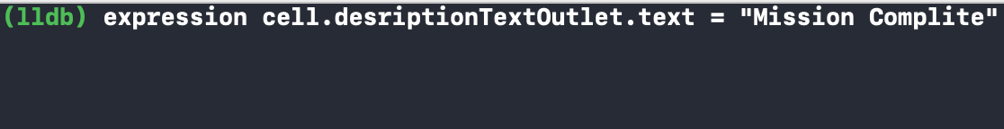
2. The program stopped execution on line 55, immediately after the assignment of the text. Since we are on the line located in the cell's viewable area, we can interact with our cell.
3. We write the command to change the cell text in the console:
4. Remove our Breakpoint and click the button “continue program execution”.
5. On the screen of our phone, we see that everything worked out successfully:
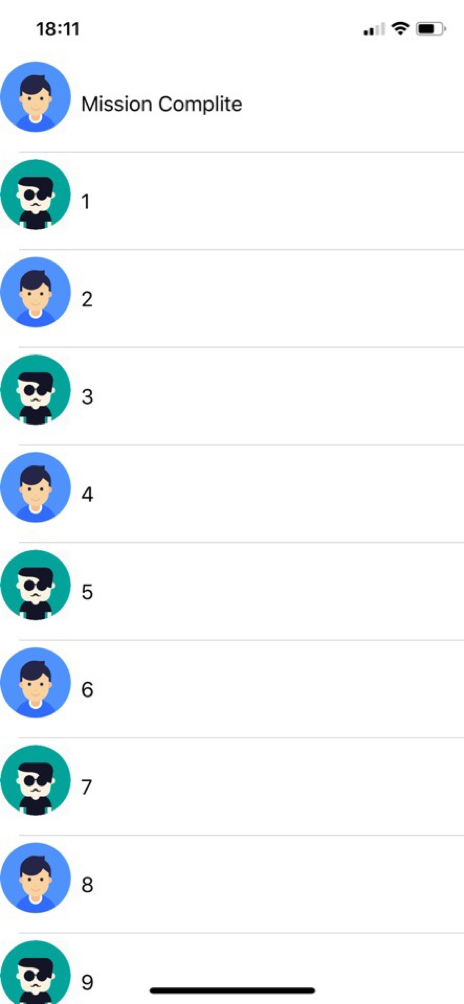
expression executes the expression and returns the value on the current thread.
But, what if we need to change the text in a large number of cells? Or have we, in the process of executing the program, understood what we need to change?
We can optimize the execution of this operation and speed up the work a bit, make text changes to cells when it reaches Breakpoint and continue to execute the program, it will reduce a lot of time and allow not to print the same for each cell.
To do this, we need to slightly modify our Breakpoint, prescribe an additional code there that will change its text within the visibility range of our cell and continue the work of the program.
9. We try.
This is a success, it turned out to change the text for each cell during the formation of the table, and we did not have to sacrifice time and prescribe operations for each.
There are always moments when something happens in our application that we cannot explain, the text does not change or changes more than necessary, it would seem that Breakpoint in this case has no place to put. But this is not entirely true, if you know Obj-C, and you know what method the compiler you want to track follow, you can put Breakpoint on it and the next time the method is called, the application stops while the Assembler code is running.
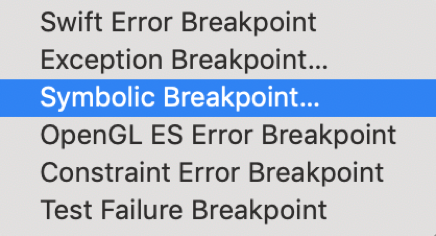
1. In the Breakpoint Navigator, select Symbolic Breakpoint.
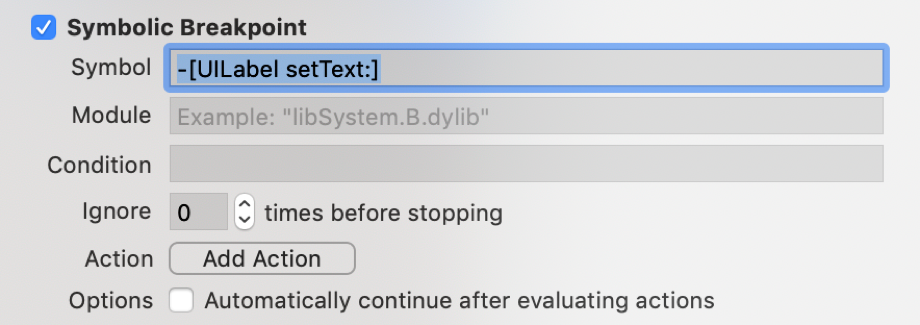
2. We want to track the method of setting the text in the cell, we write - [UILabel setText:].
3. The zero argument does not exist, and the counting starts from the first. The first method caught is not the one we need (it sets the current time to the status bar), and the second one is ours:
4. Under the “$ arg1” stored object description.
5. Under the “$ arg2” stored selector function.
6. Under the “$ arg3” stored text obtained by the method.
Ok, this seems to be understandable. But sometimes situations arise when the installation of one text in the status bar is not limited, and it is necessary to track the implementation of the method in a specific controller, what should be done? You can turn on Breakpoint similar to what we set earlier, but by setting its position in the code. What does it mean? We know for sure that our view will appear when we set the text in the cell, so it’s the most important thing to put it in viewDidLoad or after creating the cell.
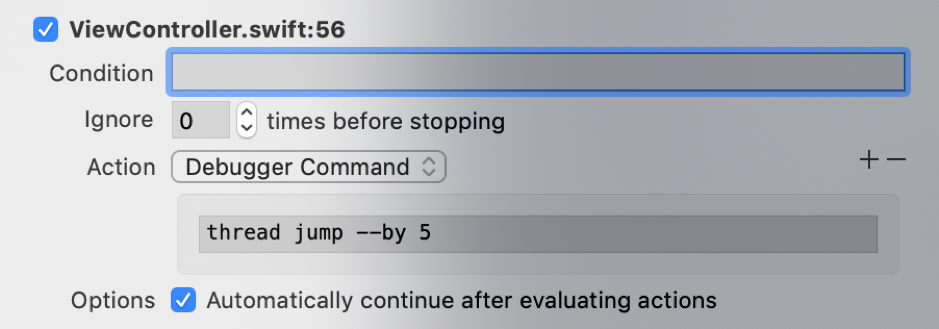
To create a breakpoint, we set it on the line, and in the action we write the following code:
Here's what happened:

But what if we suspect that some line of code spoils the whole program? In the process of executing code, you can avoid executing a certain line of code like this:
There is also another option that will allow to optimize the transmission of lines - this is the prescription of the corresponding command in the “edit breakpoint”. The command is risky, because the essence of such jumps is to save us from the rebuild, but if you miss the initialization of the object and try to contact it, the program will fall.
We will stop our program on initializing the image, and we will not generally assign a picture to a cell, for this we need to skip five lines of code and return a cell without a picture, for this we skip the next five lines of code on the current thread, and continue the program:
It sounds pretty good, but I still want to assign a picture, let's add an assignment method to the breakpoint:
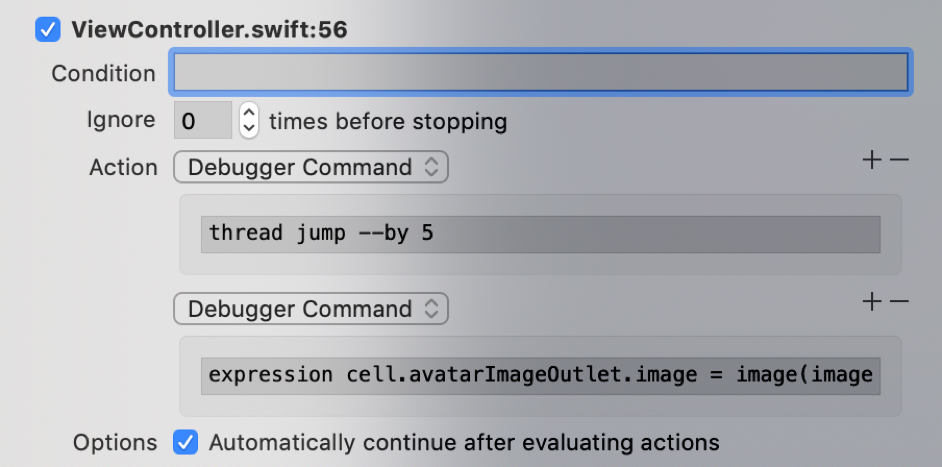
A successful combination, now we have only one type of picture in each cell.
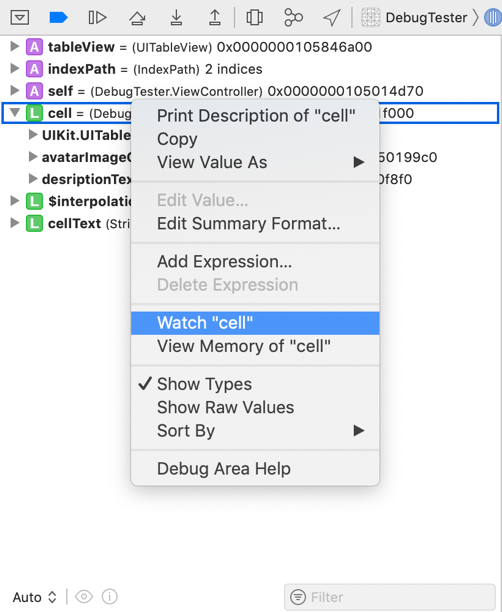
Another convenient feature in the debugger is tracking the values in the program, watchpoints. Watchpoint is somewhat similar to KVO, we set a breakpoint to change the state of an object, and every time it changes its state, the program execution process stops, and we can see the meaning and location, from where and by whom the value was changed. For example, I put a watchpoint on a cell to find out what happens when a table is scrolled through and a new cell is initialized. The list of commands turned out to be very large, so I’m not going to give it just to mention some: the execution of the layout view located inside the cell and the constraint, animation, state setting for the cell, and much more.
To set a watchpoint to a value, you must stop the execution of the breakpoint program in the scope of the properties you want to monitor, select a property in the “debug variable” panel and select watch “<parameter>”.
In order to remove a watchpoint from a variable, you need to look into the breakpoint navigator, and our watchpoint will be there along with the rest of the breakpoint.
Sometimes we need to learn more about the object that we are trying to otdebezhit. The simplest option is to use “po” to display information about the object, and look at the location of the object in memory. But it happens that we do not have a direct link to the object, it is not represented in the API view, on which the library lies or is possibly hidden. One of the options to use View Hierarchy, but it is not always convenient and to understand that you have found the desired view is not always difficult. You can try using the command:
It is in Obj-C but in Swift it was removed because of the peculiarities of the language’s work, we cannot do it, but since Debuger works with Obj-C, in theory it can be fed to this command, and it will understand what you want from it . To execute Obj-C code, enter the following command in the console:
What do you see here? I see a rather uncomfortable construction, which could get used to over time, but we would rather not do this, but use typealias to simplify the command:
Now our team is reduced and simplified, but continues to do the work:
Will it work after closing Xcode or in another project? Unfortunately no. But it can be fixed! By creating a .lldbinit file and putting our alias there. If you do not know how, here is the instruction on the points:
1. Create a .lldbinit file (as a prototype, you can take .gitignore, it belongs to the same type of text invisible text files).
2. Write the following command in this file exactly:
3. Place the file in the folder “MacintoshHD / Users / <Here the name of your user is>”.
And so we got a description of all the views presented on the screen. Let's try to see what we can do with the address of objects in memory. For Swift, there is a method with a flaw here, all the time it is necessary to reduce the type of object in memory to a specific value:
Now we can see the position of our image in the cell, let's move it so that it is in the center of the cell and has an indent from the side of 20 px.

It happens that the change is not immediately noticeable, but it is necessary to remove the application from the debug in order to notice the change.
But if we want to see something similar in each cell, we need to speed up the execution of commands, we can write some scripts in Python that will work for us (how to add scripts you can see here www.raywenderlich.com/612-custom-lldb-commands-in- practice ), and if you know how to handle Python and want to write on it for lldb, then you need it.
I decided to write an extension for the UIView class, which will simply move the view in the right direction, it seemed to me that there would be fewer problems with connecting new scripts to LLDB and not difficult for any iOS programmer (otherwise you need to master Python for LLDB).
I did not begin to look for the place of the object in memory and bring it into the necessary class, which would then take the frame, it also takes too much time. The question was solved by writing a function in the UIView extension:

Unfortunately, it does not work well with cells, most likely due to the fact that at the time of the flush command execution, not all cell positions were calculated and it did not appear on the screen (we have not yet returned tableViewCell). It works fine with the other static elements.
Knowing the position of the view in the hierarchy, we can access it and change its position.
And now the opposite situation, when we can access the ViewHierarchy and want to get view data from there. In Xcode, it is possible to view the view hierarchy during program execution, as well as there you can view colors, location, types, and bindings to other objects, including. Let's try to access the constraints of our UIImageView.
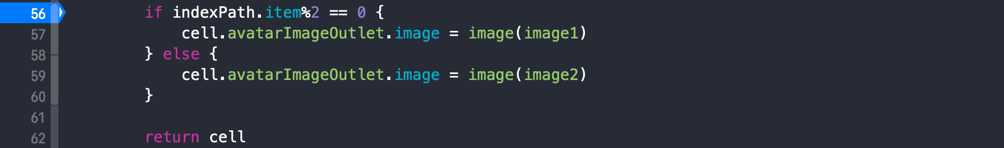
To get data about constraint:
1. Click on the Debug View Hierarchy.
2. Turn on Clipped Content in the panel at the bottom of the screen that appears.
3. Enable Constraints on the same panel.
4. Select Contraint.
5. In the menu, click Edit -> Copy (Command + C).
6. The following binding is copied: ((NSLayoutConstraint *) 0x2838a39d0).
7. And now, just as we change it through the code, you can also change it in lldb:
8. After clicking continue, the item will update its position on the screen.
In the same way, you can change colors, text and more:
The demo project turned out to be too simple (60 lines of code in ViewController), most of the code I wrote is presented in the article, so there will be no difficulty in reproducing the test project.
PS: If you have any questions or comments please write. Check out WWDC and Debazh Pro.
I advise you to also read the materials:
Inspired by the Advanced Debugger WWDC 18 Session
Debugger Commands
Adding Python scripts to LLDB Xcode
Most likely, in the Debug panel, your view will fall before you understand what is happening there. When the application first crashes, the lower menu opens automatically, it can initially serve as an aid to understanding the problem (Recall the good old “Fatal error: Index out of range”), basically at the very beginning you will not understand what Xcode wants from us and accept Google mistakes, but in the course of growth, more and more information will become clear.
From the very beginning, the programmer tries to optimize his work. To do this, we strive to understand at what point our program has moved into an incorrect state. And here, depending on the point at which the evolution of the programmer is located, the methods may differ. First, how correctly Debug is done using the “print ()” method, then the Breakpoints layout and the “po” methods are called, then the Debug Variable Input is introduced (the areas next to the console in Xcode), and then the understanding of how to compile the code comes Breakpoint methods - “expression” (At least, this was my evolution).
')
Let's try different ways that will help us understand and change the state of our application. The simplest ones like “print ()” and “po” will not be considered, I think you already understand their essence and know how to apply.
Let's create a simple application with one screen in which we will have only one type of cells (TableViewcell) with two elements inside: UIImageView and UILabel. In the cells we will write its ordinal number, and put either image1 or image2 in the image.
The tableViewCellForRowAtIndexPath method will create cells for us, fill in the data and return:
This method will generate the following table:
Breakpoint
Let's stop our program and add some text to our label.
1. We set Breakpoint:
2. The program stopped execution on line 55, immediately after the assignment of the text. Since we are on the line located in the cell's viewable area, we can interact with our cell.
3. We write the command to change the cell text in the console:
4. Remove our Breakpoint and click the button “continue program execution”.
5. On the screen of our phone, we see that everything worked out successfully:
expression executes the expression and returns the value on the current thread.
Edited breakpoint
But, what if we need to change the text in a large number of cells? Or have we, in the process of executing the program, understood what we need to change?
We can optimize the execution of this operation and speed up the work a bit, make text changes to cells when it reaches Breakpoint and continue to execute the program, it will reduce a lot of time and allow not to print the same for each cell.
To do this, we need to slightly modify our Breakpoint, prescribe an additional code there that will change its text within the visibility range of our cell and continue the work of the program.
- Create a breakpoint.
- Left mouse button on the breakpoint'a arrow.
- Click Edit Breakpoint.
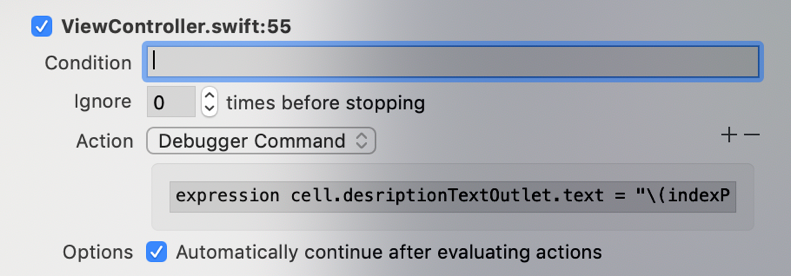
- Condition - conditions under which Breakpoint will work, now we do not need it.
- Ignore - how many times to skip Breakpoint before it works (also not that).
- But Action - what we need, choose the type of actions Debugger Command.
- We write the expression that we need to perform:
- expression cell.desriptionTextOutlet.text = "\ (indexPath.item) mission complite”.
- Put a tick - Continue execution after successful execution of the command.
9. We try.
This is a success, it turned out to change the text for each cell during the formation of the table, and we did not have to sacrifice time and prescribe operations for each.
Breakpoint function
There are always moments when something happens in our application that we cannot explain, the text does not change or changes more than necessary, it would seem that Breakpoint in this case has no place to put. But this is not entirely true, if you know Obj-C, and you know what method the compiler you want to track follow, you can put Breakpoint on it and the next time the method is called, the application stops while the Assembler code is running.
1. In the Breakpoint Navigator, select Symbolic Breakpoint.
2. We want to track the method of setting the text in the cell, we write - [UILabel setText:].
3. The zero argument does not exist, and the counting starts from the first. The first method caught is not the one we need (it sets the current time to the status bar), and the second one is ours:
4. Under the “$ arg1” stored object description.
5. Under the “$ arg2” stored selector function.
6. Under the “$ arg3” stored text obtained by the method.
Ok, this seems to be understandable. But sometimes situations arise when the installation of one text in the status bar is not limited, and it is necessary to track the implementation of the method in a specific controller, what should be done? You can turn on Breakpoint similar to what we set earlier, but by setting its position in the code. What does it mean? We know for sure that our view will appear when we set the text in the cell, so it’s the most important thing to put it in viewDidLoad or after creating the cell.
To create a breakpoint, we set it on the line, and in the action we write the following code:
breakpoint set --one-shot true --name "-[UILabel setText:]” breakpoint set —one-shot true — create a breakpoint—name is the name of a symbolic breakpoint“-[UILabel setText:]” called methodHere's what happened:
Skip lines
But what if we suspect that some line of code spoils the whole program? In the process of executing code, you can avoid executing a certain line of code like this:
- Put a breakpoint on a string that we would not want to perform.
- When the execution is stopped, we drag it into the line with which we want to continue the execution of the program (funny, but this does not always work, below is the option without dragging).
There is also another option that will allow to optimize the transmission of lines - this is the prescription of the corresponding command in the “edit breakpoint”. The command is risky, because the essence of such jumps is to save us from the rebuild, but if you miss the initialization of the object and try to contact it, the program will fall.
We will stop our program on initializing the image, and we will not generally assign a picture to a cell, for this we need to skip five lines of code and return a cell without a picture, for this we skip the next five lines of code on the current thread, and continue the program:
It sounds pretty good, but I still want to assign a picture, let's add an assignment method to the breakpoint:
A successful combination, now we have only one type of picture in each cell.
Watchpoint
Another convenient feature in the debugger is tracking the values in the program, watchpoints. Watchpoint is somewhat similar to KVO, we set a breakpoint to change the state of an object, and every time it changes its state, the program execution process stops, and we can see the meaning and location, from where and by whom the value was changed. For example, I put a watchpoint on a cell to find out what happens when a table is scrolled through and a new cell is initialized. The list of commands turned out to be very large, so I’m not going to give it just to mention some: the execution of the layout view located inside the cell and the constraint, animation, state setting for the cell, and much more.
To set a watchpoint to a value, you must stop the execution of the breakpoint program in the scope of the properties you want to monitor, select a property in the “debug variable” panel and select watch “<parameter>”.
In order to remove a watchpoint from a variable, you need to look into the breakpoint navigator, and our watchpoint will be there along with the rest of the breakpoint.
Breakpoint UI Change
Sometimes we need to learn more about the object that we are trying to otdebezhit. The simplest option is to use “po” to display information about the object, and look at the location of the object in memory. But it happens that we do not have a direct link to the object, it is not represented in the API view, on which the library lies or is possibly hidden. One of the options to use View Hierarchy, but it is not always convenient and to understand that you have found the desired view is not always difficult. You can try using the command:
expression self.view.recursiveDescription() It is in Obj-C but in Swift it was removed because of the peculiarities of the language’s work, we cannot do it, but since Debuger works with Obj-C, in theory it can be fed to this command, and it will understand what you want from it . To execute Obj-C code, enter the following command in the console:
expression -l objc -O - - [`self.view` recursiveDescription] What do you see here? I see a rather uncomfortable construction, which could get used to over time, but we would rather not do this, but use typealias to simplify the command:
command alias poc expression -l objc -O — Now our team is reduced and simplified, but continues to do the work:
poc [`self.view` recursiveDescription] Will it work after closing Xcode or in another project? Unfortunately no. But it can be fixed! By creating a .lldbinit file and putting our alias there. If you do not know how, here is the instruction on the points:
1. Create a .lldbinit file (as a prototype, you can take .gitignore, it belongs to the same type of text invisible text files).
2. Write the following command in this file exactly:
command alias poc expression -l objc -O - - 3. Place the file in the folder “MacintoshHD / Users / <Here the name of your user is>”.
And so we got a description of all the views presented on the screen. Let's try to see what we can do with the address of objects in memory. For Swift, there is a method with a flaw here, all the time it is necessary to reduce the type of object in memory to a specific value:
po unsafeBitCast(0x105508410, to: UIImageView.self) Now we can see the position of our image in the cell, let's move it so that it is in the center of the cell and has an indent from the side of 20 px.
It happens that the change is not immediately noticeable, but it is necessary to remove the application from the debug in order to notice the change.
But if we want to see something similar in each cell, we need to speed up the execution of commands, we can write some scripts in Python that will work for us (how to add scripts you can see here www.raywenderlich.com/612-custom-lldb-commands-in- practice ), and if you know how to handle Python and want to write on it for lldb, then you need it.
I decided to write an extension for the UIView class, which will simply move the view in the right direction, it seemed to me that there would be fewer problems with connecting new scripts to LLDB and not difficult for any iOS programmer (otherwise you need to master Python for LLDB).
I did not begin to look for the place of the object in memory and bring it into the necessary class, which would then take the frame, it also takes too much time. The question was solved by writing a function in the UIView extension:
Unfortunately, it does not work well with cells, most likely due to the fact that at the time of the flush command execution, not all cell positions were calculated and it did not appear on the screen (we have not yet returned tableViewCell). It works fine with the other static elements.
Knowing the position of the view in the hierarchy, we can access it and change its position.
And now the opposite situation, when we can access the ViewHierarchy and want to get view data from there. In Xcode, it is possible to view the view hierarchy during program execution, as well as there you can view colors, location, types, and bindings to other objects, including. Let's try to access the constraints of our UIImageView.
To get data about constraint:
1. Click on the Debug View Hierarchy.
2. Turn on Clipped Content in the panel at the bottom of the screen that appears.
3. Enable Constraints on the same panel.
4. Select Contraint.
5. In the menu, click Edit -> Copy (Command + C).
6. The following binding is copied: ((NSLayoutConstraint *) 0x2838a39d0).
7. And now, just as we change it through the code, you can also change it in lldb:
expression [((NSLayoutConstraint *)0x2838a39d0) setConstant: 60]8. After clicking continue, the item will update its position on the screen.
In the same way, you can change colors, text and more:
expression [(UILabel *)0x102d0a260] setTextColor: UIColor.whiteColor] The demo project turned out to be too simple (60 lines of code in ViewController), most of the code I wrote is presented in the article, so there will be no difficulty in reproducing the test project.
PS: If you have any questions or comments please write. Check out WWDC and Debazh Pro.
I advise you to also read the materials:
Inspired by the Advanced Debugger WWDC 18 Session
Debugger Commands
Adding Python scripts to LLDB Xcode
Source: https://habr.com/ru/post/460779/
All Articles