How do the banks from the inside

It looks like the bank from the inside. This visualization in three stages is based on real client operations of the bank with a revoked license.
As a data source - the general ledger of the bank. Using graph theory, we single out all of its clients as nodes, and use account operations as edges. The amount of the operation, in this case, will be the weight of the edge.
The use of the Fruchterman-Rheingold algorithm in the next step allows us to improve the positions of neighboring nodes. A high estimate of the graph's modularity indicates a complex internal structure. This structure, often called a community structure, describes how a network is divided into subnets. These subnets are important in the real world.
')
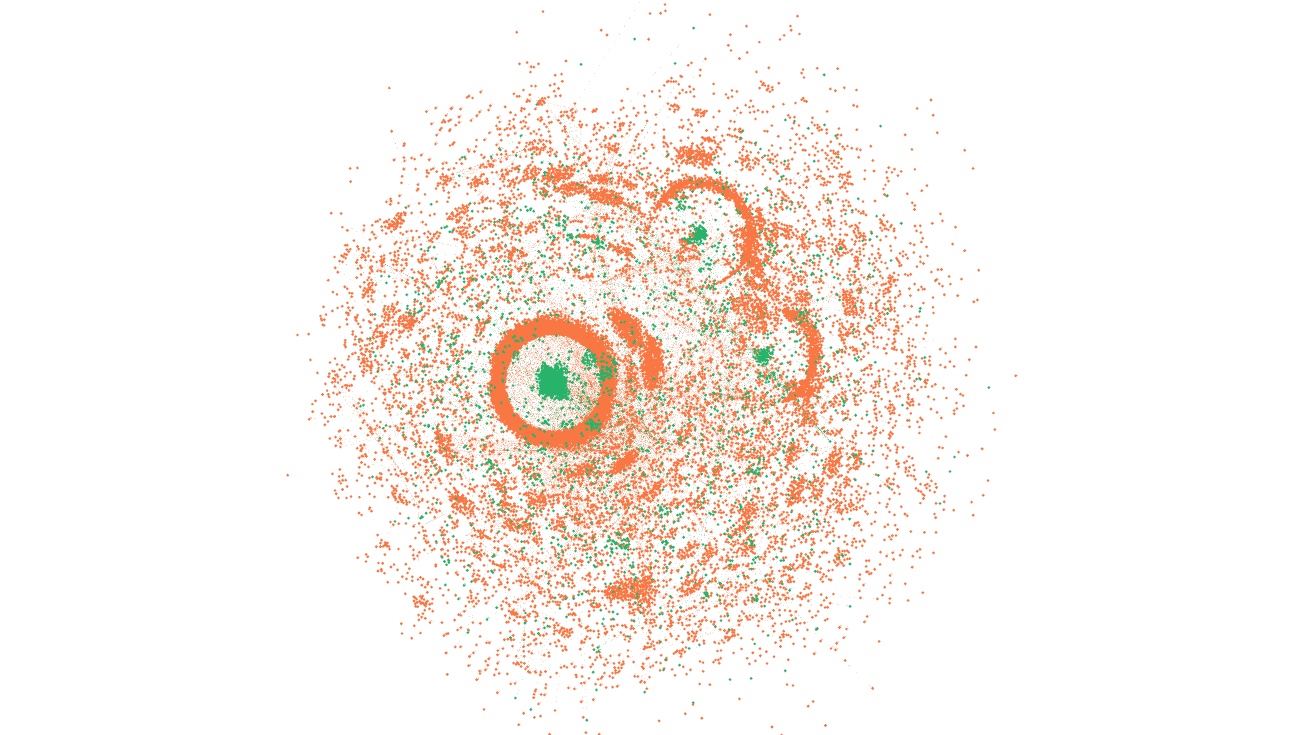
Filtering the graph on nodes with high modularity we get the so-called fan pattern, which is often used by attackers, for example, to realize the use of credit by bank borrowers. The fragmentation of operations into minimal amounts, the distribution of payments over a wide time horizon among a huge number of Bank customers is all in full view.
Clustered structures on visualization - evidence of human relationships. At the time of this kind, paintings in modern art museums can be represented as a form of expression of human ingenuity.
Source: https://habr.com/ru/post/460687/
All Articles