SVG download indicator on Vue.js
Hello! I study on the front-end, and in parallel, in an educational project, I develop a SPA on Vue.js for the back-end, which collects data from a search bot. The bot produces from 0 to 500 records, and I have to: load, sort by the given criteria, show in the table.
Neither the back-end nor the bot can sort the data, so I have to download all the data and process it on the browser side. Sorting is very fast, but the download speed depends on the connection, and the specified 500 entries can load from 10 to 40 seconds.
At first, when loading, I showed a spinner, the lack of which - the user does not know when the download will end. In my case, we know in advance the number of records that the bot found, so you can show how many% of the records are loaded.
To brighten up the user waiting, I decided to show him the boot process:
- in digits - how many% of the records have already been loaded
- schedule - load time for each record
- filling -% load. Since the graph fills a rectangular block as it loads, you can see which part of the block is left to fill.
Here is an animation of the result I was aiming for and received:
... I think it was funny.
In the article, I will show how to move to the result step by step. I didn’t draw charts of functions in the browser up to the village, so the development of the indicator brought me simple but new knowledge about the use of SVG and Vue.
Choosing how to draw a Canvas or SVG
I used Canvas in a simple snake game on JS, and SVG, in one project, I simply inserted into the page in the object tag and noticed that when scaling, SVG-pictures always kept their definition (that’s why it’s a vector) Blur image. Based on this observation, I decided to draw a graph using SVG, because I have to start sometime.
Work plan
Taking into account the chosen framework Vue, and the chosen method of image formation using SVG, I made the following work plan:
- Find and explore information on how to use SVG with Vue
- Experiments with shaping and modifying SVG in the context of Vue
- Prototype load indicator
- Selecting the load indicator in a separate Vue component
- SPA component application
Getting Started
- Creating a project blank
I have installed vue cli . To create a new project, I enter vue create loadprogresser in the command line, select the project settings, create a new vue project with the name loadprogresser, then remove the extra from it:
It was It became 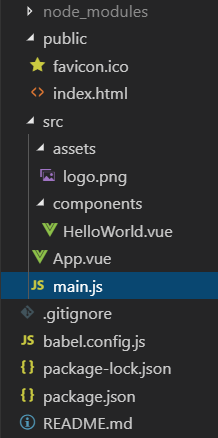
Project structure by default
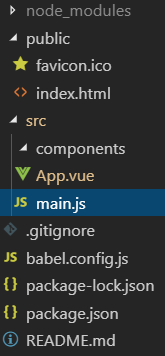
Structure after "cleaning"

Vue greeting
<template> <div> <h1>Progresser</h1> </div> </template> <script> export default {name: 'app'} </script>;My text “Progresser” in App.vue
Find and explore information on how to use SVG with Vue
Great site with useful info on HTML, CSS and SVG css.yoksel.ru A good example of SVG is placed in the documentation of the Vue SVG graph of Example itself and under such a reference . Based on these materials, a minimal component template with SVG was born with which I will start:
<template> <div class="wrapper"> <svg version="1.1" xmlns="http://www.w3.org/2000/svg" width="100%" height="100%"> //svg // svg- </svg> </div> </template>Experiments with shaping and modifying SVG in the context of Vue
Svg rect rect
rect is a rectangle, the simplest shape. I create a svg with dimensions of 100x100px, and draw a rectangle rect with initial coordinates of 25:25 and dimensions of 50x50 px, the default fill color is black (no styling)
SVG styling and hover pseudo class:
I will try to stylize rect rect in svg. To do this, I add the class “sample” to svg, in the style section of a vue file I add the styles .sample rect (color the rectangle with yellow color) and .sample rect: hover which stylizes the rect element when the mouse cursor is over it:
Source code<template> <div id="app"> <svg class="sample" version="1.1" xmlns="http://www.w3.org/2000/svg" width="100px" height="100px"> <rect x=25 y=25 width="50px" height="50px"/> </svg> </div> </template> <script> export default { name: 'app' } </script> <style> .sample rect { fill: yellow; stroke: green; stroke-width: 4; transition: all 350ms; } .sample rect:hover { fill: gray; } </style>JSfiddle implementationConclusion: svg is perfectly integrated into the template vue-file and styled with the specified styles. A start!
SVG path as the basis of the indicator
In this section, I will replace rect with path,
<path :d="D" class="path"/>in the d attribute of the path tag will pass from vue the string D with the coordinates of the path. Communication is made throughv-bind:d="D", which is abbreviated as:d="D"Line D = "M 0 0 0 50 50 50 50 0 Z" draws three lines with coordinates 0: 0-> 0: 50-> 50: 50-> 0:50 and closes the contour on command Z, forming a 50x50px square starting from Coordinate 0: 0. Using the “path” style, the shape is given a yellow color and a gray frame of 1px.
Yellow PATH source<template> <div id="app"> <svg class="sample" version="1.1" xmlns="http://www.w3.org/2000/svg" width="100px" height="100px"> <path :d="D" class="path"/> </svg> </div> </template> <script> export default { name: 'app', data(){ return { D:"M 0 0 0 50 50 50 50 0 Z" } } } </script> <style> .path { fill:yellow; stroke:gray; } </style>Prototype load indicator
In the minimal version, I made a simple diagram. In the template, an svg-container with a height of 100px, width 400px is inserted, inside the path tag is placed, to the attribute d of which I add the generated string-path d from the vue data, which in turn is formed from an array of timePoints where, every 10ms, one of 400 is added ( container width) a random number in the range from 0 to 100. Everything is simple, in the created life cycle hook, the update method is called in which new (random) points are added to the chart via the addTime method, then the getSVGTimePoints method returns the string to be transferred to the PATH, via setTimeout restarts update method
Learn more about string formation for PATH.
The string for the PATH is formed in the getSVGTimePoints method, from the timePoints array, which I process with the help of reduce. I use “M 0 0” as the initial value of reduce (start with the coordinate 0: 0). Further in reduce, new pairs of relative coordinates dX and dY will be added to the line. The fact that the coordinates are relative is answered by a capital letter “l” (a large “L” reports absolute coordinates), after “l” dX is placed and then dY, separated by spaces. In this prototype, dY = 1 (increment by 1px), further, along the X axis I will move with the increment dX calculated from the width of the container and the number of points that need to be placed in it. The last line of the formation of the PATH
path +=`L ${this.timePoints.length} 0`
I forcefully, from the last point, finish building the line to the X axis. If you need to close the contour, you can add “Z” to the end of the line, I initially thought that without a closed contour, the resulting figure will not be filled (fill), but it turned out wrong where not closed, the stroke will not be drawn.getSVGTimePoints:function(){ let predY = 0 let path = this.timePoints.reduce((str, item)=>{ let dY = item - predY predY = item return str + `l 1 ${dY} ` },'M 0 0 ') path +=`L ${this.timePoints.length} 0`// Z` return path },I will continue to make changes. My indicator should be scaled in width and height in order for all transferred points to fit into a given container. To do this, you need to contact the DOM and find out the size of the container
ref - getting information about the DOM element
DIV to the container (in which the svg is inserted) I add the wrapper class to pass the width and height through the styles. And so that svg occupied the entire space of the container, set its height and width to 100%. RECT, in turn, will also occupy the entire space of the container and will be the background for the PATH
<div id="app" class="wrapper" ref="loadprogresser"> <svg id="sample" version="1.1" xmlns="http://www.w3.org/2000/svg" width="100%" height="100%"> <rect x=0 y=0 width="100%" height="100%"/> <path :d="d" fill="transparent" stroke="black"/> </svg> </div>In order to find my DIV container in the virtual DOM Vue, I add the ref attribute and assign it the name by which I will perform the search
ref="loadprogresser". In the hook of the life cyclemountedI call the getScales () method, in which, by the stringconst {width, height} = this.$refs.loadprogresser.getBoundingClientRect()I recognize the width and height of the DIV element after it appears in the DOM.Further simple calculations are increments along the X axis depending on the width of the container and the number of points that we want to fit into it. The scale along the Y axis is recalculated every time when the maximum is found in the transmitted value.
transform - changing the coordinate system
At this stage, I notice that it would be necessary to change the coordinate system so that the 0: 0 coordinate starts from the bottom left corner, and the Y axis would grow up, not down. You can, of course, make calculations for each point, but in SVG there is a transform attribute that allows you to transform coordinates.
In my case, you need to apply a scale of -1 to the Y coordinates (so that the Y values are put up), and shift the origin to minus the height of the container. Since the height of the container can be any (specified via styles), we had to form a transformation string in the
mountedhook with the following code:this.transform = `scale( 1, -1) translate(0,${-this.wrapHeight})`But by itself, the transformation applied to the PATH does not work, for this you need to wrap the PATH into a group (g tag) to which and apply coordinate transformations:
<g :transform="transform"> <path :d="d" fill="transparent" stroke="black"/> </g>As a result, the coordinates are correctly deployed, the load indicator is closer to the intended design.
SVG text and text centering
The text is needed to display the% load. Placing text in the center vertically and horizontally in SVG is quite simple to organize (as compared to HTML / CSS), attributes come to the rescue (at once I prescribe values) dominant-baseline = "central" and text-anchor = "middle"
Text in SVG is output with the appropriate tag:
<text x="50%" y="50%" dominant-baseline="central" text-anchor="middle">{{TextPrc}}</text>where TextPrc is a binding to the corresponding variable, calculated by a simple ratio of the expected number of points to the transferred number of
this.TextPrc = `${((this.Samples * 100)/this.maxSamples) | 0} %`this.TextPrc = `${((this.Samples * 100)/this.maxSamples) | 0} %`.The coordinates of the beginning x = "50%" y = "50%" correspond to the center of the container, and for the fact that the text is aligned vertically and horizontally, the attributes dominant-baseline and text-anchor correspond.
The basic things on the topic have been worked out; now we need to isolate the prototype of the indicator into a separate component.
Selecting the load indicator in a separate Vue component
To begin with, I will determine the data that I will transfer to the component, these will be: maxSamples - the number of samples in 100% width, and Point - the data unit (point) that will be entered into the array of points (based on which, after processing, schedule). The data passed to the component from the parent, placed in the props section
props:{ maxSamples: {//- 100%- type: Number, default: 400 }, Point:{// value:0 } }Reactivity problems
For the fact that the new point transferred to the component will be processed, the computed property getPath which depends on the Point is responsible (and if it does, it is recalculated when the Point changes)
// ... <path :d="getPath"/> ... // props:{ ... Point:{ value:0 } // computed:{ getPath(){ this.addValue({value:this.Point.value}) return this.getSVGPoints()//this.d } },I first made a Point of type Number, which is logical, but then not all the points got into processing, but only different from the previous ones. For example, if only the number 10 from the parent is sent to such a Point, then only one point will be drawn on the graph, all subsequent points will be ignored since they do not differ from the previous ones.
Replacing the Point type with Number to the object {value: 0} led to the desired result - the computed property getPath () now processes each passed point, passing the point values via Point.value
Source component Progresser.vue<template> <div class="wrapper" ref="loadprogresser"> <svg class="wrapper__content" version="1.1" xmlns="http://www.w3.org/2000/svg" width="100%" height="100%" > <g :transform="transform"> <path :d="getPath"/> </g> <text x="50%" y="50%" dominant-baseline="central" text-anchor="middle"> {{TextPrc}} </text> </svg> </div> </template> <script> export default { props:{ maxSamples: {//- 100%- type: Number, default: 400 }, Point:{ value:0 } }, data(){ return { Samples:0,// wrapHeight:100,// maxY:0,// Y ( ) scales:{ w:1,// ( ) h:1 // //( Y ) }, Points:[],// ( Point.value) transform:'scale( 1, -1) translate(0,0)', TextPrc: '0%' } }, mounted: function(){ this.getScales() }, methods:{ getScales(){ const {width, height} = this.$refs.loadprogresser.getBoundingClientRect() //. this.scales.w = width / this.maxSamples // Y this.wrapHeight = height this.transform = `scale( 1, -1) translate(0,${-this.wrapHeight}) rotate(0)` }, getVScale(){// this.scales.h = (this.maxY == 0)? 0 : this.wrapHeight / this.maxY }, // getYMax({value = 0}){ this.maxY = (value > this.maxY) ? value : this.maxY }, addValue({value = 0}){ if (this.Samples < this.maxSamples) { this.getYMax({value}) this.getVScale() this.Points.push(value) // Int this.Samples ++; this.TextPrc = `${((this.Samples * 100)/this.maxSamples) | 0} %` } }, getSVGPoints(){ // Path let predY = 0 let path = this.Points.reduce((str, item)=>{ let dY = (item - predY) * this.scales.h predY = item return str + `l ${this.scales.w} ${dY} ` },'M 0 0 ') path +=`L ${this.Points.length * this.scales.w} 0 `// Z` return path }, }, computed:{ getPath(){ this.addValue({value:this.Point.value})// return this.getSVGPoints()//this.d - SVG PATH } } } </script> <style scoped> .wrapper { width: 400px;/* */ height: 100px;/* ( ) */ font-size: 4rem; font-weight: 600; border-left: 1px gray solid; border-right: 1px gray solid; overflow: hidden; } .wrapper__content path { opacity: 0.5; fill: lightgreen; stroke: green; stroke-width: 1; } .wrapper__content text { opacity: 0.5; } </style>Call from parent component and passing parameters
To work with a component, you need to import it into the parent component.
import Progresser from "./components/Progresser"
and announce in the sectioncomponents: {Progresser }In the template of the parent component, the progresser indicator component is inserted by the following construction:
<progresser class="progresser" :maxSamples = "SamplesInProgresser" :Point = "Point" ></progresser>Through the “progreser” class, the block sizes of the indicator are specified first. In the component props, maxSamples are transferred (max. Number of points in the graph) from the parent variable SamplesInProgresser, and the next point (as an object) is passed to the props Point from the object variable object parent. The parent's point is calculated in the update function, and is an increasing random number. I get this picture:
 Source of parent App.vue
<template> <div> <progresser class="progresser" :maxSamples = "SamplesInProgresser" :Point = "Point" ></progresser> </div> </template> <script> import Progresser from "./components/Progresser" export default { name: 'app', data(){ return { SamplesInProgresser:400,// - Point:{value:0},//"" index:0, // - TimeM:100 // } }, created: function () { this.update() }, methods:{ update(){ if (this.index < this.SamplesInProgresser) { this.index++; this.Point = {value:(this.TimeM*Math.random() | 0)} this.TimeM *= 1.01 setTimeout(this.update, 0) } } }, components: { Progresser } } </script> <style> #app { font-family: 'Avenir', Helvetica, Arial, sans-serif; margin-top: 60px; } /* */ .progresser { width: 300px; height: 80px; } </style>SPA component application
Getting down to what it was all about. And so, I have asynchronous operations for loading records from the database of certain personalities. The execution time of an asynchronous operation is not known in advance. I will measure the execution time in a banal way, using new Date (). GetTime () before and after the operation, and I will pass the resulting time difference to the component. Naturally, the indicator will be built into the block that will appear at the loading stage, and shade a table for which data is loaded.
async getCandidatesData(){ ... this.LoadRecords = true // , ... this.SamplesInProgresser = uris.length // ... for (let item of uris) {// uris URL try { const start = new Date().getTime()// candidate = await this.$store.dispatch('GET_CANDIDATE', item) const stop = new Date().getTime()// this.Point = {value:(stop-start)}// Point ...In the data component of the parent prescribe as for the load indication:
data (){ return { ... // LoadRecords:false, SamplesInProgresser:400, Point:{value:0} }And in the template:
<!-- --> <div class="wait_loading" v-show="LoadRecords"> <progresser class="progresser" :maxSamples = "SamplesInProgresser" :Point = "Point" ></progresser> </div>
findings
As predicted, nothing complicated. Up to a certain point, you can treat SVG as ordinary HTML tags, with its own specifics. SVG is a powerful tool that I will now more often use in my work for data visualization
Links
Load Indicator Source Code
Article on svg-path
')
Source: https://habr.com/ru/post/460399/
All Articles