Is there something in common with different hit songs?
If you sign in to Spotify.me , you can get a personalized summary of how Spotify understands you through the music you listen to on this Spotify site. That's cool!
I listen to a lot of music and enjoy working with data, so it inspired me to try analyzing my music collection.
I was very curious if there were any specific ingredients that made up the hit songs. What makes them cool? Why do we like hits, and do they have a certain “DNA”?
')
Task
This led me to try to answer two questions with the help of Spotify data:
- What does my music playlist look like?
- Are there specific audio attributes that are common to all hit songs?
Instruments
Fortunately, there are very simple tools that allow you to connect to Spotify, retrieve data, and then visualize it.
We will work with the Python 3 programming language , the Python Spotipy library, which allows you to connect to the Spotify Web API , and visualize the data using plot.ly and Seaborn .
Data array
At the end of each code, Spotify compiles a playlist of the 100 most frequently played songs. The dataset I used has already been posted on Kaggle: Top Spotify Tracks of 2018 . The list of the 100 most popular songs from Spotify seems like a reasonable array of data for studying hits, isn't it?
Let's get started!
First you need to create an account on developer.spotify.com . You can then directly access the Spotify Web API Console and start exploring the various API endpoints.
Note : The link to the code I used for the project is at the end of the post.
After connecting to the Spotify Web API, we will create a Spotify object using the Spotipy Python Library, which we will then use to send requests to the Spotify endpoint.
import spotipy from spotipy.oauth2 import SpotifyClientCredentials from spotipy import util cid =”Your-client-ID” secret = “Your-Secret” client_credentials_manager = SpotifyClientCredentials(client_id=cid, client_secret=secret) sp = spotipy.Spotify(client_credentials_manager=client_credentials_manager) Analyzing my playlist data
This is one of the most important stages in data science. Our goal here is to understand the type of music in my playlist, extract any interesting observations and compare them with the audio characteristics of hundreds of popular songs of 2018.
Artist frequency chart
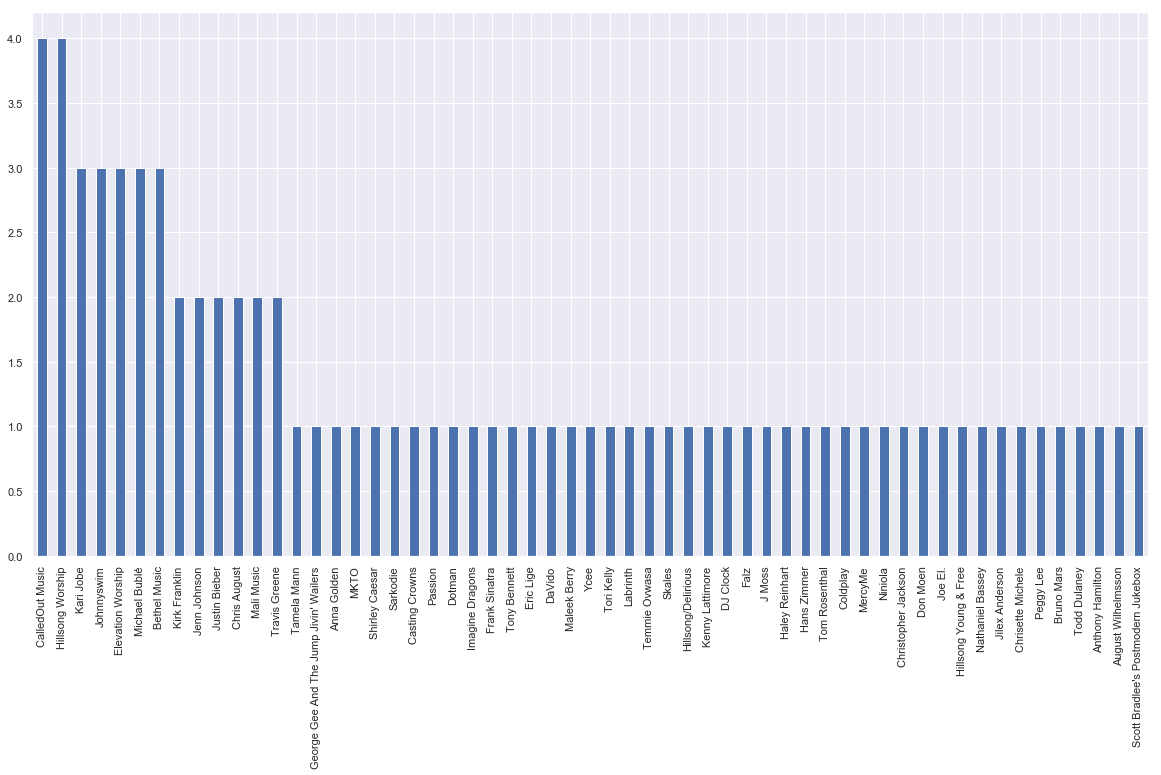
The frequency of the performers in my playlist
Having looked at this histogram, I can understand how often performers are found in one of my playlists.
Audio characteristics
Now let's take a look at the audio features of the songs in the playlist. Spotify has compiled a list of audio characteristics for each song on Spotify! Here is a brief description of the characteristics that we will use in this article:
Instrumentalness : predicts that there is no vocal on the track. In this context, “oy” and “aaaa” sounds are considered instrumental. Rap or tracks with words are obviously “vocal”. The closer the instrumental value is to 1.0, the higher is the likelihood that there is no voice in the track.
Energy (energy) : this is a value in the range from 0.0 to 1.0, which characterizes the criterion for the perception of "brightness" and "activity" of a song. Usually energetic compositions are quick, loud and noisy. For example, death metal has high energy, and Bach's prelude has a low score on this scale.
Acousticness : The measure of confidence that the composition is acoustic in the range of 0.0 to 1.0. A value of 1.0 means high confidence that the composition is acoustic.
Liveness (live performance) : recognizes the presence in the record listeners. The greater the value of liveness, the higher the likelihood that the song was performed live. A value above 0.8 gives serious confidence in live performance.
Speechiness (text) : Speechiness detects the presence of text in a song. If the speechiness of a composition is higher than 0.66, then it most likely consists of text, a value from 0.33 to 0.66 means that the song can contain both music and words, and a value below 0.33 means that there are no words in the song.
Danceability : Danceability describes the suitability of a dance track based on musical elements such as tempo, rhythm stability, power of beats, and general constancy. Songs with a value of 0.0 are the least danceable, with a value of 1.0 the most danceable.
Valence : this value in the range from 0.0 to 1.0 describes the musical positivity transmitted by the song. Songs with a high valence sound more positively (i.e., they convey happiness, joy, or euphoria), and perni with a low valence sound more negatively (i.e. they are sad, depressive, or angry).
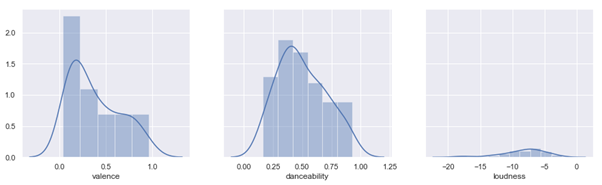
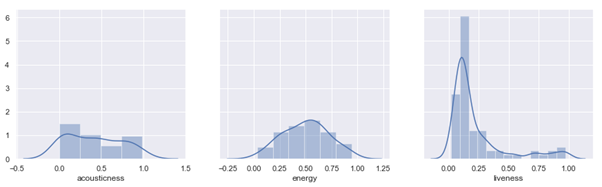
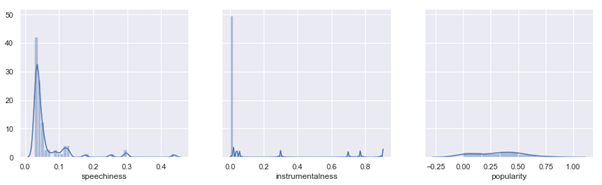
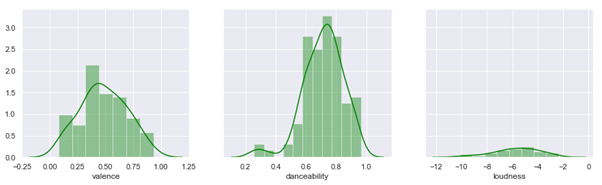
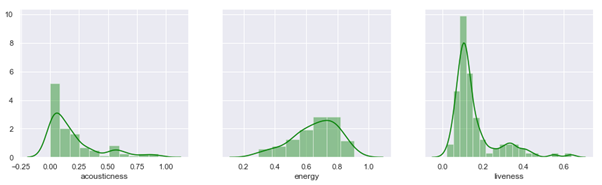
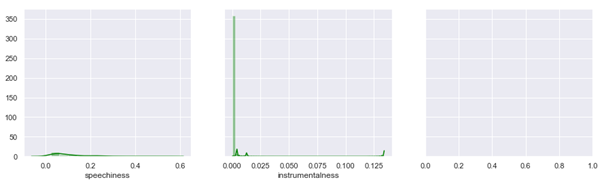
Distribution of musical styles in my playlist
Observation results:
- Most of the tracks in my playlist have a wide distribution of dance and there are not so many “happy” songs in it, which can be seen from the high frequency of tracks with values below 0.5 valence . So you can say that I like songs that you can dance to (and this is true!)
- On the chart there is a steep descent for speechiness, instrumentalness and a bit of liveness . This tells us that in the music from my playlist there are usually rarely words, there are few instrumental songs and songs played live.
- Acousticness is distributed approximately evenly between 0 and 1, that is, in this attribute I have no preferences. (I usually like acoustic songs, but I wouldn’t search for acoustic covers for each song).
- Finally, energy is normally distributed and has small tails at both ends, which means less chance of being added to my playlist. That is, in fact, I like medium-energy compositions.
- My songs are not so popular
Data Analysis Top 100 Songs 2018
After downloading and importing the dataset from Kaggle into my application, I began by analyzing the most popular artists, determined by the number of hits on this list.
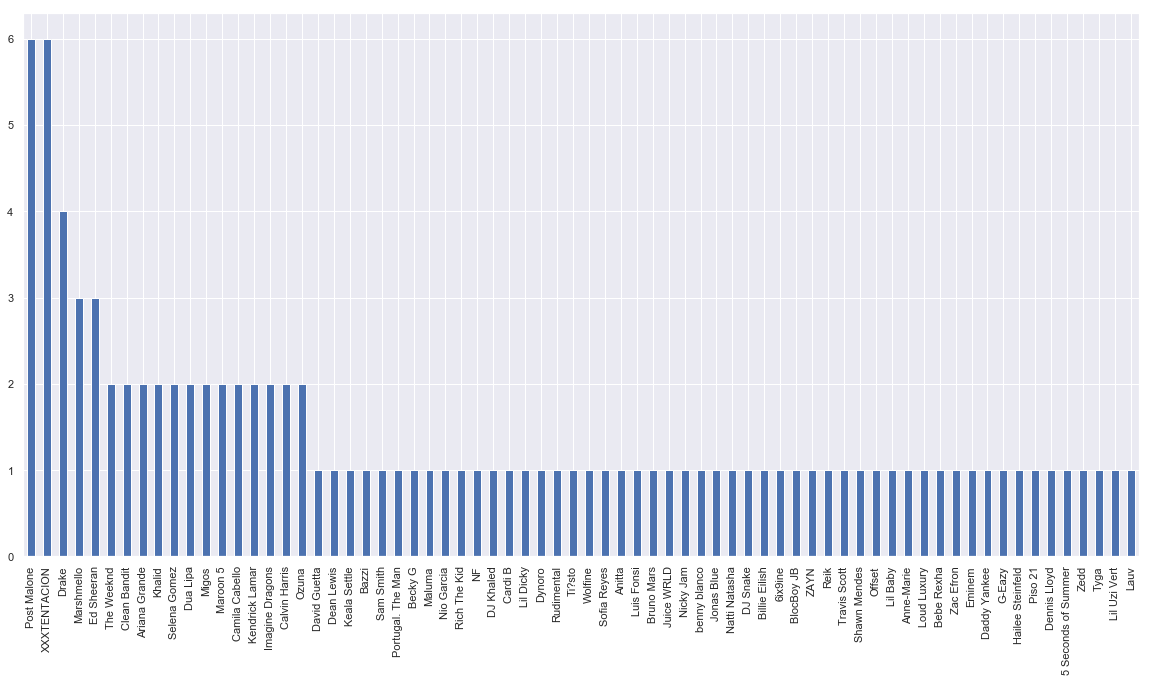
Artists in the Top 100 Songs of 2018 by frequency
Artists Most Common in Top 100 Songs 2018
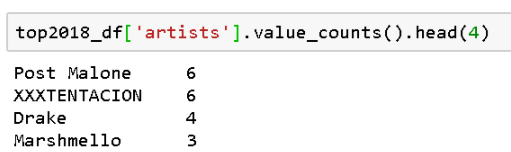
Code snippet
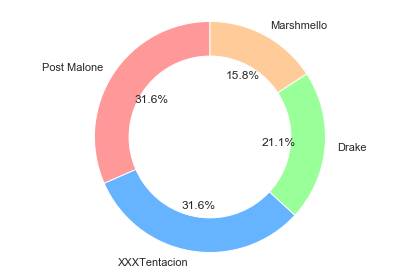


Post Malone and XXXTENTACION
Now let's explore the audio characteristics of the hundred most popular tracks in our dataset, and see how they look! We will create the same histogram as for my playlist so that you can compare them later.
The distribution of musical styles in the top 100 songs 2018
Looking at the histogram, we can see that the compositions of top 100 have the following characteristics:
- Very high dancing and energy, but low probability of live performance , availability of text and acoustic (we already see some signs that my playlist is not as cool as the top 100).
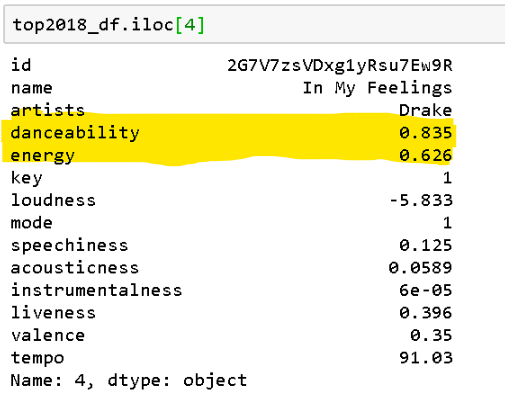
For example, the song “In My Feelings” by Drake from our data set has a high danceable and relatively high energy value.
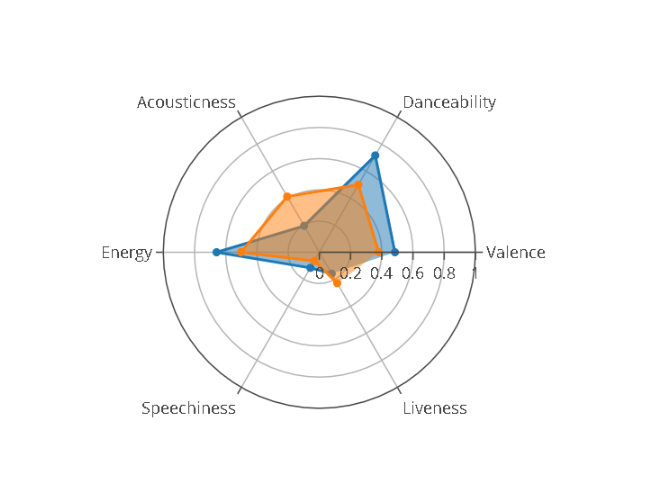
Finally, I decided to create a petal diagram of top 100 songs and impose on it the audio characteristics of my playlist.
The songs from Top 100 are shown in blue, and my songs in orange.
Conclusion
So, it seems, I have the answers to both questions from the beginning of the post. I managed to see what my music looks like and I found the DNA of the hit songs. The audio characteristics of my playlist are a bit like top 100, but I have more acoustic songs and less live performance.
Want to write a hit song? Make her danceable, with great energy and a bit of positivity.
I am satisfied with the results, but I want to continue research.
The code for the entire project is uploaded to GitHub .
Here is what I recommend to do next :
- Learn how you can use your playlist to determine personal preferences and recommended ads that you might like.
- Use the K-average machine learning clustering algorithm to find out which songs are similar to yours. So you can search for new songs that you might like.
- Use machine learning to predict the “popularity” of songs based on their audio characteristics.
Thanks to Alvin Chun , Ashrith, and John Koch for helpful articles on this topic. Spotify and Spotipy, thanks for the awesome API and library!
Source: https://habr.com/ru/post/460313/
All Articles