Interactive map of the subjects of Russia for a beginner. Errors that I made and which you should not allow
In this article I will tell you how we encountered typical errors when creating an interactive map, and most importantly, I will give you links to normal, relevant maps of the subjects of the Russian Federation.

Our task. Create an interactive map so that when you hover over a region, an event handler will trigger and display some data by region (for example, its name).
At first glance, this seems very simple, but later in the article I will tell you how we spent more than 3 days to fix, and most importantly - to identify bugs.
So, we begin the project. To begin, we need, in fact, the map itself: go to Google, we get a whole bunch of different formats of cartographic data.
Since we are not professional geoanalysts, we basically do not care about formats - the main thing is that it works, so we will not consider everything and everyone here, but single out two main groups.
- Vector cards
- Cards with metadata
Vector maps are a common vector polygon that repeats the shape of an object, for example, a country. The main format of this type of maps is SVG. And I will immediately tell you why it is bad for our project and why it should not be used at all in interactive maps. It's just a geometric shape with no data, even without a name. If you are not a masochist, then you will not manually attach an event handler to each polygon and manually enter all the information about the object, from acronyms in different languages to administrative status. If this can be done with the federal districts map, then at the district level you will simply die.
Cards with metadata. Maps with metadata, if in a very simple language, are the same vector polygons, only with information inside the box. There are a lot of formats, I will list the main ones: GeoJSON, SHP, GeoTIFF, MIF, TAB, KML. In general, there are many of them, each of them has its own characteristics, about which only a person knowledgeable in GIS systems can tell you.
This article discusses only GeoJSON due to the fact that the project decided to use only this format with metadata. All the maps below contain the name of the region, its description, population size, etc.
We figured out the format and look for data already with a specific extension. And here the fun begins. Do you think it is easy to find working good RF cards? Pff, not here it was, in front of you waiting for a lot of adventure. So, you downloaded the map, set it up, launched it and ...
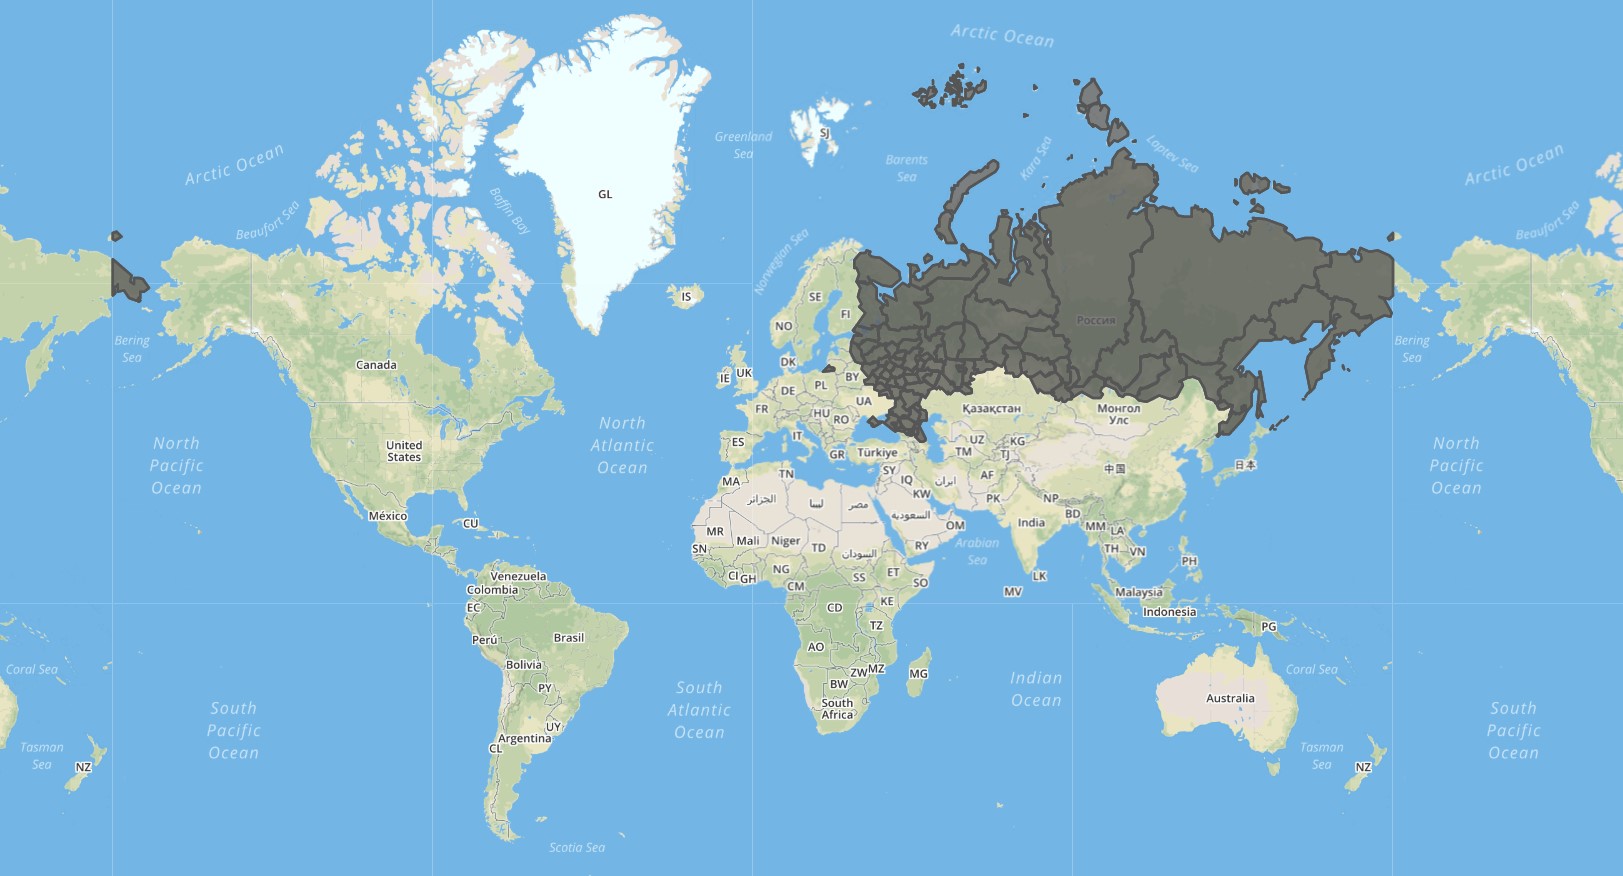
Crimea. The first links in Google lead you to gis-lab. And on these maps there is no peninsula. It's simple. The main Russian maps were made in 2000 and 2010, that is, before the inclusion of the Crimea in the Russian Federation, and many Western services do not recognize the accession and do not add the peninsula to their maps. And if you insert a map without Crimea in your project, being in Russia, you yourself understand what might happen. Therefore, to make a map without this territory is not an option.
Solution: Search for amateur card assemblies later than 2014 or foreign services that still add Crimea to Russian maps. But most likely you will not find them.
Go look further. We go to Google, we drive in “download geojson subjects of the Russian Federation”, we find, we download a map from mydata.biz and ... Everything is swollen.
Swam the border. In some maps, territorial waters are included in the subjects. Due to the fact that the territory of all the subjects bordering the sea is increased by 24 km, the map looks “floated”, especially regions with a coastline and islands. If you are unpretentious, you can probably use this card, but for my project this is totally unacceptable.
Decision. Search further maps without territorial waters.
Go ahead. In the depths of the Internet on an abandoned site you found maps, like with the Crimea and not “floated”, download and ...
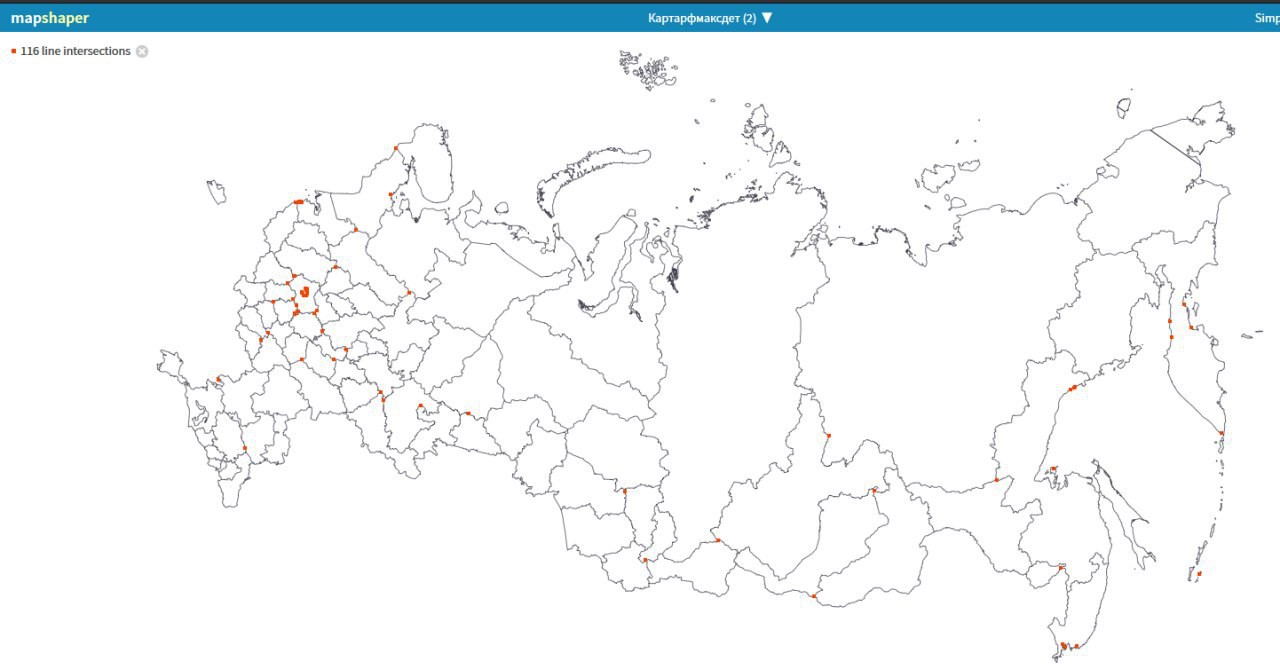
The boundaries of the subjects bump against each other.
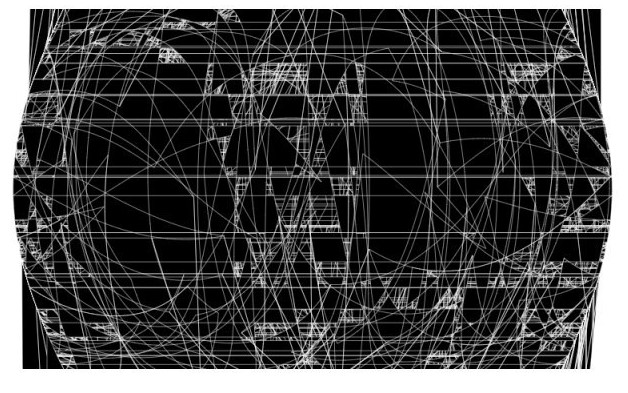
This problem is often found in amateur maps, the boundaries of subjects are bumping against each other and because of this, incorrect display of elements is possible. It may also appear due to improper compression or simplification of maps.
Red dots - the intersection of polygons on each other.
This does not always give artifacts in the display, but with a large number of errors, the following picture may occur:
Solution: Search for maps without colliding polygons with each other.
Looking further. Somewhere, by some miracle, you find a good map - with the Crimea, without territorial waters, without raids of polygons on each other and ...
Everything hangs up. The map weighs 35mb due to excessive detailing, and weak computers begin to slow down when displayed.
Solution: Search for a map with less detail or compress a map. For geojson I recommend mapshaper.org.
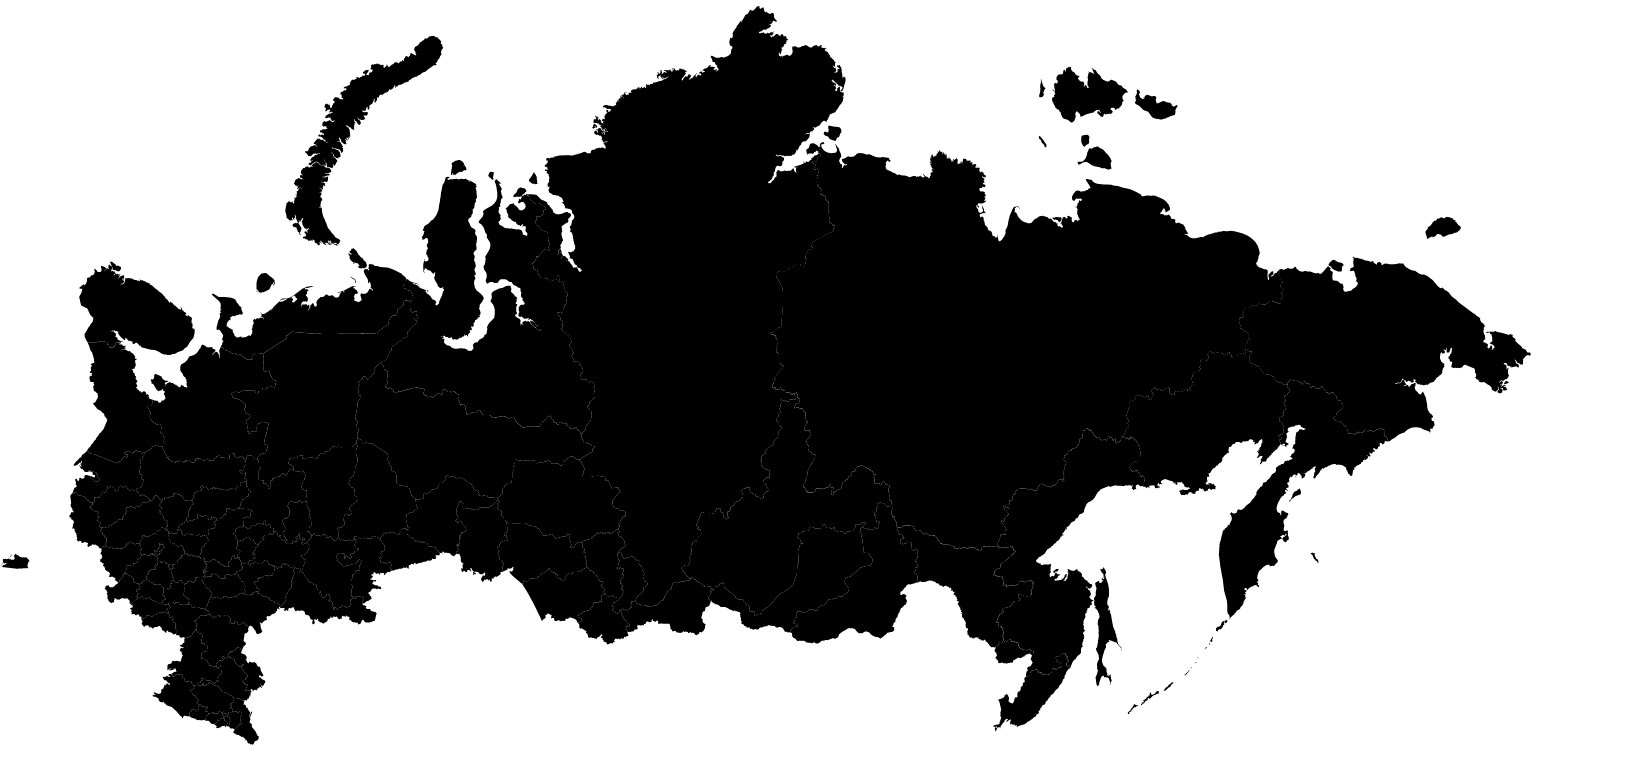
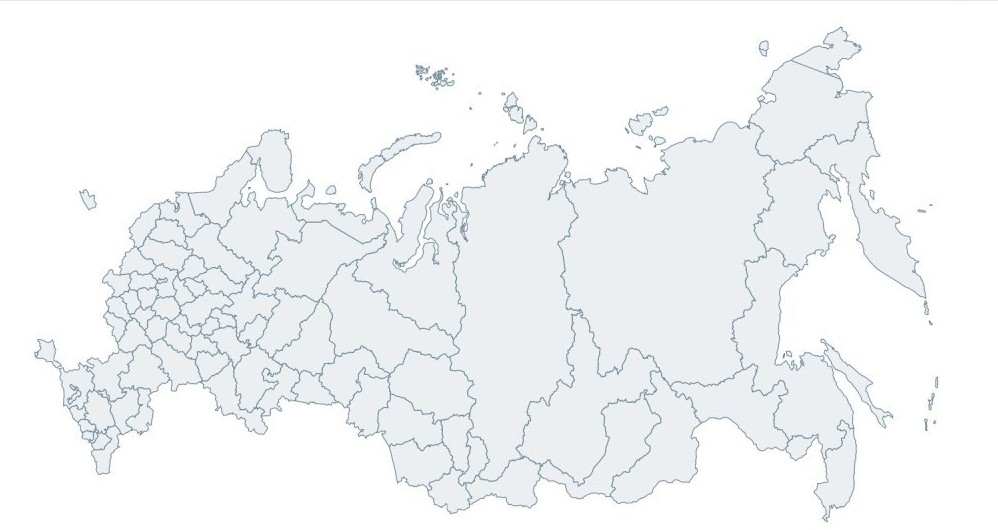
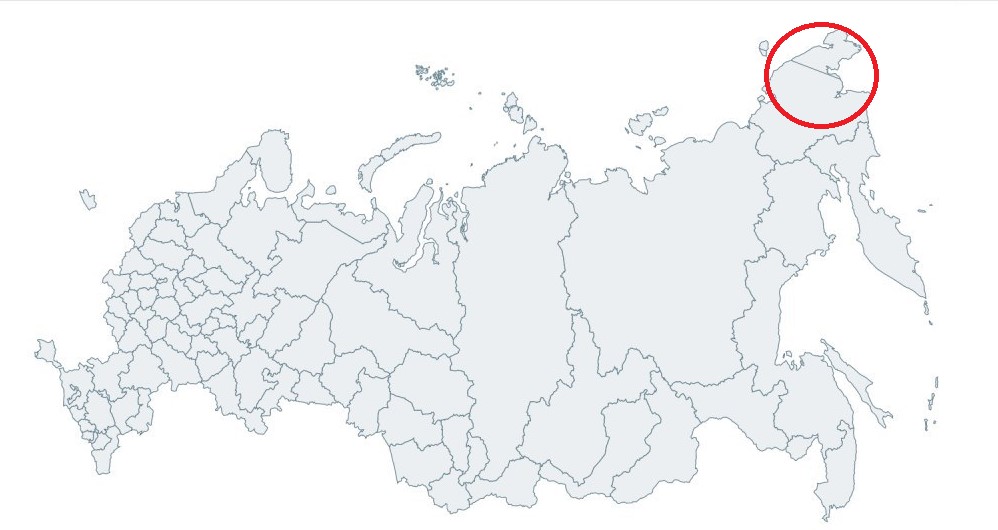
All, you went through nine circles of hell, found the perfect card, swing it and ... Part of Chukotka ideally cut off from the rest of Russia.
Chukotka Chukotka Chukotka This word is worth repeating many times, because if you are a beginner, you will be stuck with this problem for a long time. It will not be easy for you to understand that this is not a broken card, this is not a mistake, and this is not as easy to fix as it seems to you at first glance. You will not be able to cut off this piece and glue it to the rest of Russia, you will not be able to transfer all objects to the center without bugs, etc. And if it works, it will be terrible crutches, and we do not approve such methods.
Chukotka cut
I will not go into details, but immediately reveal the cards.
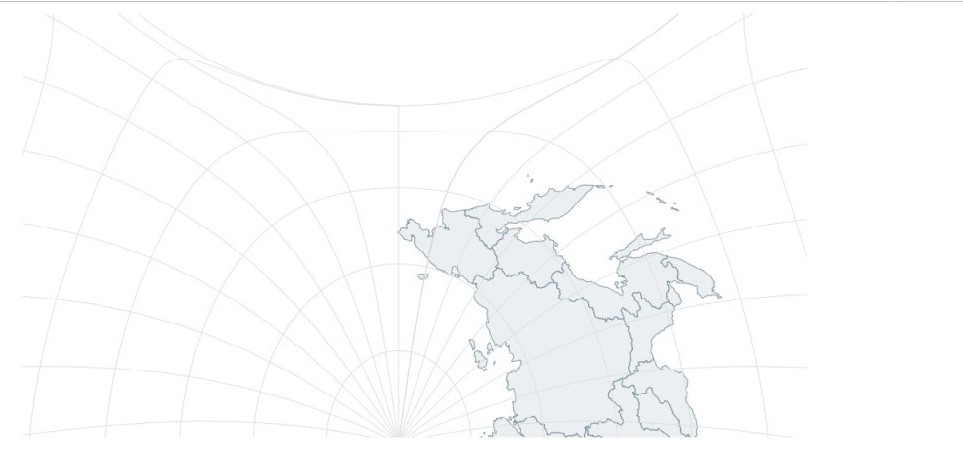
It's not a mistake. The thing is that by default in map services there is a projection (yes, you have to understand what a projection is and what they are) CRS84, which, roughly speaking, coordinates are from the 180th meridian, that is, the map starts and ends on Chukotka. Imagine that you are cutting and turning the globe along this line.
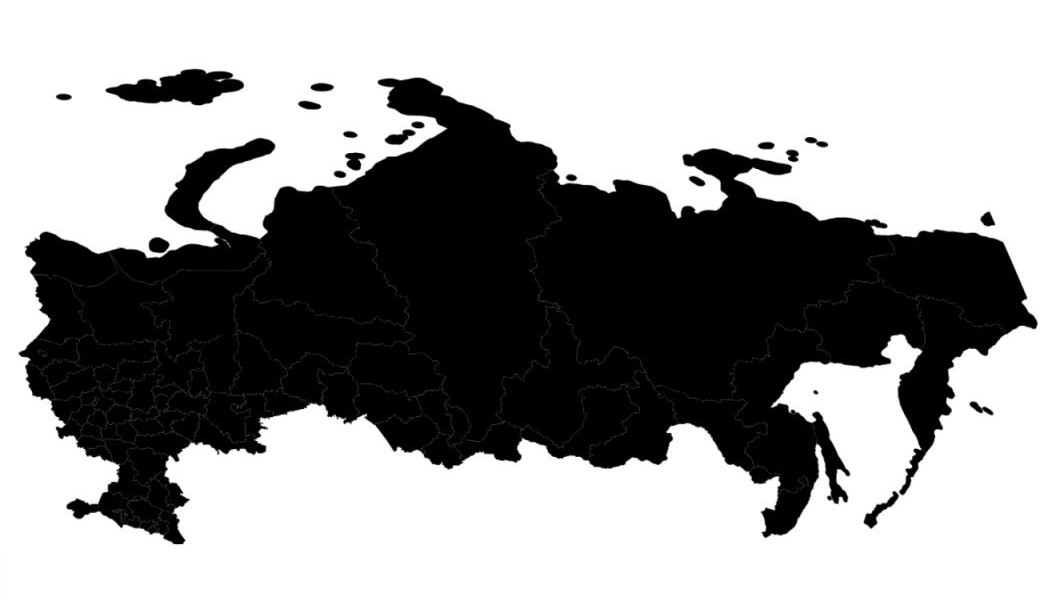
In terms of the CRS84 projection, everything is displayed correctly.
Projection is a huge and complex topic. I do not think that you need to spend a lot of time studying it, if you just need to make an interactive map in your project. Also, I will not chew in detail, but I will tell only about those projections that will help correctly display the map of the Russian Federation.
The projection of Asia lambert conformal conic will return Chukotka to its place. But, as I understand it, this is a non-standard projection and many services, for example, http://geojson.io , do not support a departure from the standard.
With Conic equal area projection, everything worked for us after a little refinement.
Putting a conic projection, you will see the following picture: Russia collapsed on its side and half drowned.
This is again not a bug - the map is correctly displayed, and by default it is such an angle. This is solved by a banal flip and zoom cards:
<ComposableMap projection={() => geoConicEqualArea() .scale(690) .center([100, 100]) .parallels([40, 80]) .rotate([265].translate([130, 5]) }> <ZoomableGroup> <Geographies geography={map}> {(geographies, proj) => geographies.map(geo => ( <Geography projection={proj} geography={geo} /> )) } </Geographies> </ZoomableGroup> </ComposableMap> As a result, you get this card:
... with which everything is good, she is without jambs and beautiful. Nearly. Nevertheless, there remains a “Chukchi scar” which we could not remove. It is not very noticeable and does not harm the composition. We did not find a way to remove it, and, to be honest, we didn’t look for it - we were too tortured by previous mistakes and decided to leave everything as it is.
So, we have disassembled the typical errors when designing an interactive map. If we had such an article a month ago, it would save a lot of nerves to our team and, I hope, save yours too.
We considered the following issues:
- Missing Crimea
- Subjects included territorial waters
- Subject boundaries bump against each other
- The card is too heavy
- Chukotka cuts 180 meridians
Note from the developer from the team
Another difficulty was to find a component for drawing maps, which will not depend on the client side, since The card is rendered on the server. We use the Next.js framework, which is based on React, so d3-geo just didn’t fit, we had to find a React component.
PS: The article is written only so that the young and the green, like we did not spend 2-3 days on torment with the cards, but learned from the mistakes of others. It is not written by a programmer, not a geoanalyst, not a cartographer, but a simple project, so I suggest writing all my complaints and inaccuracies to write my article in the Russian-language segment, where you explain in detail how to do it, since I did not find normal sources of information.
Cards:
For June 2019 the best Russian maps
A large bank of cards from around the world of average quality
Services:
Online map viewing and compression tool
projection
')
Source: https://habr.com/ru/post/459902/
All Articles