Epic Intelligence Intelligence Saga

At a certain stage of IS maturity, many companies are beginning to think about how to obtain and use information about cyber threats relevant to them. Depending on the industry-specific organization, different types of threats may be of interest. The approach to the use of such information was formed by Lockheed Martin in the material Intelligence Driven Defense .
The benefit now is that the IS services have a ton of sources to get them, and even a separate class of solutions - the Threat Intelligence Platform (TIP), which allows you to manage the processes of obtaining them, generating and integrating them into protection tools.
')
For us, as a center for monitoring and responding to information security incidents, it is extremely important that the information on cyber threats that we receive and generate is relevant, applicable and, importantly, manageable. After all, the security of organizations that entrust us with the protection of their infrastructure depends on it.
We decided to share our vision of TI in Jet CSIRT and talk about attempts to adapt various potentially useful approaches to managing cyber threats.
In cybersecurity, little works on the principle of set'n'forget. The firewall will not block packets until the filters are configured, IPS will not find signs of malicious activity in the traffic until it has loaded signatures on it, and SIEM does not begin to write correlation rules on its own and determine false positives. Threat Intelligence in this regard is no exception.
The complexity of implementing a solution that truly reflects the concept of Threat Intelligence is already in its very definition.
Threat Intelligence is the process of researching and analyzing certain sources of information in order to obtain and accumulate information about current cyber threats in order to take measures to enhance cybersecurity and raise the information security awareness of a certain security community .
Certain sources may include:
- Open sources of information. All that can be found using Google, Yandex, Bing and more specialized tools such as Shodan, Censys, nmap. The process of analyzing these sources is called Open Source Intelligence (OSINT). It should be noted that information obtained in the framework of OSINT comes from open (non-secret) sources. If the source is paid, it may not make it secret, which means that the analysis of such a source is also OSINT.
- Media. All that can be found in the media and on social platforms Sosial Media Intelligence (SOCMINT). This type of data retrieval, in essence, is part of OSINT.
- Closed sites and forums where details of upcoming cybercrime (deepweb, darknet) are discussed. Basically, in the shadow areas, you can extract information about DDoS attacks or the creation of a new malware, which hackers are trying to sell there.
- People who have access to information. "Colleagues in the shop" and people succumbing to methods of social engineering, are also sources who can share information.
There are more serious methods available only to specialized services. In this case, the data can come either from agents working under cover in cybercrime, or from people involved in cybercrime and cooperating with the investigation. In short, all this is called HUMan Intelligence (HUMINT). In Jet CSIRT we, of course, do not practice HUMINT.
Putting all these processes in a “box” that will work autonomously is impossible. Therefore, when it comes to solving TI, then, most likely, its main consumer value proposition is the very information about cyber threats and how to manage them, which the information security community receives in one form or another.
Cyber Threat Information
In 2015, MWR Infosecurity, together with CERT and the National Infrastructure Protection Center of the United Kingdom, published an information brochure highlighting 4 categories of information that are the result of the TI process. This classification is now applied everywhere:
- Operating. Information about upcoming and current cyber attacks, received, as a rule, by special services as a result of the HUMINT process or through wiretapping of the communication channels of intruders.
- Strategic. Information related to risk assessment for the organization to become a victim of cyber attack. They do not contain any technical information and can in no way be used on protective equipment.
- Tactical. Information about techniques, tactics, procedures (TTP) and tools that attackers use as part of a malicious campaign.Case in point is the recently opened LockerGoga
- Tool : cmd.exe.
- Technique : a crypto-fiber is launched that encrypts all files on the victim's computer (including Windows kernel files) using the AES algorithm in block (CTR) encryption with a key length of 128 bits. The file key and initialization vector (IV) are encrypted using the RSA-1024 algorithm using the MGF1 mask generation function (SHA-1). In turn, the OAEP filling scheme is used to increase the cryptographic strength of this function. The encrypted keys of the file and IV are then saved in the header of the encrypted file itself.
- Procedure : then the malware launches several parallel child processes, encrypting only every 80,000 bytes of each file, skipping the next 80,000 bytes to speed up encryption.
- Tactics : then requires a ransom in bitcoins for the key to decrypt the files back.
You can read more here .
Such information appears as a result of a thorough investigation of a malicious campaign, which can take quite a long time. The results of these studies are newsletters and reports from commercial companies such as Cisco Talos, FireEye, Symantec, Group-IB, Kaspersky GREAT, government organizations and regulators (FinCERT, NCTC, US-CERT, FS-ISAC), as well as independent researchers.
Tactical information can and should be applied to the means of protection and when building a network architecture.
- Technical. Information about the signs and entities of malicious activity, or about how to identify them.
For example, when analyzing malware, it was discovered that it is distributed as a .pdf file with the following parameters:
- name price_dekabr.pdf ,
- running the pureevil.exe process,
- having MD5 hash sum 81a284a2b84dde3230ff339415b0112a ,
- which tries to establish connections with the C & C server at 123.45.67.89 on TCP port 1337 .
In this example, the entities are the file and process names, the hash value, the server address, and the port number. Symptoms are the interaction of these entities with each other and infrastructure components: starting the process, outgoing network interaction with the server, changing registry keys, etc.
This information is closely related to the concept of “ Indicators of Compromise ” (Indicator of Compromise - IoC). Technically, as long as the entity is not found in the infrastructure, it still says nothing. But if, say, we find in the network the fact of attempts to connect the host to the C & C server at 123.45.67.89:1337 or start the process pureevil.exe , and even with an MD5 sum of 81a284a2b84dde3230ff339415b0112a , then this is an indicator of compromise.
That is, the indicator of compromise is a combination of certain entities, signs of malicious activity and contextual information, which requires a response from the information security services.
At the same time, in the field of information security, indicators of compromise are usually referred to as entities that were seen by someone in malicious activity (IP addresses, domain names, hash sums, URLs, file names, registry keys, etc.).
Detection of the indicator of compromise only signals that this fact should be paid attention to and analyzed to determine further actions. It is strictly not recommended to instantly block the indicator on the GIS without clarifying all the circumstances. But we'll talk about that later.
Indicators of compromise are also conveniently divided into:
- Atomic. They contain only one sign that cannot be divided further, for example:
- The IP address of the C & C server is 123.45.67.89
- The hash sum is 81a284a2b84dde3230ff339415b0112a
- Composite. They contain two or more entities seen in malicious activity, for example:
- Socket 123.45.67.89:5900
- The file price_dekabr.pdf will spam the process pureevil.exe with the hash sum 81a284a2b84dde3230ff339415b0112a
Obviously, the detection of a composite indicator is more likely to indicate a compromise of the system.
Technical entities can also include various entities for detecting and blocking indicators of compromise, for example, Yara-rules, correlation rules for SIEM, various kinds of signatures for detecting attacks and malware. Thus, technical information can be unambiguously applied on the means of protection.
Problems of effective use of technical information TI
The quickest TI service providers can get exactly technical information about cyber threats, and how to use them is entirely a question for the consumer. This is where most of the problems lie.
For example, indicators of compromise can be applied at several stages of response to an information security incident:
- at the preparation stage (Preparation), proactively blocking the indicator on the GIS (of course, after excluding false-positive);
- at the stage of detection, tracking the operation of the rules for identifying the indicator in real time by means of monitoring (SIEM, SIM, LM);
- at the incident investigation stage, using the indicator in retrospective checks;
- at the stage of more in-depth analysis of affected assets, for example, when analyzing the source code of a malicious sample.
The more manual work involved at a particular stage, the more analytics (enriching the essence of the indicator with contextual information) will be needed from suppliers of indicators of compromise. In this case, we are talking about external contextual information, that is, what is already known to others about this indicator.
Usually indicators of compromise are delivered in the form of so-called threat feeds or streams. This is such a structured list of threat data in various formats.
For example, below is a malicious hash feed in json format:

This is an example of a good context-rich feed:
- contains a link to threat analysis;
- name, type and category of threat;
- publication time stamp.
All this allows you to control the indicators of compromise from this feed when you load on information protection and monitoring tools, and also reduces the time to analyze incidents that worked on them.
But there are feeds and other quality (as a rule, open source). For example, the following is an example of addresses of supposedly C & C servers from one open source:
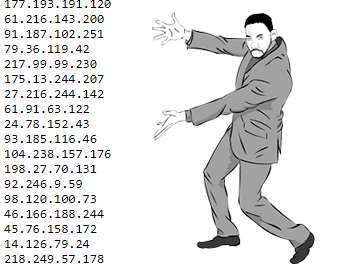
As you can see, contextual information is completely missing here. Any of these IP-addresses can host a legitimate service, some can be Yandex or Google crawlers, indexing sites. We can not say anything about this list.
The lack or inadequacy of the context in threat feeds is one of the main problems for consumers of technical information. Without context, the entity from the feed is not applicable and, in fact, is not an indicator of compromise. In other words, blocking any IP address on GIS, as well as downloading this feed to monitoring tools, is likely to result in a large number of false positives (false positive - FP).
If we consider the use of indicators of compromise from the point of view of detection on monitoring tools, then this process is simplified as a sequence:
- indicator integration into monitoring tools;
- triggering an indicator detection rule;
- analysis of the service information security.
Due to the presence of a human resource in this sequence, we are interested in analyzing only those cases of identifying indicators that truly indicate a threat to the organization and reducing the number of FPs.
Basically, false positive triggers cause the detection of the essence of popular resources (Google, Microsoft, Yandex, Adobe, etc.) as potentially malicious.
A simple example: a malware is investigated, which has fallen on a host. It is discovered that it checks for Internet access by polling update.googleapis.com . The resource update.googleapis.com is entered into the threat feed as an indicator of compromise and causes FP. Similarly, the feed can get the hash sum of a legitimate library or file used by malware, public DNS addresses, addresses of various browsers and spiders, CRL (Certificate Revocation List) certificate revocation and URL shortening resources (bit.ly, goo. gl, etc.).
Verification of this kind of operation, not enriched by the external context, can take a considerable amount of analyst time, during which the actual incident can be missed.
By the way, there are also indicator feeds that can trigger FP. One such example is the resource misplacinglist .
Prioritization of compromise indicators
Another problem is the prioritization of positives. Relatively speaking, what kind of SLA we will have when detecting a particular indicator of compromise. After all, suppliers of threat feeds do not prioritize the entities that they contain. To help the consumer, they can add a degree of confidence in the harmfulness of a particular entity, as is done in the feeds from Kaspersky Lab:

However, prioritizing the events of identifying indicators is the task of the consumer.
To address this issue in Jet CSIRT, we adapted the approach outlined by Ryan Kazanciyan at COUNTERMEASURE 2016. Its essence is that all indicators of compromise that can be found in the infrastructure are considered from the point of view of belonging to system domains and data domains .
Data domains are in 3 categories:
- Real-Time activity at the source (what it currently stores in memory; detected by means of analyzing information security events in real time):
- running processes, changing registry keys, creating files;
- network activity, active connections;
- other events just generated.
If an indicator of this category is found, the time for response from the information security services is minimal . - Historical activity (what has already happened; it is found during retrospective checks):
- historical logs;
- telemetry;
- triggered alerts.
If an indicator of this category is found, the time for reaction from the information security services is admissible limited . - Data that is at rest (what has already happened before we connected the source to the monitoring; it is found out as part of retrospective checks of the long-unused sources):
- files that have long been stored on the source;
- registry keys;
- other unused objects.
If an indicator of this category is found, the time for reaction from the IS services is limited by the duration of the full investigation of the incident .
Usually, on the fact of such investigations, detailed reports and bulletins are prepared with an analysis of the actions of intruders, but the relevance of such data is relatively small.
That is , data domains are the state of the analyzed data, at which the indicator of compromise was detected.
System domains are the origin of the indicator of compromise to one of the infrastructure subsystems:
- Workstations. Sources used directly by the user to perform daily work: AWP, laptops, tablets, smart phones, terminals (VoIP, VC, IM), application programs (CRM, ERP, etc.).
- Servers. This refers to the rest of the devices serving (serve) the infrastructure, i.e. IT complex-enabled devices: GIS (FW, IDS / IPS, AV, EDR, DLP), network devices, file / web / proxy servers, storage systems, access control systems, env. environments etc.

By combining this information with the composition of the indicators of the compromise indicator (atom, composite) , depending on the allowable reaction time, it is possible to form an incident priority when it is detected:
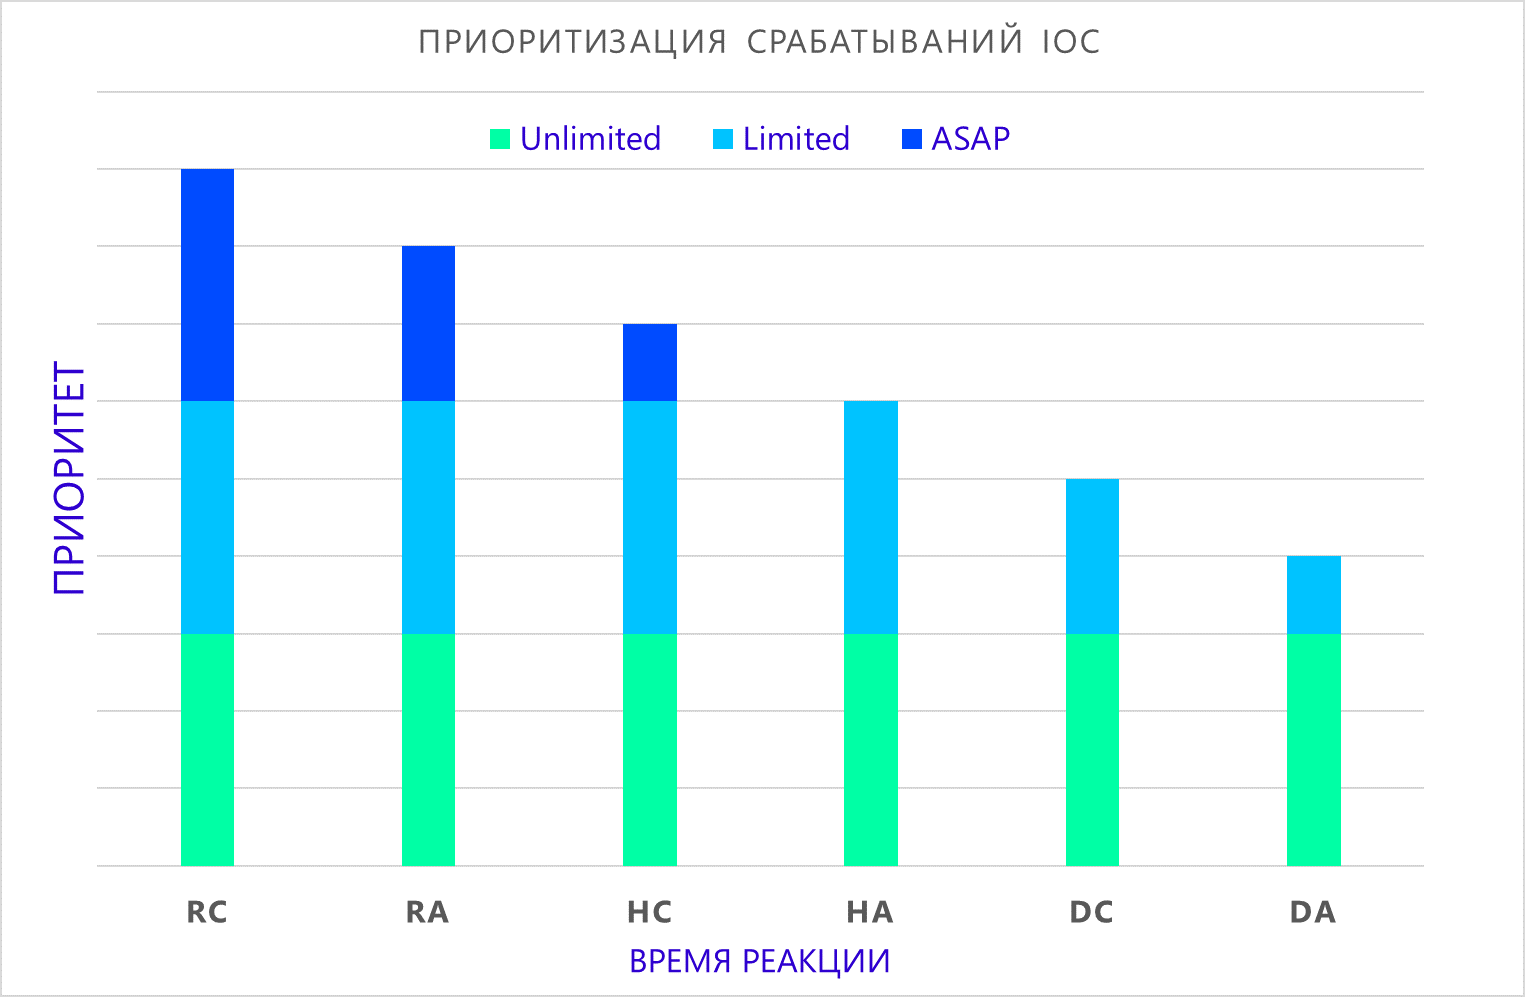
- ASAP . Detection of the indicator requires immediate response from the response team.
- Limited . Detection of the indicator requires additional analysis to clarify the circumstances of the incident and decide on further actions.
- Unlimited . Detection of the indicator requires a thorough investigation and preparation of a report on the activities of intruders. Typically, such finds are investigated within the framework of forensics, which can last for years.
Where:
- RC - real-time composite indicator detection;
- RA - real-time atomic indicator detection;
- HC - detection of a composite indicator as part of a retrospective verification;
- HA — detection of an atomic indicator as part of retrospective verification;
- DC - detection of a composite indicator in long-unused sources;
- DA - detection of an atomic indicator in long-unused sources.
It must be said that the priority does not diminish the importance of detecting the indicator, but rather shows the approximate time that we have to prevent possible compromise of the infrastructure.
It is also fair to note that such an approach cannot be used in isolation from the observed infrastructure, we will return to this.
Monitoring the lifetime of indicators of compromise
There are some malicious entities that leave the compromise indicator forever. It is not recommended to delete such information, even after a long period of time. This often becomes relevant when retrospective checks (HC / HA) and when checking for a long time unused sources (DC / DA) .
Some monitoring centers and suppliers of indicators of compromise consider it unnecessary to monitor the lifetime in general for all indicators. However, in practice, this approach becomes ineffective.
Indeed, indicators of compromise, such as the hash sums of malicious files, registry keys created by the malware, and URLs through which a node is infected, will never become legitimate entities, i.e. their validity is not limited.
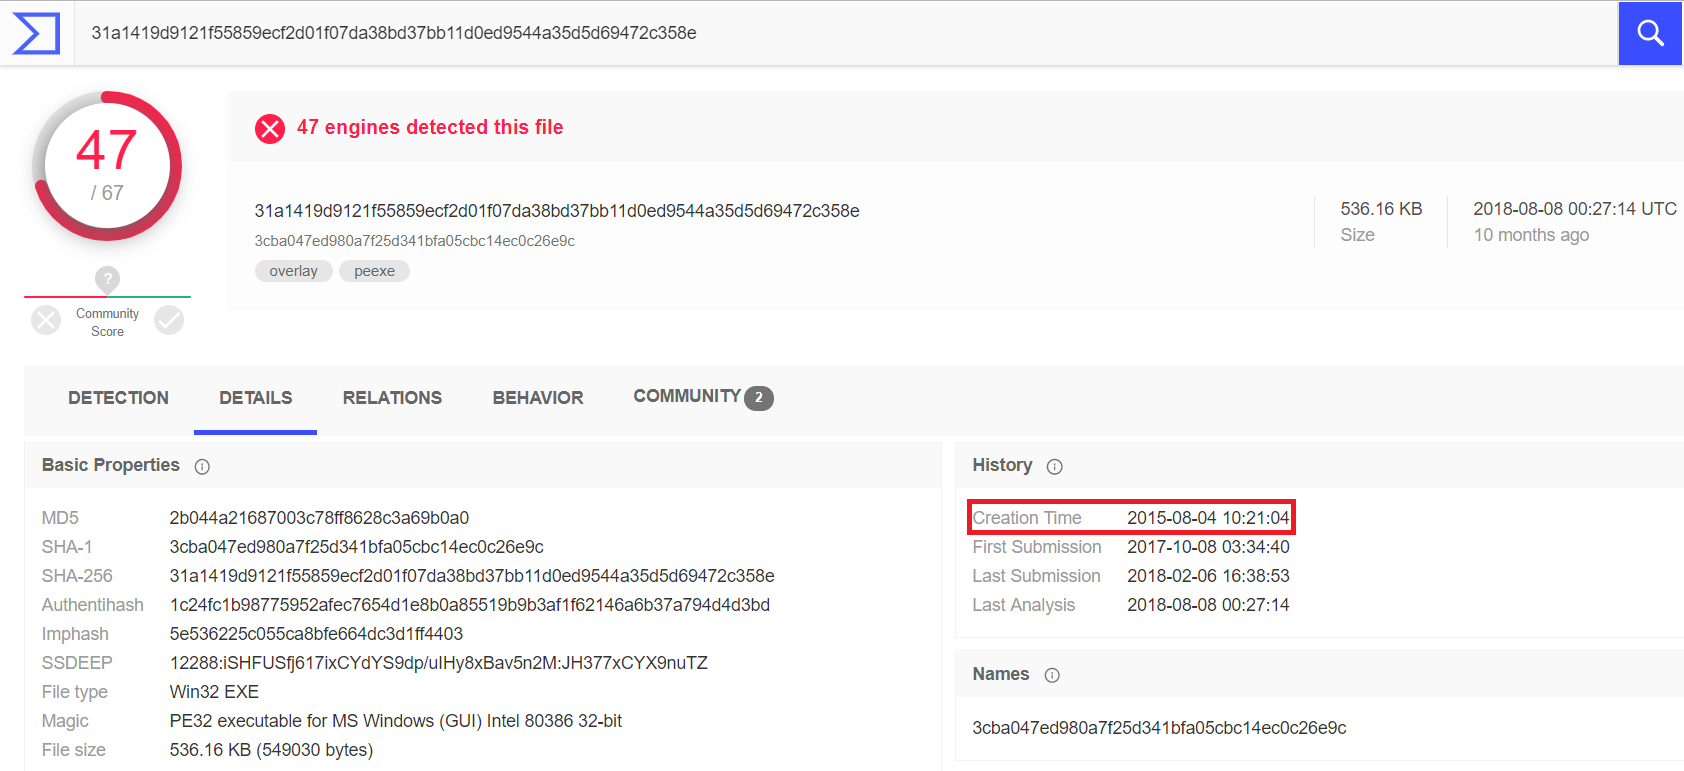
An illustrative example: SHA-256 analysis of the sum of a Vermin RAT file with an encapsulated SOAP protocol for exchanging data with a C & C server. The analysis shows that the file was created in 2015. We recently found it on one of our client’s file servers.
However, a completely different picture will be with the type of entities that were created or “borrowed” for a time for a malicious campaign. That is, in fact, being endpoints under control of intruders.
Such entities may become legitimate again after their owners clear the compromised nodes, or when the attackers stop using the next infrastructure.
Taking into account these factors, it is possible to build an approximate table of indicators of compromise with reference to data domains, the period of their relevance and the need to control their life cycle:
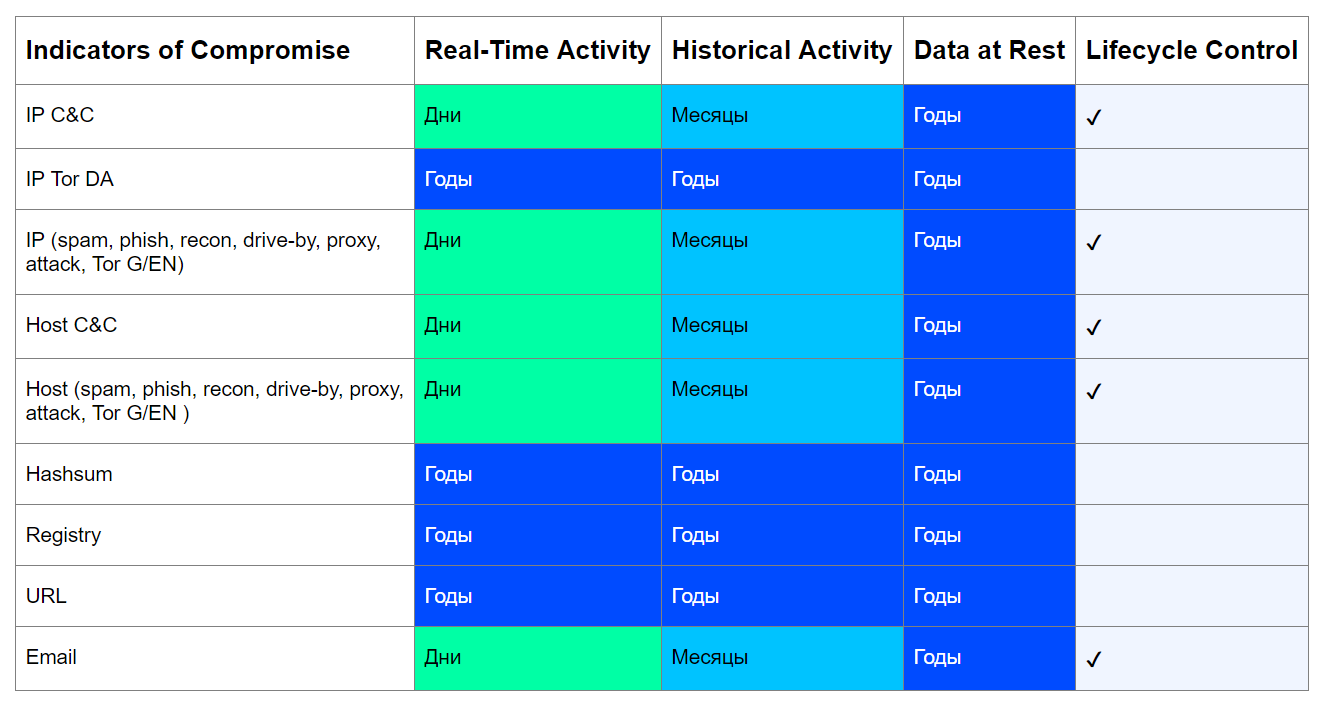
The task of this table is to answer three questions:
- Can this indicator become legitimate over time?
- What is the minimum period of relevance of the indicator depending on the state of the analyzed data?
- Do I need to control the lifetime of this indicator?
Consider this approach on the example of IP C & C-server. Today, attackers prefer to raise the distributed infrastructure, often changing addresses, to go unnoticed and to avoid possible blockages from the provider. In this case, C & C is often deployed on hacked nodes, as, for example, in the case of Emotet . However, botnets are eliminated, villains are caught, so an indicator such as the IP address of a C & C server can definitely become a legitimate entity, which means its lifespan can be monitored.
If we find calls to the C & C-server IP in real time (RA / RC), then the period of its relevance for us will be calculated in days. After all, it is unlikely the next day after the discovery of this address will no longer host C & C.
Detection of such an indicator in retrospective checks (HA / HC), which usually have longer intervals (once every few weeks / months), will also indicate a minimum period of relevance equal to the corresponding interval. At the same time, C & C itself may no longer be active, but if we find in our infrastructure the fact of circulation, then the indicator will be relevant for us.
The same logic applies to other types of indicators. The exceptions are the hash sums, registry keys, the Directory Authority (DA) of the Tor network nodes and the URL.
With hashes and registry values, everything is simple - they cannot be removed from nature, therefore, it does not make sense to control their lifespan. But malicious URLs can be deleted, they will certainly not become legitimate, but they will be inactive. However, they are also unique and are created specifically for a malicious campaign, so they cannot become legitimate.
DA's IP addresses on the Tor network are well known and unchanged, their lifespan is limited only by the life span of the Tor network itself, so these indicators are always relevant.
As can be seen, for most types of indicators from the table, the control of their lifetime is necessary.
We at Jet CSIRT advocate this approach for the following reasons.
- Entities that once were indicators of compromise may eventually begin to host any service with which you may need to work.
For example, Microsoft, through a court, achieved control over the 99 domains that the APT35 grouping previously used. After some time, Microsoft may begin to use these domain names for legal purposes.
Another example is the letters from the IP addresses of companies that have been hacked and used in spam mailings. The consequences of hacking can be eliminated long ago, but since their IP address is listed as “spammer”, letters from employees of such a company will automatically be sent to folders where they may go unnoticed. - Monitoring the lifetime of compromise indicators helps to reduce the load on an SZI that blocks.
The ever-increasing volume of new blocking rules negatively affects the performance of the GIS and, therefore, threatens a critical element that should protect the infrastructure. - The growing volume of threats will force the community to control the indicators used.
Every year there are millions of new threats that leave indicators of compromise. Just add 1 character to any MS Office document, and it will already have a completely different hash sum, but we may never meet this file in other attacks. The increasing volume of new indicators will ultimately force us to decide which indicators need to continue to be exploited and which ones can be written off, and their relevance will be a decisive factor in this.
That is why we consider it important now to strive to adapt processes and develop approaches to controlling the lifetime of indicators that are integrated into protective equipment.
One such approach is described in the Decaying Indicators of Compromise of the Computer Incident Response Center of Luxembourg (CIRCL), whose employees created a platform for sharing information about threats to MISP . It is in MISP that it is planned to apply ideas from this material. To this end, the project’s repositories have already opened the corresponding branch , which once again proves the urgency of this problem for the information security community.
This approach assumes that the lifetime of some indicators is not homogeneous and may change as:
- attackers stop using their infrastructure in cyber attacks;
- about cyber attack learns more and more information security specialists and brings indicators into the block on SZI, forcing intruders to change the elements used.
Thus, the lifetime of such indicators can be described as a function that characterizes the rate at which each indicator has a shelf life over time.
Colleagues from CIRCL build their model using the conditions used in MISP, however, the general idea of the model can be used outside their product:
- The compromise indicator (a) is assigned a baseline estimate ( ), which lies in the range from 0 to 100;
In the CIRCL material, it is taken into account reliability / confidence in the indicator provider and associated taxonomies. At the same time, if the indicator is re-detected, the base score may change - increase or decrease, depending on the supplier's algorithms.
- Time is entered at which his total score should = 0;
- Introduces the concept of the rate of release of the shelf life of the indicator (decay_rate) , which characterizes the rate of decline in the overall assessment of the indicator over time;
- Timestamps are entered. and , characterizing respectively the current time and the time when the indicator was last seen.
Considering all the above conditions, the colleagues from the CIRCL give the following formula for calculating the overall score (1):
Where,
Parameter it is proposed to count as ,
Where,
- time of the first detection of the indicator;
- time of the last detection of the indicator;
- the maximum time between two detections of the indicator.
The idea is that when the score is = 0, then the corresponding indicator can be withdrawn.
According to our data, some suppliers of threat feeds implement other methodologies for monitoring the relevance and filtering of indicators of compromise used at the preventive level. However, most of these techniques are quite simple.
We tried to apply the algorithm from the CIRCL material to the indicators that were detected at the detection stage and applied as blocking rules on the GIS in the process of response and post-incident activity.
Obviously, such an approach can only be applied to those types of indicators for which . The CIRCL material gives an example of the so-called grace time — a fixed time for correction, which the provider gives to the owner of the resource seen in suspicious activity before disconnecting the resource. But for most types of indicators still unknown.
Unfortunately, we cannot accurately predict the time when a certain entity will become legitimate. However, we almost always (from the supplier of the indicator or from the analysis of open sources) have information about when this entity was detected for the first and last time, as well as some semblance of a baseline assessment. Thus, only one variable separates us from when it is possible to write off an indicator according to the CIRCL material - decay_rate. However, it is not enough just to make it permanent for all indicators, and more importantly, for all infrastructures.
Therefore, we tried to tie each type of indicator for which life cycle control is possible to its expiration rate (decay_rate), type of observed infrastructure and its level of maturity of information security.
By taking an inventory of a specific protected infrastructure, figuring out the age of the software and hardware that it uses, we determine the decay_rate for each type of compromise indicators. The approximate result of such work can be presented in the form of a table:
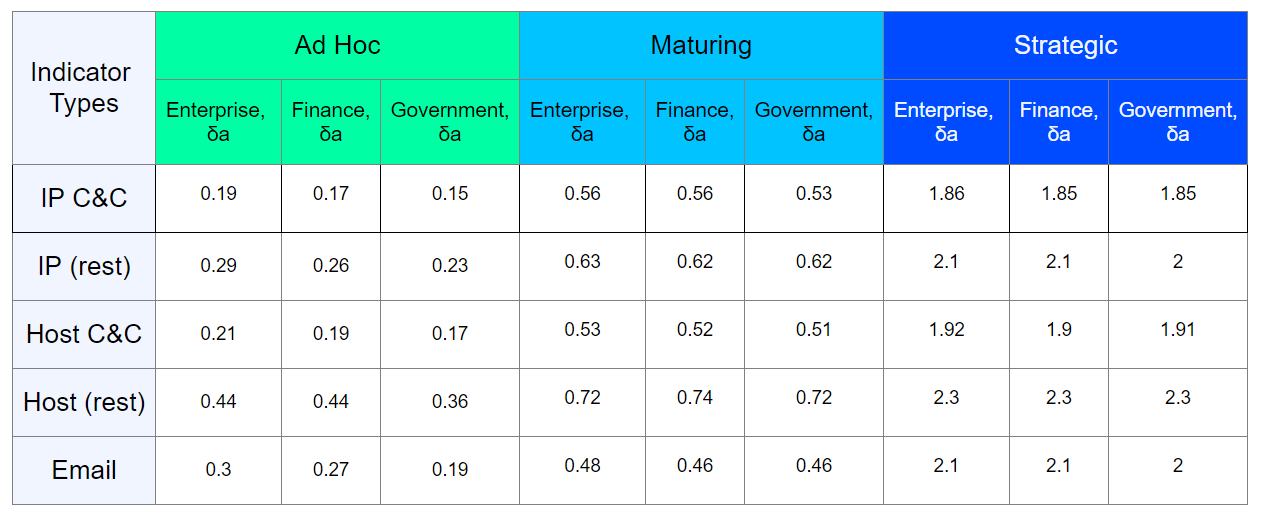
I emphasize once again that the result in the table is approximate, in reality, the assessment should be carried out individually for a specific infrastructure.
With the advent of shelf life of each indicator, we can determine the approximate time when they can be written off. It is also worth noting that the calculation of the time for write-off should be carried out only when there is a tendency to a decrease in the base indicator estimate.
For example, consider an indicator with a base score of 80, time = 120 and different decay_rate ( ).

As can be seen from the graphs, determining the approximate criticality of the assessment (in our case - 20, with an initial assessment of 80), we can set the time to test this indicator for relevance. The more decay_rate, the faster this time comes. For example, with decay_rate = 3 and an evaluation limit = 20, this indicator could be checked for about 50 days of its operation on the GIS.
The described approach is rather difficult to implement, but its beauty is that we can carry out testing without affecting the well-established information security processes and customers' infrastructure. Now we are testing the algorithm for controlling the lifetime of a certain sample of indicators that can hypothetically fall under the write-off. In this case, in fact, these indicators remain in operation on the GIS. Relatively speaking, we take a sample of indicators, we consider for themand, noting the downward trend in the baseline assessment, we mark them as “written off” if the verification confirms their irrelevance.
It is too early to talk about the effectiveness of this approach, but the test results will help us determine whether it is worth translating it “into production”.
Such a technique can potentially help to control not only those indicators that are operated on the GIS due to the incident response. Successful adaptation of this approach by cyber threat information providers will allow you to profile threat feeds in such a way that they contain indicators of compromise with a specific lifetime for specific customers and infrastructures.
Conclusion
Treat Intelligence is, of course, a necessary and useful concept in the field of information security that can significantly enhance the security of companies' infrastructure. To achieve effective use of TI, you need to understand how we can use the various information obtained through this process.
Speaking about Threat Intelligence technical information, such as threat feeds and compromise indicators, you need to remember that the method of using them should not be based on blind blacklisting. Seemingly, a simple algorithm for detecting and subsequently blocking a threat actually has many “pitfalls”, therefore, in order to effectively use technical information, it is necessary to correctly evaluate their quality, determine the priority of responses, and control their lifespan in order to reduce the load on GIS.
However, relying only on technical information Threat Intelligence is not worth it. It is much more important to adapt tactical information to the defense processes. After all, it is much more difficult for an attacker to change tactics, techniques and tools, rather than make us chase after another portion of indicators of compromise that came to light after a hacker attack. But we will tell about it in our next articles.
Author: Alexander Akhremchik, expert of the Jet CSIRT Information Security and Response Center for Jet Infosystems Company
Source: https://habr.com/ru/post/459674/
All Articles