Auto-scaling and resource management in Kubernetes (review and video report)
On April 27, at the conference Strike 2019 , in the DevOps section, the report “Autoscaling and resource management in Kubernetes” was heard. It tells you how to use K8s to ensure high availability of applications and ensure their maximum performance.

By tradition, we are glad to present a video with the report (44 minutes, much more informative than the article) and the main squeeze in text form. Go!
')
Let's sort the topic of the report by words and start from the end.
Let us have Docker-containers on the host. What for? To ensure repeatability and isolation, which in turn allows you to simply and well deploy, CI / CD. We have a lot of such machines with containers.
What does Kubernetes give in this case?
Let us run on the server nginx, php-fpm and mysql. These services will actually have even more working processes, each of which requires computational resources:
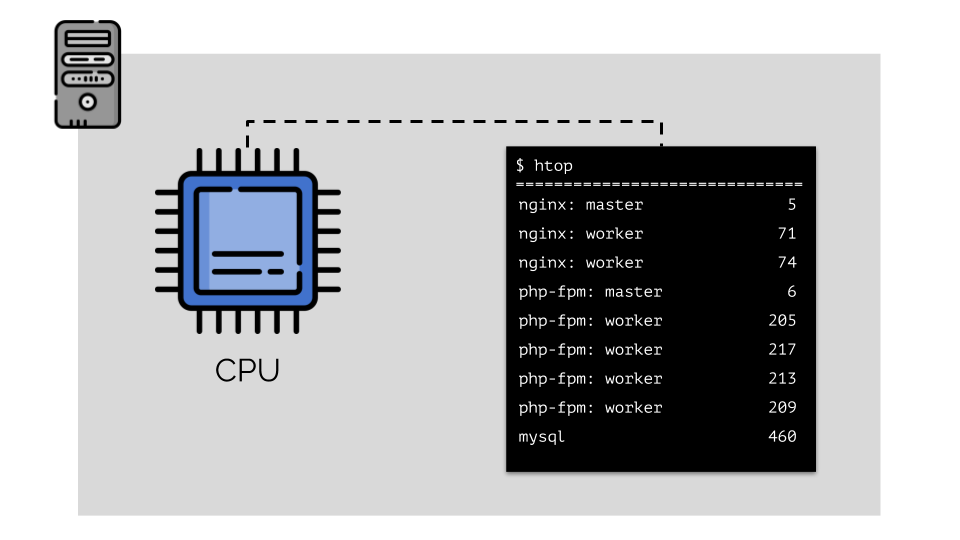
(the numbers on the slide are “parrots”, the abstract need of each process for computing power)
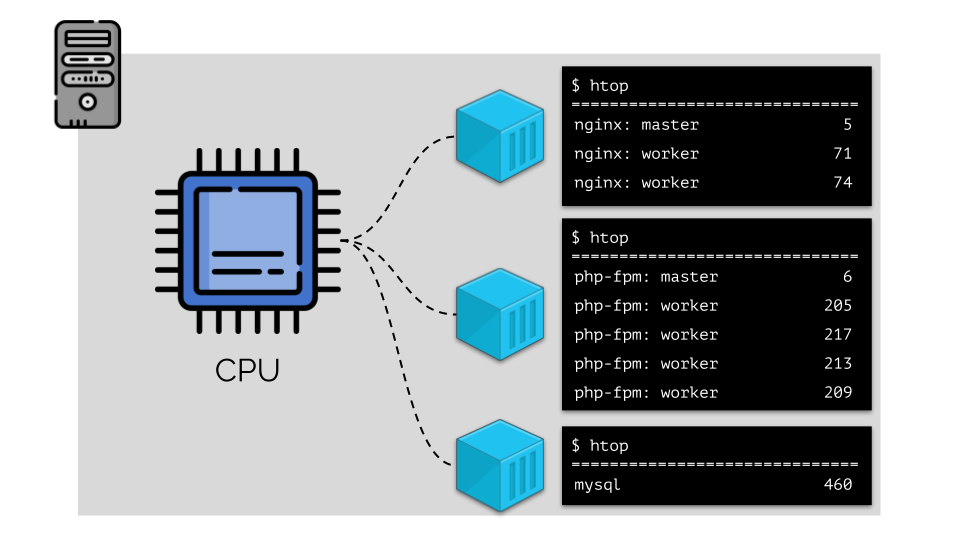
To work with this, it is logical to combine the processes by groups (for example, all nginx processes into one “nginx” group). A simple and obvious way to do this is to place each group in a container:
To continue, you need to remember what a container is (in Linux). Their appearance was made possible thanks to three key capabilities in the kernel that have been implemented for a long time: capabilities , namespaces, and cgroups . Other technologies contributed to the further development (including convenient Docker type “shells”):
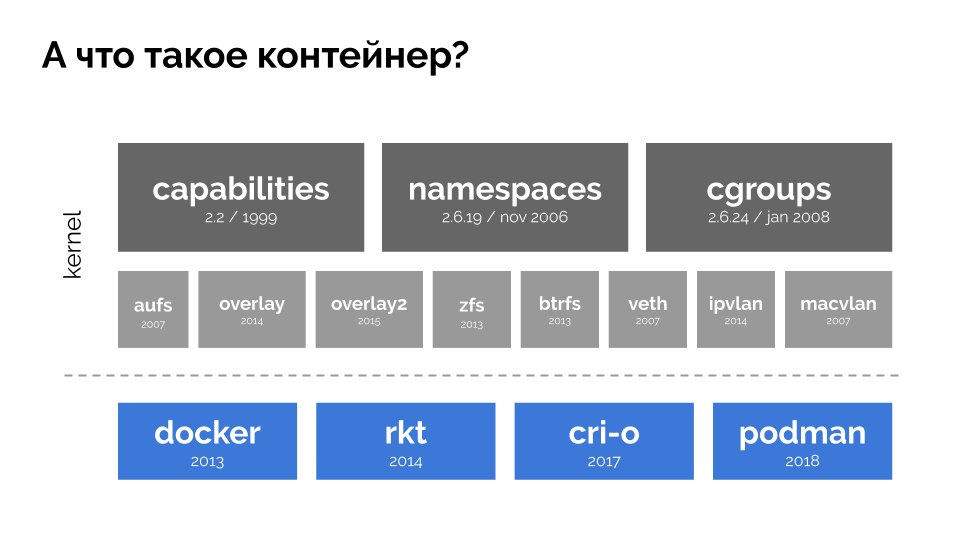
In the context of the report, we are only interested in cgroups , because the control groups are the part of the functionality of containers (Docker, etc.) that implements resource management. The processes combined into groups, as we wanted, are the control groups.
Let's return to the CPU needs of these processes, and now - the process groups:

(I repeat that all numbers are an abstract expression of the need for resources)
At the same time, the CPU itself has a finite resource (in the example it is 1000) , which everyone may lack (the sum of the needs of all groups is 150 + 850 + 460 = 1460). What will happen in this case?
The kernel begins to distribute resources and does it “honestly,” giving the same amount of resources to each group. But in the first case there are more of them (333> 150), so the surplus (333-150 = 183) remains in reserve, which is also equally distributed between two other containers:
As a result: the first container had enough resources, the second one was not enough, the third one was not enough. This is the result of the actions of an "honest" scheduler in Linux - CFS . Its operation can be adjusted by assigning the weight to each of the containers. For example:
Let's look at the case of lack of resources in the second container (php-fpm). All container resources are shared equally among the processes. As a result, the master process works well, and all workers slow down, getting less than half of what they need:
This is how the CFS scheduler works. Weights that we assign to containers will be called requests later. Why so - see further.
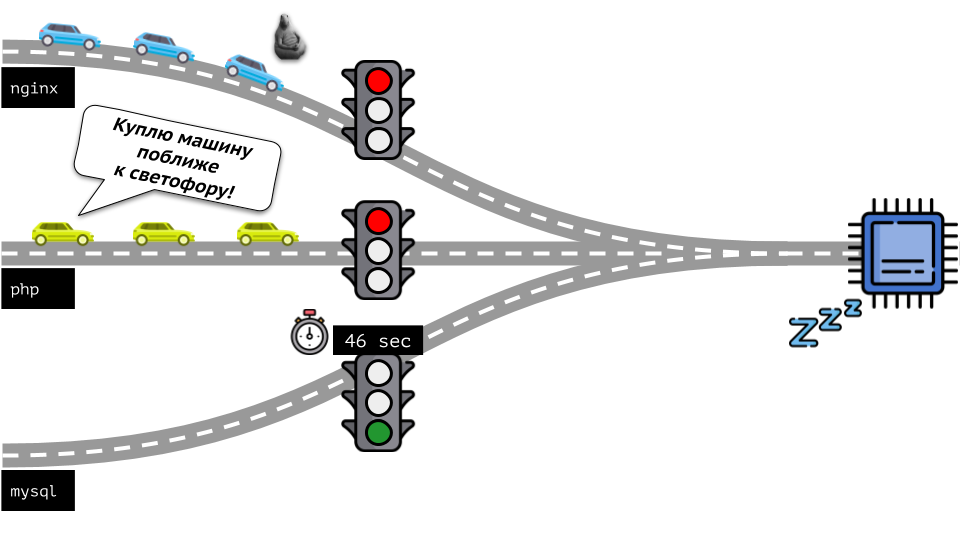
Take a look at the whole situation from the other side. As you know, all roads lead to Rome, and in the case of a computer - to the CPU. CPU alone, many tasks - you need a traffic light. The easiest way to manage resources is “traffic lights”: they gave one process a fixed access time to the CPU, then the next, and so on.
This approach is called hard limiting . Keep it simple as limits . However, if you distribute limits to all containers, a problem arises: mysql was driving along the road and at some point his need for a CPU was over, but all other processes had to wait while the CPU was idle .
Returning to the Linux kernel and its interaction with the CPU, the overall picture is as follows:
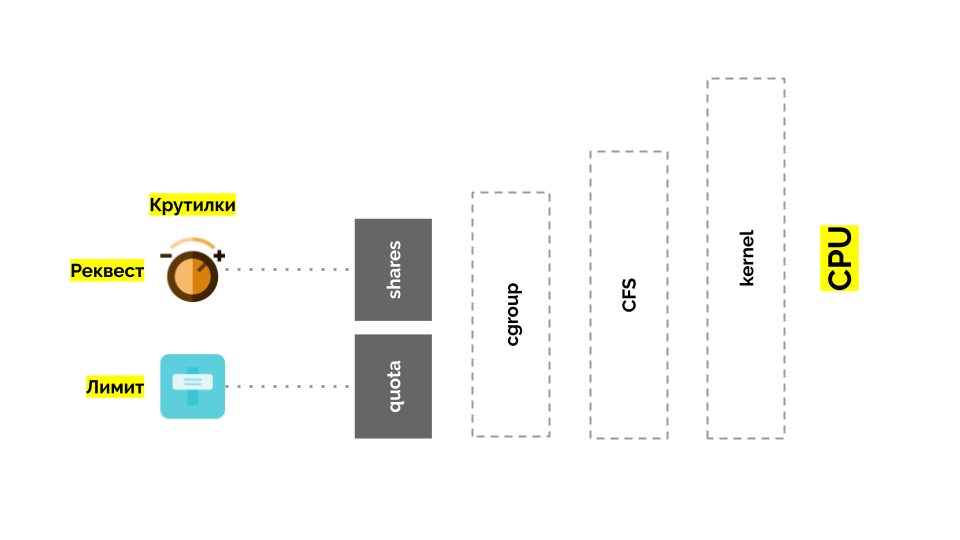
Cgroup has two settings - in fact, these are two simple “twists” that allow you to define:
There are different ways:
To make it even easier to say, they began to measure directly in the cores , meaning that the very time of the CPU is relatively real. Since Linux understands weights, and not such CPU time / cores, I needed a mechanism to translate from one to another.
Consider a simple example with a server with 3 CPU cores, where three pods will select such weights (500, 1000 and 1500) that are easily converted into the corresponding parts of the cores allocated to them (0.5, 1 and 1.5).
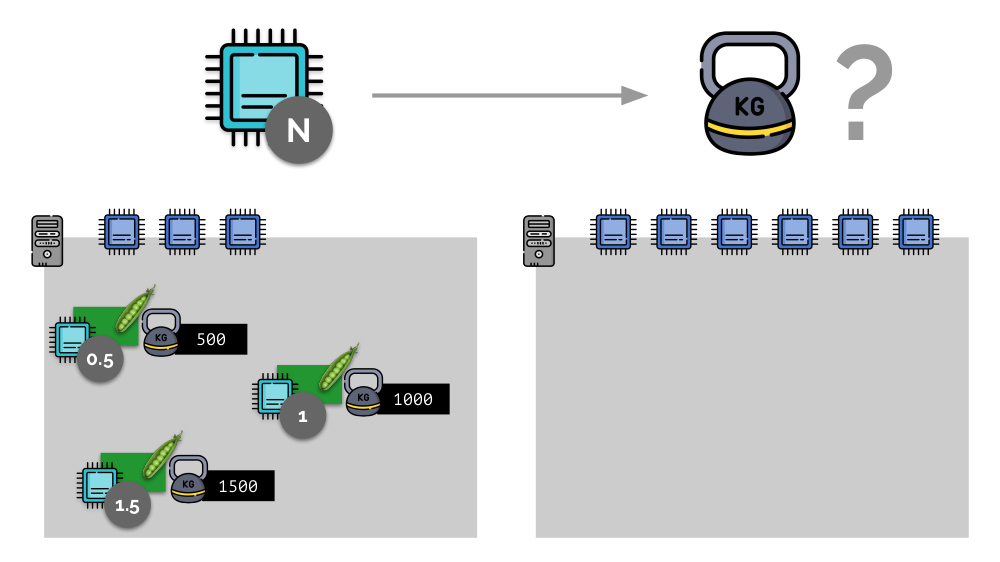
If you take the second server, where there will be twice as many cores (6), and place the same pods there, the distribution of cores can be easily calculated by simple multiplication by 2 (1, 2 and 3, respectively). But an important moment occurs when the fourth pod appears on this server, the weight of which, for convenience, is 3000. It takes some CPU resources (half of the cores), and they are recalculated from the other pods (halved):
In Kubernetes, CPU resources are usually measured in milli-kernels , i.e. 0.001 kernels are taken as the base weight. (The same thing in Linux / cgroups terminology is called CPU share, although, to be more precise, 1000 milliadr = 1024 CPU shares.) K8s ensures that there are no more pods on the server than there are CPU resources for the sum of weights all pod'ov.
How does this happen? When adding a server to the Kubernetes cluster, it is reported how many CPU cores it has. And when creating a new pod, the Kubernetes scheduler knows how many cores this pod will need. Thus, pod will be defined on the server where there are enough cores.
What happens if request is not specified (i.e., the number of cores it needs is not defined for pod)? Let's see how Kubernetes considers resources at all.
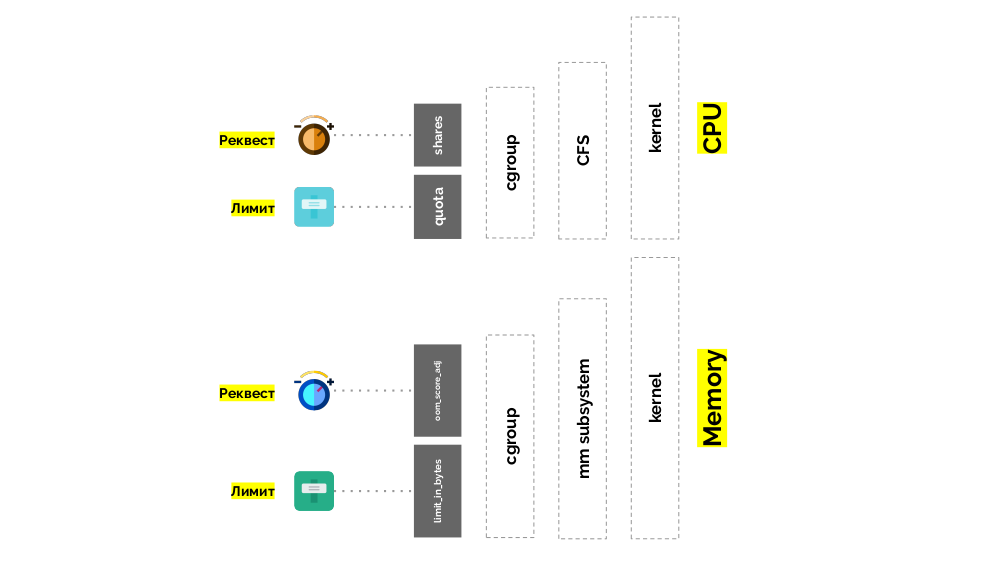
With pod, you can specify both requests (CFS scheduler) and limits (remember the traffic light?):
With memory, the situation is similar, but slightly different - after all, the nature of these resources is different. In general, the analogy is:
Let's see how requests are implemented in memory. Let the pods live on the server, changing the consumed memory, until one of them becomes so large that the memory runs out. In this case, the OOM killer appears and kills the largest process:
It does not always suit us, so it is possible to regulate which processes are important for us and should not be killed. To do this, use the oom_score_adj parameter.
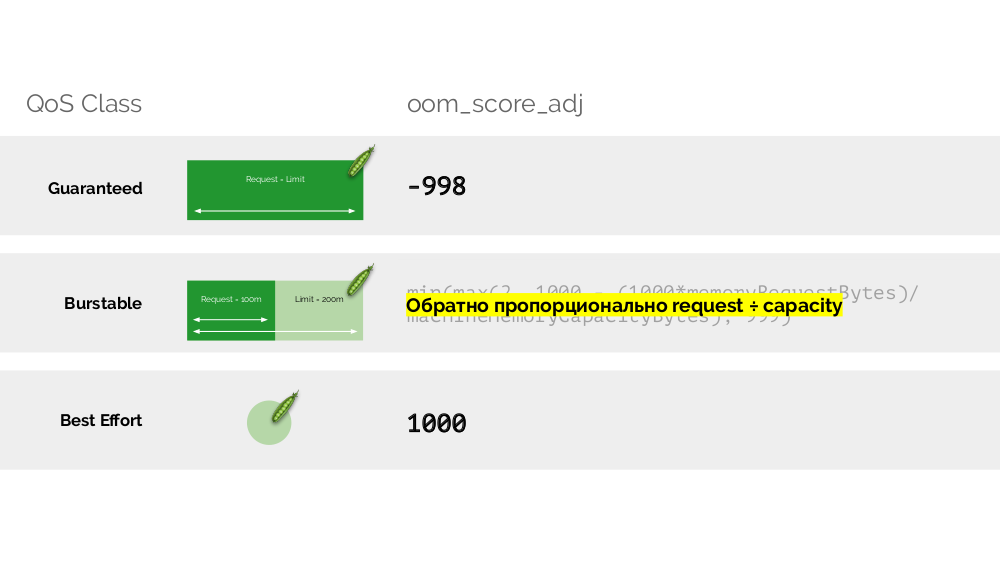
Let us return to the CPU QoS classes and draw an analogy with the oom_score_adj values, which determine memory consumption priorities for pods:
The second "twist" - limit_in_bytes - for limits. Everything is easier with it: we simply assign the maximum amount of memory to be issued, and here (unlike the CPU) there is no question what to measure its (memory).
Each pod in Kubernetes is assigned
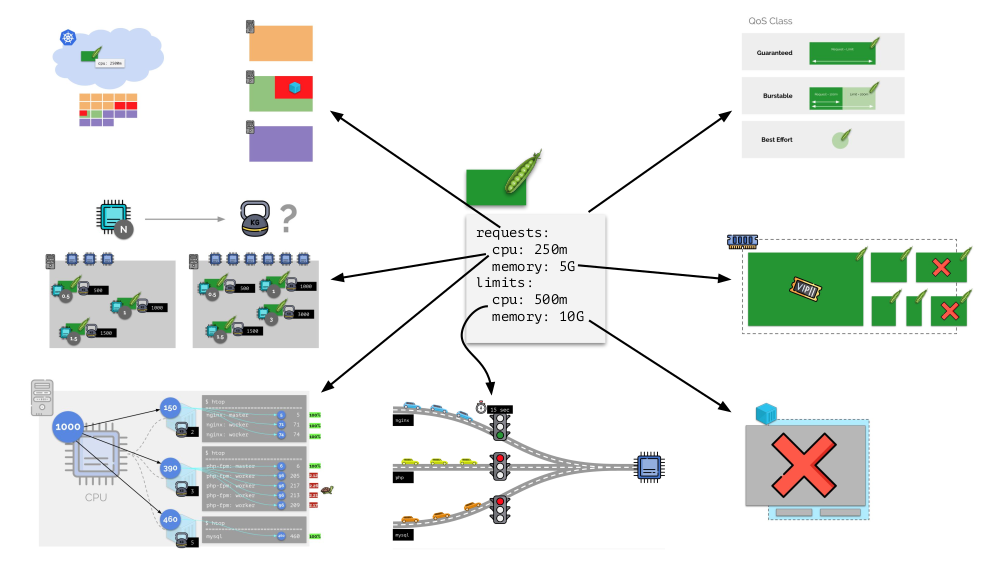
In general, this picture answers all the questions about how the bulk of resource management in Kubernetes takes place.
Imagine that the entire cluster is already occupied and a new pod has to be created. While the pod cannot appear, it hangs in Pending status. To make it appear, we can connect a new server to the cluster or ... put a cluster-autoscaler to do it for us: order a virtual machine from the cloud provider (by API request) and connect it to the cluster, after which the pod will be added .
This is the autoscaling of the Kubernetes cluster, which works great (in our experience). However, as elsewhere, here is not without nuances ...
While we were increasing the size of the cluster, everything was fine, but what happens when the cluster becomes free ? The problem is that migrating pods (for freeing hosts) is very technically difficult and expensive in terms of resources. A different approach works at Kubernetes.
Consider a cluster of 3 servers in which there is a Deployment. He has 6 pods: now it's 2 for each server. We for some reason wanted to shut down one of the servers. To do this, use the command
Since Kubernetes keeps track of the number of pods (6), he will simply re-create them on other nodes, but not on a disconnecting one, since it is already marked as inaccessible for hosting new pods. This is the fundamental mechanics for Kubernetes.
However, there is a nuance. In a similar situation for StatefulSet (instead of Deployment), the actions will be different. Now we already have a stateful application - for example, three pods with MongoDB, one of which had some kind of problem (the data got corrupted or another error that does not allow the pod to start correctly). And we again decide to disable one server. What will happen?
MongoDB could die, because it needs a quorum: for a cluster of three installations, at least two must function. However, this does not happen - thanks to the PodDisruptionBudget . This parameter defines the minimum required number of working pods. Knowing that one of the pods with MongoDB is no longer working, and seeing that the MongoDB in PodDisruptionBudget is set to
Bottom line: in order for the displacement (and in fact, re-creation) of pods to work correctly when the cluster is released, you need to configure the PodDisruptionBudget.
Consider another situation. There is an application running as Deployment in Kubernetes. At its pods (for example, there are three of them) user traffic comes, and we measure a certain indicator in them (say, the load on the CPU). When the load increases, we fix it on schedule and increase the number of pods for distribution of requests.
Today in Kubernetes, this does not have to be done manually: an automatic increase / decrease in the number of pods is set up depending on the values of the measured load parameters.
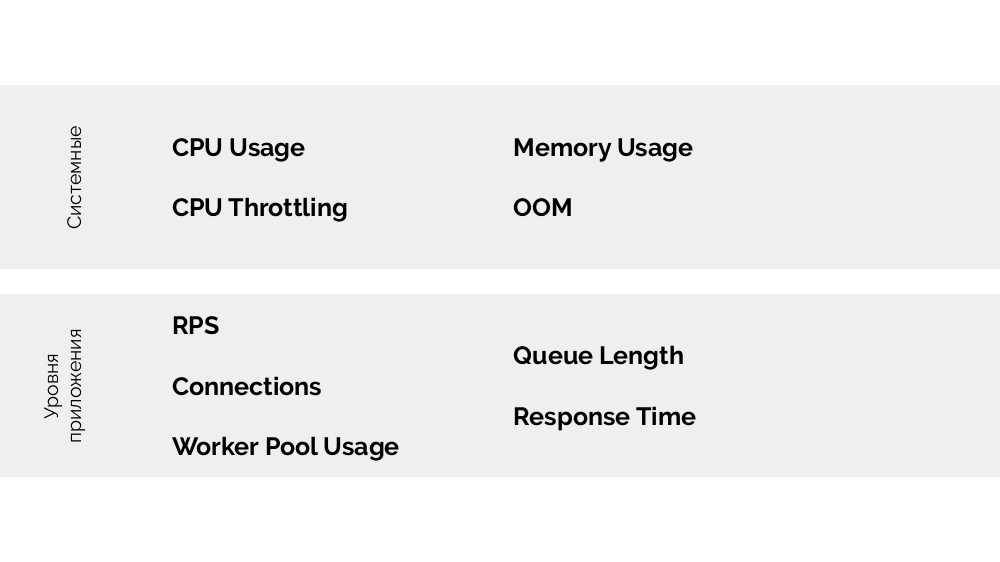
The main questions here are what to measure and how to interpret the values obtained (to make a decision about changing the number of pods). You can measure a lot:
How to do it technically - collect metrics, etc. - I talked in detail in the report about Monitoring and Kubernetes . And the main advice for choosing the optimal parameters - experiment !
There is a method USE (Utilization Saturation and Errors ), the meaning of which is as follows. Based on what does it make sense to scale, for example, php-fpm? Based on the fact that workers are running out, this is utilization . And if the workers have ended and new connections are not accepted, this is already the saturation . Both of these parameters need to be measured, and depending on the values and scaling.
The report has a continuation: about vertical scaling and how to properly select resources. I will tell you about this in future videos on our YouTube - subscribe not to miss!
Video from the performance (44 minutes):
Presentation of the report:
Other reports about Kubernetes in our blog:
By tradition, we are glad to present a video with the report (44 minutes, much more informative than the article) and the main squeeze in text form. Go!
')
Let's sort the topic of the report by words and start from the end.
Kubernetes
Let us have Docker-containers on the host. What for? To ensure repeatability and isolation, which in turn allows you to simply and well deploy, CI / CD. We have a lot of such machines with containers.
What does Kubernetes give in this case?
- We stop thinking about these machines and start working with the “cloud”, a cluster of containers or pods (groups of containers).
- Moreover, we do not even think about individual pods, but we manage even more groups. Such high-level primitives allow us to say that there is a template for starting a certain workload, but the necessary number of instances to start it. If we subsequently change the pattern, all instances will be changed.
- Using the declarative API, instead of executing a sequence of specific commands, we describe the “world device” (in YAML), which is created by Kubernetes. And again: when the description is changed, its display will also change.
Resource management
CPU
Let us run on the server nginx, php-fpm and mysql. These services will actually have even more working processes, each of which requires computational resources:
(the numbers on the slide are “parrots”, the abstract need of each process for computing power)
To work with this, it is logical to combine the processes by groups (for example, all nginx processes into one “nginx” group). A simple and obvious way to do this is to place each group in a container:
To continue, you need to remember what a container is (in Linux). Their appearance was made possible thanks to three key capabilities in the kernel that have been implemented for a long time: capabilities , namespaces, and cgroups . Other technologies contributed to the further development (including convenient Docker type “shells”):
In the context of the report, we are only interested in cgroups , because the control groups are the part of the functionality of containers (Docker, etc.) that implements resource management. The processes combined into groups, as we wanted, are the control groups.
Let's return to the CPU needs of these processes, and now - the process groups:
(I repeat that all numbers are an abstract expression of the need for resources)
At the same time, the CPU itself has a finite resource (in the example it is 1000) , which everyone may lack (the sum of the needs of all groups is 150 + 850 + 460 = 1460). What will happen in this case?
The kernel begins to distribute resources and does it “honestly,” giving the same amount of resources to each group. But in the first case there are more of them (333> 150), so the surplus (333-150 = 183) remains in reserve, which is also equally distributed between two other containers:
As a result: the first container had enough resources, the second one was not enough, the third one was not enough. This is the result of the actions of an "honest" scheduler in Linux - CFS . Its operation can be adjusted by assigning the weight to each of the containers. For example:
Let's look at the case of lack of resources in the second container (php-fpm). All container resources are shared equally among the processes. As a result, the master process works well, and all workers slow down, getting less than half of what they need:
This is how the CFS scheduler works. Weights that we assign to containers will be called requests later. Why so - see further.
Take a look at the whole situation from the other side. As you know, all roads lead to Rome, and in the case of a computer - to the CPU. CPU alone, many tasks - you need a traffic light. The easiest way to manage resources is “traffic lights”: they gave one process a fixed access time to the CPU, then the next, and so on.
This approach is called hard limiting . Keep it simple as limits . However, if you distribute limits to all containers, a problem arises: mysql was driving along the road and at some point his need for a CPU was over, but all other processes had to wait while the CPU was idle .
Returning to the Linux kernel and its interaction with the CPU, the overall picture is as follows:
Cgroup has two settings - in fact, these are two simple “twists” that allow you to define:
- container weight (request) is shares ;
- The percentage of total CPU time for working on container tasks (limits) is quota .
What is the CPU measure?
There are different ways:
- No one knows what parrots are - you need to negotiate each time.
- The percentages are clearer, but relative: 50% of the server with 4 cores and 20 cores are completely different things.
- You can use the already mentioned weights that Linux knows, but they are also relative.
- The most adequate option is to measure computing resources in seconds . Those. in seconds of processor time relative to real time seconds: given out 1 second of processor time to 1 real second - this is one whole CPU core.
To make it even easier to say, they began to measure directly in the cores , meaning that the very time of the CPU is relatively real. Since Linux understands weights, and not such CPU time / cores, I needed a mechanism to translate from one to another.
Consider a simple example with a server with 3 CPU cores, where three pods will select such weights (500, 1000 and 1500) that are easily converted into the corresponding parts of the cores allocated to them (0.5, 1 and 1.5).
If you take the second server, where there will be twice as many cores (6), and place the same pods there, the distribution of cores can be easily calculated by simple multiplication by 2 (1, 2 and 3, respectively). But an important moment occurs when the fourth pod appears on this server, the weight of which, for convenience, is 3000. It takes some CPU resources (half of the cores), and they are recalculated from the other pods (halved):
Kubernetes and CPU resources
In Kubernetes, CPU resources are usually measured in milli-kernels , i.e. 0.001 kernels are taken as the base weight. (The same thing in Linux / cgroups terminology is called CPU share, although, to be more precise, 1000 milliadr = 1024 CPU shares.) K8s ensures that there are no more pods on the server than there are CPU resources for the sum of weights all pod'ov.
How does this happen? When adding a server to the Kubernetes cluster, it is reported how many CPU cores it has. And when creating a new pod, the Kubernetes scheduler knows how many cores this pod will need. Thus, pod will be defined on the server where there are enough cores.
What happens if request is not specified (i.e., the number of cores it needs is not defined for pod)? Let's see how Kubernetes considers resources at all.
With pod, you can specify both requests (CFS scheduler) and limits (remember the traffic light?):
- If they are equal, then the pod is assigned a QoS class guaranteed . Such amount of kernels always available for it is guaranteed.
- If request is less than the limit, the QoS class is burstable . Those. we expect that pod, for example, always uses 1 core, however this value is not a restriction for it: sometimes pod can use more (when there are free resources on the server for this).
- There is also the best effort QoS class - those pods for which the request is not specified belong to it. Resources are given to them last.
Memory
With memory, the situation is similar, but slightly different - after all, the nature of these resources is different. In general, the analogy is:
Let's see how requests are implemented in memory. Let the pods live on the server, changing the consumed memory, until one of them becomes so large that the memory runs out. In this case, the OOM killer appears and kills the largest process:
It does not always suit us, so it is possible to regulate which processes are important for us and should not be killed. To do this, use the oom_score_adj parameter.
Let us return to the CPU QoS classes and draw an analogy with the oom_score_adj values, which determine memory consumption priorities for pods:
- The lowest value of the pod's oom_score_adj - -998 - means that such a pod should be killed at the very last, guaranteed .
- The highest - 1000 is the best effort , such pods are killed before anyone else.
- To calculate the remaining values ( burstable ) there is a formula, the essence of which boils down to the fact that the more pod requested resources, the less chance that he will be killed.
The second "twist" - limit_in_bytes - for limits. Everything is easier with it: we simply assign the maximum amount of memory to be issued, and here (unlike the CPU) there is no question what to measure its (memory).
Total
Each pod in Kubernetes is assigned
requests and limits - both parameters for CPU and for memory:- based on requests, the Kubernetes scheduler works, which distributes the pods across servers;
- based on all parameters, the pod'a QoS class is determined;
- based on CPU requests, relative weights are calculated;
- based on CPU requests, a CFS scheduler is configured;
- based on the memory requests, the OOM killer is configured;
- based on CPU limits, the “traffic light” is configured;
- based on the memory limits, the limit on the cgroup is configured.
In general, this picture answers all the questions about how the bulk of resource management in Kubernetes takes place.
Autoscale
K8s cluster-autoscaler
Imagine that the entire cluster is already occupied and a new pod has to be created. While the pod cannot appear, it hangs in Pending status. To make it appear, we can connect a new server to the cluster or ... put a cluster-autoscaler to do it for us: order a virtual machine from the cloud provider (by API request) and connect it to the cluster, after which the pod will be added .
This is the autoscaling of the Kubernetes cluster, which works great (in our experience). However, as elsewhere, here is not without nuances ...
While we were increasing the size of the cluster, everything was fine, but what happens when the cluster becomes free ? The problem is that migrating pods (for freeing hosts) is very technically difficult and expensive in terms of resources. A different approach works at Kubernetes.
Consider a cluster of 3 servers in which there is a Deployment. He has 6 pods: now it's 2 for each server. We for some reason wanted to shut down one of the servers. To do this, use the command
kubectl drain , which:- prohibit sending new pods to this server;
- will remove existing pods on the server.
Since Kubernetes keeps track of the number of pods (6), he will simply re-create them on other nodes, but not on a disconnecting one, since it is already marked as inaccessible for hosting new pods. This is the fundamental mechanics for Kubernetes.
However, there is a nuance. In a similar situation for StatefulSet (instead of Deployment), the actions will be different. Now we already have a stateful application - for example, three pods with MongoDB, one of which had some kind of problem (the data got corrupted or another error that does not allow the pod to start correctly). And we again decide to disable one server. What will happen?
MongoDB could die, because it needs a quorum: for a cluster of three installations, at least two must function. However, this does not happen - thanks to the PodDisruptionBudget . This parameter defines the minimum required number of working pods. Knowing that one of the pods with MongoDB is no longer working, and seeing that the MongoDB in PodDisruptionBudget is set to
minAvailable: 2 , Kubernetes will not allow to remove the pod.Bottom line: in order for the displacement (and in fact, re-creation) of pods to work correctly when the cluster is released, you need to configure the PodDisruptionBudget.
Horizontal scaling
Consider another situation. There is an application running as Deployment in Kubernetes. At its pods (for example, there are three of them) user traffic comes, and we measure a certain indicator in them (say, the load on the CPU). When the load increases, we fix it on schedule and increase the number of pods for distribution of requests.
Today in Kubernetes, this does not have to be done manually: an automatic increase / decrease in the number of pods is set up depending on the values of the measured load parameters.
The main questions here are what to measure and how to interpret the values obtained (to make a decision about changing the number of pods). You can measure a lot:
How to do it technically - collect metrics, etc. - I talked in detail in the report about Monitoring and Kubernetes . And the main advice for choosing the optimal parameters - experiment !
There is a method USE (Utilization Saturation and Errors ), the meaning of which is as follows. Based on what does it make sense to scale, for example, php-fpm? Based on the fact that workers are running out, this is utilization . And if the workers have ended and new connections are not accepted, this is already the saturation . Both of these parameters need to be measured, and depending on the values and scaling.
Instead of conclusion
The report has a continuation: about vertical scaling and how to properly select resources. I will tell you about this in future videos on our YouTube - subscribe not to miss!
Video and slides
Video from the performance (44 minutes):
Presentation of the report:
PS
Other reports about Kubernetes in our blog:
- “ We are expanding and complementing Kubernetes ” (Andrey Polovov; April 8, 2019 at Saint HighLoad ++) ;
- “ Databases and Kubernetes ” (Dmitry Stolyarov; November 8, 2018 in HighLoad ++) ;
- “ Monitoring and Kubernetes ” (Dmitry Stolyarov; May 28, 2018 at RootConf) ;
- “ Best CI / CD practices with Kubernetes and GitLab ” (Dmitry Stolyarov; November 7, 2017 on HighLoad ++) ;
- “ Our experience with Kubernetes in small projects ” (Dmitry Stolyarov; June 6, 2017 at RootConf) .
Source: https://habr.com/ru/post/459326/
All Articles