Performance analysis queries in ClickHouse. Yandex report
What to do if your request to the database is not fast enough? How to find out if a query is optimal using computational resources or can it be accelerated At the last HighLoad ++ conference in Moscow, I talked about the introspection of query performance — and what ClickHouse gives, and OS capabilities that everyone should know.
Every time I make a request, I’m concerned not only with the result, but also with what the request does. For example, it works one second. Is it a lot or a little? I always think: why not half a second? Then I optimize something, I speed it up, and it works for 10 ms. I am usually satisfied. But still, in this case, I try to make a disgruntled expression on my face and ask: “Why not 5 ms?” How can you find out what time is spent on processing the request? Is it possible in principle to speed it up?
')
Usually the speed of processing a request is simple arithmetic. We wrote the code - probably optimally - and we have a device in the system. The devices have technical specifications. For example, read speed from L1 cache. Or the number of random readings SSD can do. We all know that. We need to take these characteristics, add, subtract, multiply, divide and check the answer. But it is in the ideal case, this almost does not happen. Nearly. In fact, in ClickHouse this sometimes happens.
Consider the trivial facts about what devices and what resources are in our servers.

Processor, memory, disk, network. I specifically ordered these resources in such a way, from the simplest and most convenient for reviewing and optimizing to the most inconvenient and complex. For example, I execute a query and see that my program seems to run into the CPU. What does it mean? What I will find there is some internal loop, a function that is most often executed, I will rewrite the code, recompile, and once - my program runs faster.
If you spend too much RAM, then everything is a little more complicated. We need to rethink the data structure, squeeze some bits. In any case, I restart my program, and it spends less RAM. True, this is often at the expense of the processor.
If everything in my hands rests on the disks, then this is also more difficult, because I can change the data structure on the disk, but I have to convert this data later. If I make a new release, people will have to do some sort of data migration. It turns out that the disk is much more difficult, and it is better to think about it in advance.
A network ... I really do not like the network, because it is often completely incomprehensible what is happening in it, especially if it is a network between continents, between data centers. There is something slow, and it’s not even your network, not your server, and you can’t do anything. The only thing you can think through in advance is how data will be transmitted and how to minimize network interaction.
It happens that not a single resource in the system has been utilized, and the program is just waiting for something. In fact, this is a very frequent case, because the system is distributed, and there may be many processes and flows there, and some kind of waiting for another is necessary, and all this needs to be somehow linked to each other in order to properly consider.

The simplest thing is to look at the utilization of resources, at some numerical value. For example, you run some top, and he writes: processor - 100%. Or run iostat, and he writes: disks - 100%. True, this is often not enough. One person will see that the program rests on the disks. What can be done? You can simply mark it and go to rest, decide that everything, nothing can be optimized. But in fact, each of the devices inside is quite complex. The processor has a bunch of computing devices for different types of operations. Disks may have a RAID array. If the SSD, then there inside your processor, its controller, which makes it unclear what. And one value - 50% or 100% - is not enough. The basic rule is: if you see that some resource is 100% utilized, do not give up. Often, you can still improve something. But it happens the other way around. Let's say you can see that the disposal is 50%, but nothing will be done.
Let's take a closer look at this.

The easiest and most convenient resource is the processor. You watch top, it says that the processor is 100%. But it is worth bearing in mind that this is not a 100% processor. The top program does not know what the processor is doing there. It looks from the point of view of the OS scheduler. That is, now some program thread is running on the processor. The processor does something, and then it will be shown 100% if it is averaged over some time. At the same time, the processor is doing something, and it is not clear how effective. It can perform a different number of instructions per clock. If there are few instructions, the processor itself may wait for something, for example, loading data from memory. In this case, the top will display the same thing - 100%. We wait while the processor executes our instructions. And what he does inside there is unclear.
Finally, there are just rakes when you think that your program runs into the processor. This is true, but the processor for some reason lowered the frequency. There can be many reasons: overheating, power limit. For some reason, in the data center there is a power limit on the power supply, or energy saving can simply be turned on. Then the processor will constantly switch from a higher frequency to a lower one, but if your load is intermittent, then this is not enough and, on average, the code will be slower. The real processor frequency is in turbostat. Check whether there was overheating, you can in dmesg. If there was anything like this, it will be written there: “Overheating. The frequency is reduced.
If you are interested in how many cache misses were inside, how many instructions are executed per clock, use perf record. Record a sample of the program. Then you can see it with perf stat or perf report.

And vice versa. Suppose you look at the top and the processor is disposed of less than 50%. Suppose you have 32 virtual processor cores in the system, and 16 physical cores on the Intel processor, because hyper-threading is double. But this does not mean that additional kernels are useless. It all depends on the load. Suppose you have well-optimized operations of some kind of linear algebra, or you calculate hashes for mining Bitcoins. Then the code will be clear, many instructions will be executed per clock cycle, there will be no cash misses, branch mispredictions as well. And hyper-threading does not help. It helps when you have one core waiting for something, while the other can simultaneously execute instructions from another thread.
There are both situations in ClickHouse. For example, when we do data aggregation (GROUP BY) or filtering by set (IN subquery), we will have a hash table. If the hash table does not fit in the processor cache, cache misses will occur. This is almost impossible to avoid. In this case, hyper-threading will help us.
By default, ClickHouse uses only physical processor cores, not including hyper-threading. If you know that your query can benefit from hyper-threading - just double the number of threads: SET max threads = 32, and your query will be executed faster.
It happens that the processor is perfectly used, but you look at the graph and see, for example, 10%. And you have, for example, a five-minute schedule at worst. Even if one-second, there is still some kind of averaged value. In fact, you constantly had requests, they are executed quickly, for 100 ms every second, and this is normal. Because ClickHouse tries to execute the query as quickly as possible. It does not try to use and overheat your processors at all.

Let's take a closer look, a bit complicated option. There is a query with the expression in subquery. Inside the subquery we have 100 million random numbers. And we just filter on this result.
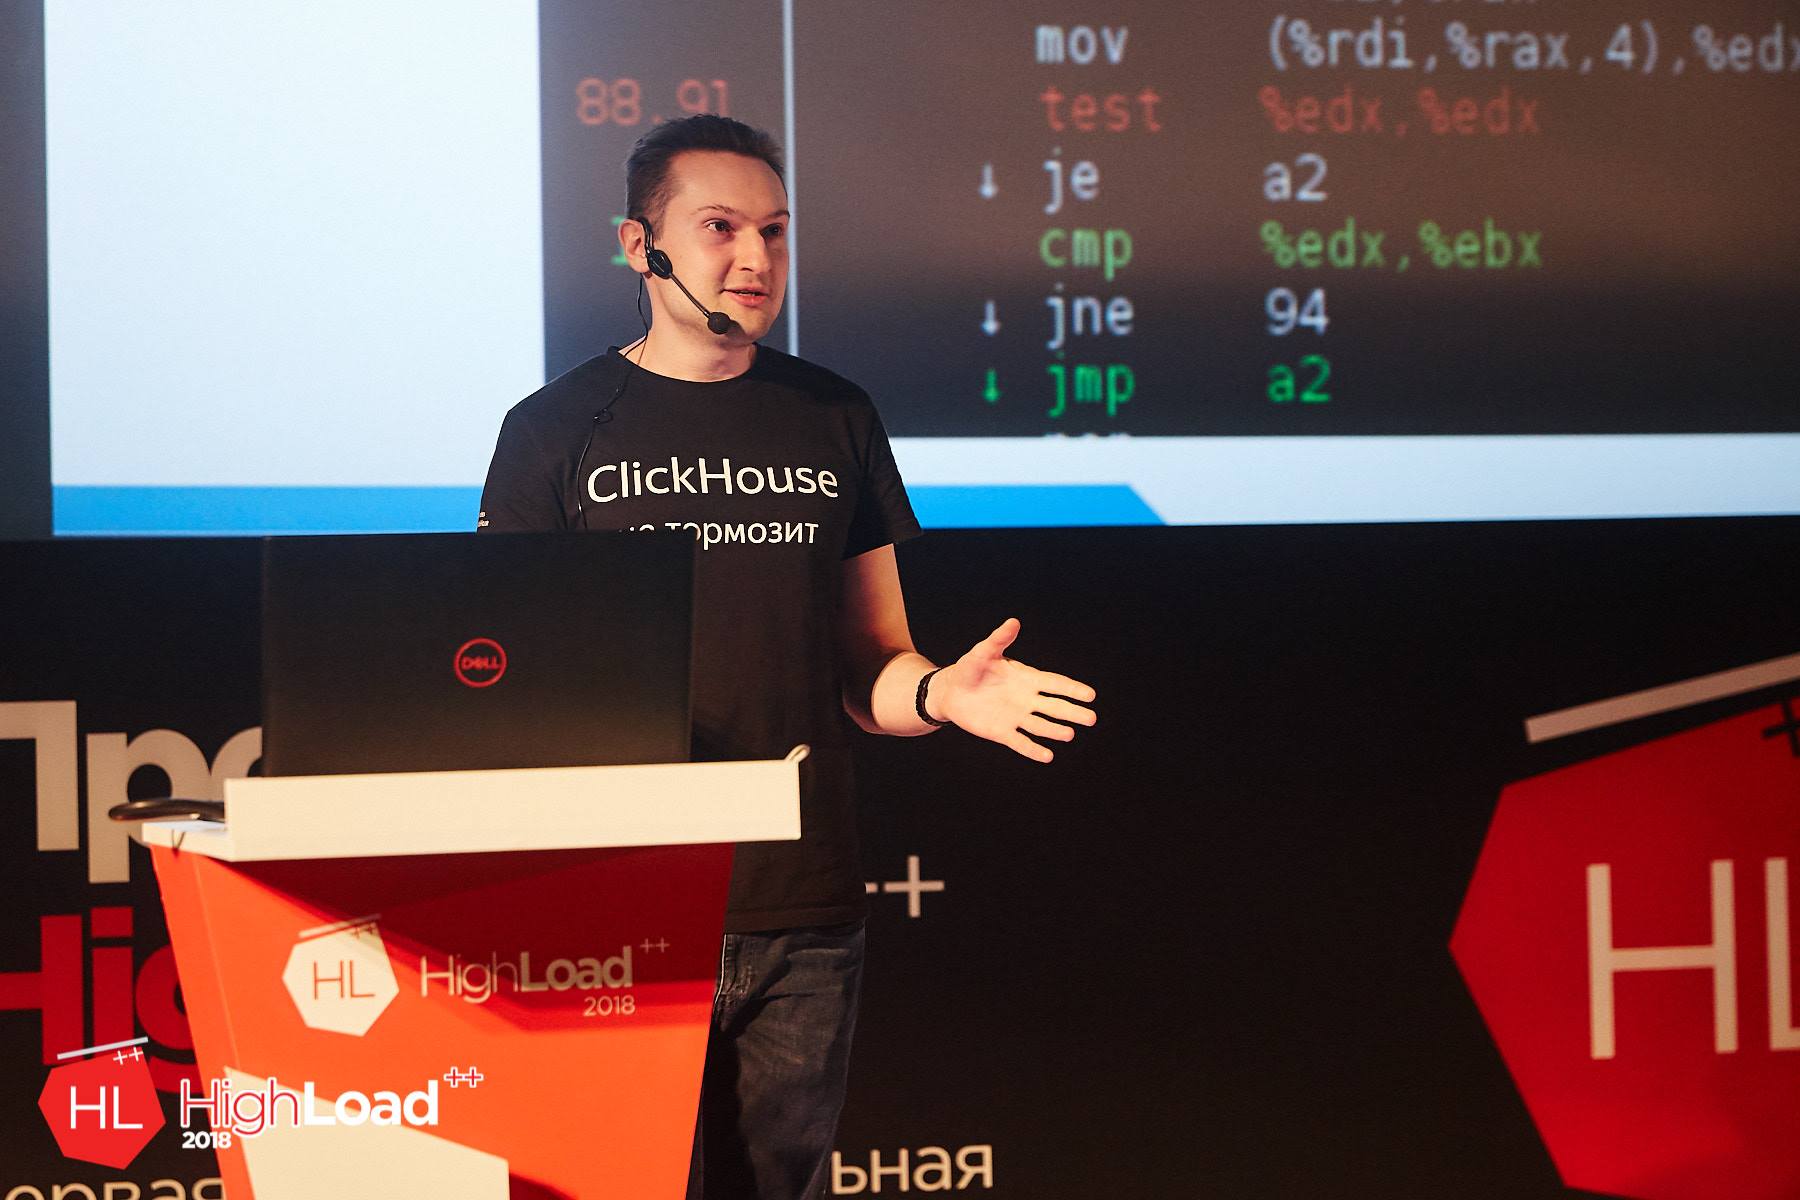
We see such a picture. By the way, who can say, with the help of which tool do I see this wonderful picture? Absolutely right - perf. I am very glad that you know this.
I opened the perf, thinking that I would understand everything now. I open the assembler listing. There I have written how often the execution of the program was on a specific instruction, that is, how often there was an instruction pointer. Here, the numbers are in percent, and it is written that almost 90% of the time the instruction was executed test% edx,% edx, that is, checking four bytes for zero.
The question is: why can a processor take so much time to perform a simple comparison instruction of four bytes with zero? (Answers from the audience ...) There is no remainder of the division. There are bit shifts, then there is a crc32q instruction, but as if the instruction pointer never happens. And the generation of random numbers is not in this listing. There was a separate function, and it is very well optimized, it does not slow down. There is something else going on here. The execution of the code seems to stop at this instruction and spends a lot of time. Idle loop? Not. Why should I insert empty loops? Also, if I inserted an idle loop, that would also be visible in perf. There is no division by zero, there is just a comparison with zero.
The processor has a pipeline, it can execute several instructions in parallel. And when the instruction pointer is in some place, it does not mean at all that it executes this instruction. Maybe he is waiting for some other instructions.
We have a hash table to check that some number is found in some set. For this we do a lookup in memory. When we lookup in memory, we have a cache miss, because the hash table contains 100 million numbers, it does not fit into any cache. This means that to execute the zero check instruction, this data must already be loaded from memory. And we wait until they are loaded.
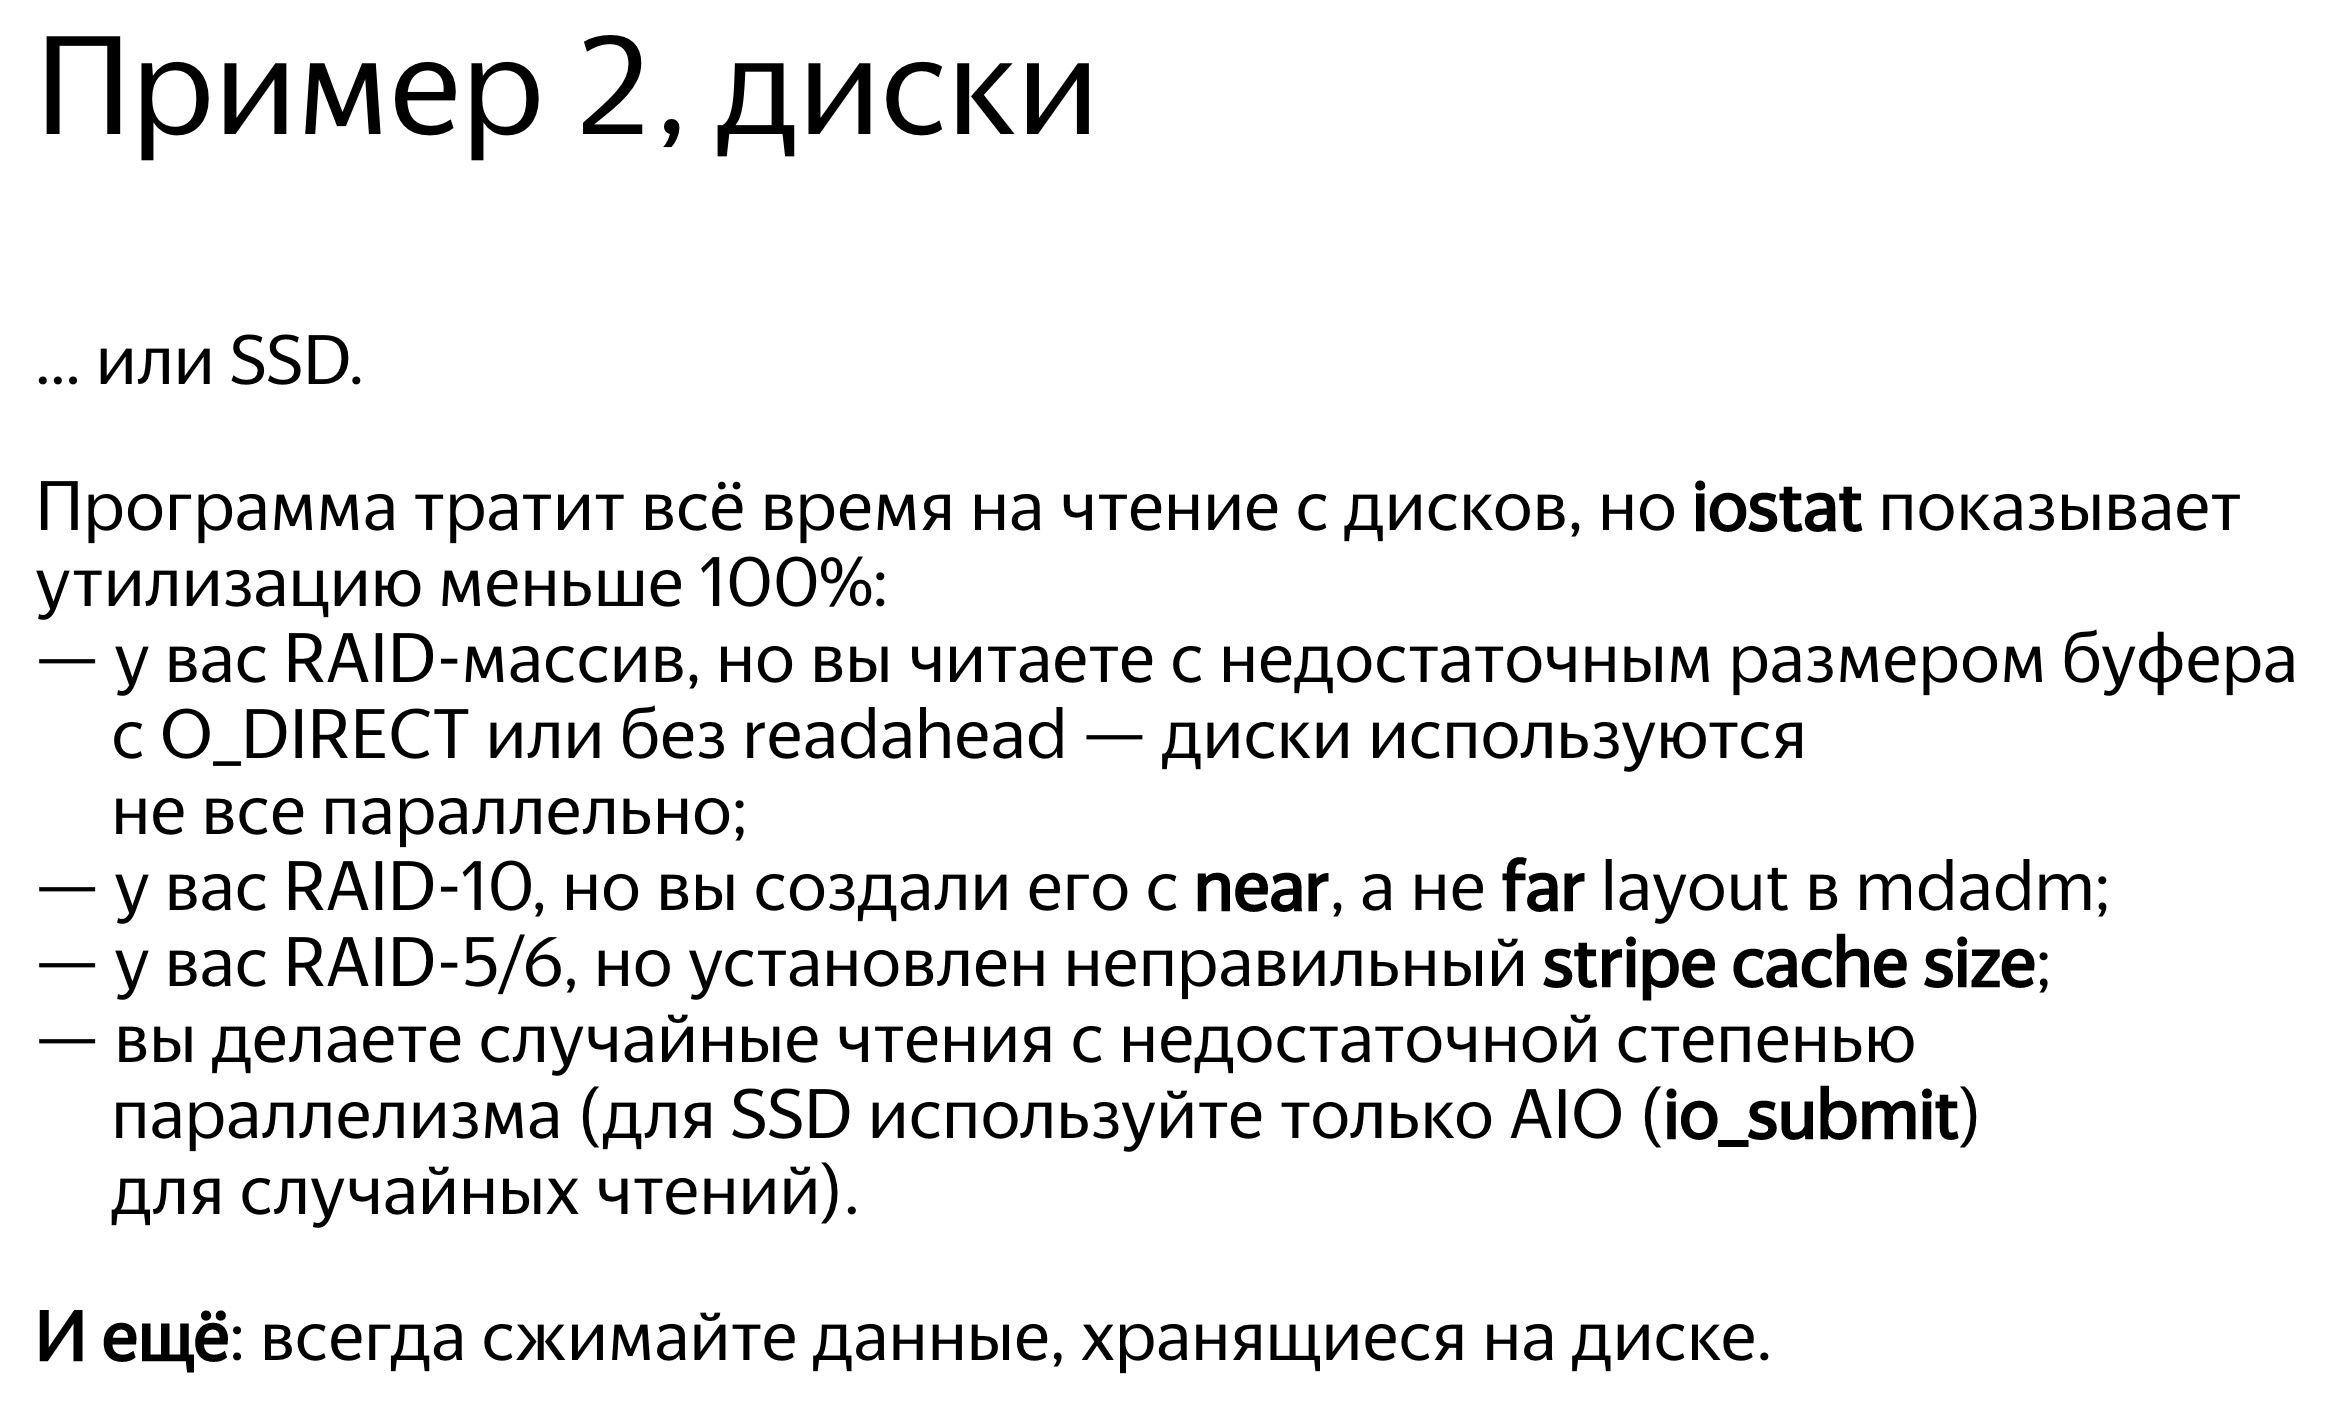
Now the next resource, a little more complicated - the disks. Disks are sometimes called SSDs, although this is not entirely correct. In this example, the SSD will also be included.
We open, for example, iostat, it shows the utilization of 100%.
At conferences it often happens that a speaker comes on the scene and says with pathos: “Databases always run into a disk. Therefore, we made an in-memory database. It will not slow down. " If a person approaches you and says so, you can safely send him. There will be some problems - say, I have resolved. :)
Suppose the program rests on disks, recycling 100. But this, of course, does not mean that we use the disks optimally.
A typical example is when you just have a lot of random access. Even if the access is sequential, you simply read the file sequentially, but still it may be more or less optimal.
For example, you have a RAID array, several devices — say, 8 disks. And you just read consistently without read ahead, with a buffer size of 1 MB, and the chunk size in your stripe in RAID is also 1 MB. Then you will have every reading from one device. Or, if not aligned, with two devices. There will go half a megabyte somewhere, another half a megabyte somewhere, and so on - the disks will be used in turn: either one, or the other, or the third.
It is necessary, that was read ahead. Or, if you have O_DIRECT, increase the buffer size. That is, the rule is: 8 disks, chunk size 1 MB, set the buffer size to at least 8 MB. But it will work optimally only if the reading is aligned. And if not aligned, then there will first be extra pieces, and you need to put more, increase it a few more.
Or, for example, you have RAID 10. How fast can you read from RAID 10 - say, from 8 disks? What will be the advantage? Four, because there is a mirror, or eight? Actually it depends on how the RAID is created, what is the location of the chunks in the stripes.
If you use mdadm in Linux, you can set near layout and far layout there, with near better for writing, far for reading.
I always recommend using far layout, because when you make a record in the analytical database, this is usually not so time critical - even if there is a lot more writing than reading. This is done by some background process. But when you read, you need to execute it as quickly as possible. So it is better to optimize RAID for reading by setting far layout.
As luck would have it, in Linux mdadm will default to you near layout, and you will get only half the performance. There are a lot of such rakes.
Another terrible rake is RAID 5 or RAID 6. Everything there scales well in sequential reads and records. In RAID 5, the multiplicity will be “number of devices minus one”. It scales well even by random reads, but does not scale well by random entries. You make an entry in any one place, and you need to read data from all other disks, copy them (XOR - editor's note) and write to another place. For this, a certain stripe cache is used, a terrible rake. In Linux, it is by default such that you create RAID 5 and it will slow you down. And you will think that RAID 5 is always slow, because this is understandable. But in fact, the reason for the wrong setting.
One more example. You are reading from an SSD, and you have bought yourself a good SSD, it is written in the specification - 300 thousand random reads per second. And you somehow fail. And you think - yes, they all lie in their specifications, there is no such thing. But all these readings should be done in parallel, with the maximum degree of parallelism. The only way to do this optimally enough is to use asynchronous I / O, which is implemented using the io_submit, io_getevents, io_setup system calls, and so on.
By the way, the data on the disk, if you store them, you should always compress. I will give an example from practice. One person contacted us in the ClickHouse support chat and said:
- ClickHouse compresses data. I see it rests on the processor. I have very fast SSD NVMe disks, they have a reading speed of several gigabytes per second. Is it possible to somehow disable compression in ClickHouse?
“No, no way,” I say. - You need the data to be compressed.
- Let me counter it, there will just be another compression algorithm that does nothing.
- Easy. Write these letters in this line of code.
“Indeed, everything is very simple,” he answered every other day. - I did.
- How much has the performance changed?
“Could not test,” he wrote a day later. - Data has become too much. They now do not fit on the SSD.
Let's now see what disk reading might look like. Run dstat, it shows the read speed.
Here is the read column - 300 MB / s. We read from disks. I don't know whether it is a lot or a little.
Now I run iostat to check it out. Here is a breakdown by device. I have a RAID, md2, and eight hard drives. Each of them shows recycling, it does not even reach 100% (50-60%). But the most important thing is that I read from each disk only at a speed of 20-30 MB / s. And since my childhood I remembered the rule that from a hard disk you can read somewhere around 100 MB / s. For some reason, this is still almost unchanged.
Here is another example. Reading is more optimal. I run dstat, and I have a read speed from this RAID 5 of eight disks - 1 GB / s. What does iostat show? Yes, almost 1 GB / s.
Now the discs are finally 100% loaded. True, for some reason, two at 100%, and the rest at 95%. Probably, they are still a little different. But from each of them I read 150 MB / s, even better than it can be. What is the difference? In the first case, I read with insufficient buffer size in insufficient chunks. It's simple, I tell you the truths.
By the way, if you think that the data still does not need to be compressed for the analytical database, that is, a report from the HighLoad ++ Siberia conference ( report on the report motifs - approx. Ed.). The organizers decided to make the most hardcore reports in Novosibirsk.

The next example is memory. Continuing truisms. First, on Linux, never see what free shows. For those who watch, specially created the site linuxatemyram.com. Come in, there will be an explanation. You don't need to look at the amount of virtual memory either, because what's the difference how much address space the program has allocated? Look at how much physical memory is used.
And one more rake, which even it is not clear how to fight. Remember: the fact that allocators often do not like to give memory to the system is normal. They made mmap, and munmap no longer do. Memory will not return to the system. The program thinks - I know better how I will use the memory. I'll leave it to myself. Because the mmap and munmap system calls are pretty slow. Changing the address space, resetting the processor's TLB caches is better not to. However, the OS still has the ability to free the memory correctly using the madvise system call. The address space will remain, but physically the memory may be unloaded.
And never turn on swap on production servers with databases. You think - not enough memory, including swap. After that, the query will stop working. It will crack endless time.

With the network, too, the typical rake. If you create a TCP connection every time, it takes some time before the correct window size is chosen, because the TCP protocol does not know how fast it will be to transfer data. He adapts to this.
Or imagine - you are transferring a file, and you have a large latency on the network and a decent packet loss. Then it is not at all obvious whether it is right to use TCP to transfer files. I think that is wrong, as TCP guarantees consistency. On the other hand, you could transfer one half of a file and the other at the same time. Use at least a few TCP connections or not use TCP at all for data transfer.For example, if you download data, movies and TV shows by torrents, there TCP may not be used. And the data needs to be compressed.
If you have a 100-gigabit network within the rack, you can not compress. But if you have 10 gigabits between data centers, especially between Europe and the USA, then who knows how your bytes will crawl under the ocean. Squeeze them. Let crawls less bytes.

Everyone saw this picture? If everything in the system slows down - you have the necessary tools. You will begin to use them, begin to deal with the problem and, from experience, find 10 other problems. These tools are powerful enough to keep you occupied for a very long time.

: « - » — . iotop, , , iops.
, . Let's get a look.
top -, , clickHouse-server - , - . , , Shift+H, . , ClickHouse . ParalInputsProc, . BackgrProcPool — merges . , .
? ClickHouse, , . BackgroundProcessingPool. 15 . 16 1, 1 — . 16? , Linux — , : «16 . ». :)
clickhouse-benchmark. clickhouse-client. , clickhouse-client, . - . .
. clickhouse-benchmark, , , , , . peft top. peft top, . , - -, uniq: UniquesHashSet. . , . , .
, , . — -. , , XOR - . -. - -. , -.
, , crc32q. , , - , - .
, ClickHouse. , , . ClickHouse.

. , — , SHOW PROCESSLIST. . , SELECT * FROM system processes. : , , . ClickHouse top.
ClickHouse ? background-. Background- — merges. , merges , SELECT * FROM system.merges.
, . -. . — ClickHouse. . , , . , . - traf_testing. What is it? , , . ClickHouse .

Go ahead. , . , , , , . query_log. — , - , SELECT , - . query_log , . - . — , . : .
, , — merge, inserts, . part_log. , .

query_log clickhouse-benchmark. select , , stdin clickhouse-benchmark.
query_log - , .
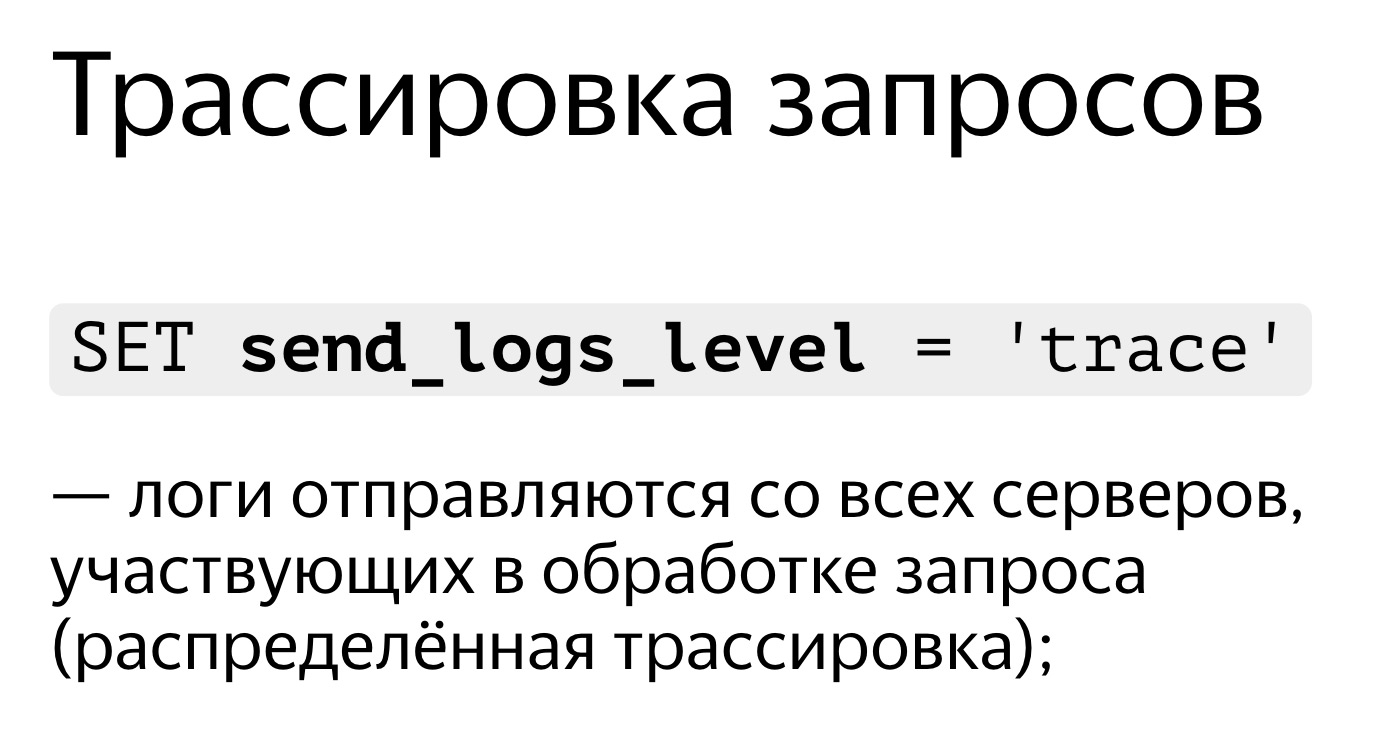
, , . . SET send_logs_level = 'trace', , .
, . , 98%. , . It is very simple. SET send_logs_level = 'trace', , . - : merging aggregated data, . 1% . , .
, , query_log.
Let's get a look. SELECT * FROM system.query_log . . , , , query_log. . — , , , . .
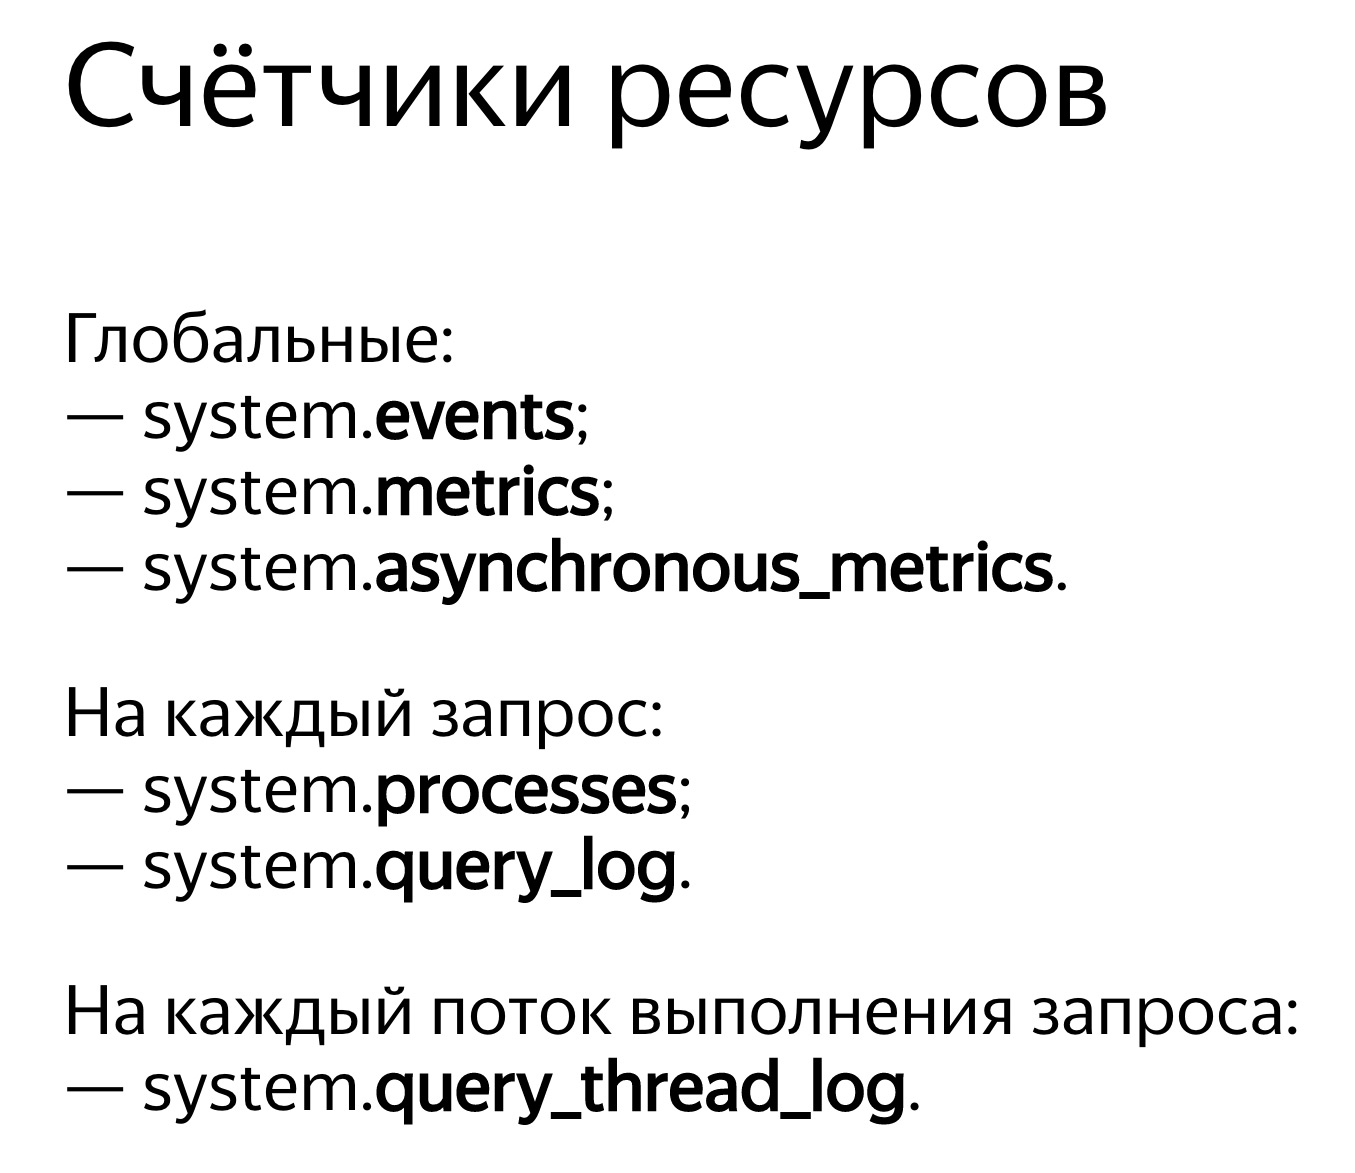
ClickHouse . — system.events, system.metrics system.asynchronous_metrics. Events — , , . 100 . — 10 . system.metrics — . , 10 , 10 .
system.asynchronous_metrics , . . — . , system.asynchronous_metrics — , - . , .
, . SHOW PROCESSLIST . query_log, .

, . , . , . , , . , Linux, . Linux . , . , . .
, OSReadChars OSReadBytes. ? , , , . , . , , , . , - , .
, . - . , 40 , 6,7 . Fine. , , . , , .
, 1,3 , 5 . Why? , — page cache. ?
. . , , . . : 3,2 , — 2,5 . , , , . Why? -, : read ahead. , — ? -, — 4 , , 512 KB. . , . , - read ahead.

. . , . , , ReadBytes — , . 3 , 3 . , , .
— IOWait. 87 . 7 , IOWait — 87. ? — . . , , 87 . , - .
— CPUWait. , , , . - — , . CPU. CPU. - , . — , , user space. , - . Well, okay.
— , Linux. - , . , , .
And now the most advanced that we have: query_thread_log. With it, you can understand what each thread of the query spent time on.
I look for my query, select by query_id and indicate the metric "The amount of processor time spent in user space". Here are our streams. For parallel processing of the request was allocated 16 threads. Each of them spent 800 ms. And then another 16 streams were allocated for merging of the state of the aggregate functions, 0.25 s were spent on each of them. Now I can understand exactly what time was spent on each request.
Video report on HighLoad ++:
Every time I make a request, I’m concerned not only with the result, but also with what the request does. For example, it works one second. Is it a lot or a little? I always think: why not half a second? Then I optimize something, I speed it up, and it works for 10 ms. I am usually satisfied. But still, in this case, I try to make a disgruntled expression on my face and ask: “Why not 5 ms?” How can you find out what time is spent on processing the request? Is it possible in principle to speed it up?
')
Usually the speed of processing a request is simple arithmetic. We wrote the code - probably optimally - and we have a device in the system. The devices have technical specifications. For example, read speed from L1 cache. Or the number of random readings SSD can do. We all know that. We need to take these characteristics, add, subtract, multiply, divide and check the answer. But it is in the ideal case, this almost does not happen. Nearly. In fact, in ClickHouse this sometimes happens.
Consider the trivial facts about what devices and what resources are in our servers.
Processor, memory, disk, network. I specifically ordered these resources in such a way, from the simplest and most convenient for reviewing and optimizing to the most inconvenient and complex. For example, I execute a query and see that my program seems to run into the CPU. What does it mean? What I will find there is some internal loop, a function that is most often executed, I will rewrite the code, recompile, and once - my program runs faster.
If you spend too much RAM, then everything is a little more complicated. We need to rethink the data structure, squeeze some bits. In any case, I restart my program, and it spends less RAM. True, this is often at the expense of the processor.
If everything in my hands rests on the disks, then this is also more difficult, because I can change the data structure on the disk, but I have to convert this data later. If I make a new release, people will have to do some sort of data migration. It turns out that the disk is much more difficult, and it is better to think about it in advance.
A network ... I really do not like the network, because it is often completely incomprehensible what is happening in it, especially if it is a network between continents, between data centers. There is something slow, and it’s not even your network, not your server, and you can’t do anything. The only thing you can think through in advance is how data will be transmitted and how to minimize network interaction.
It happens that not a single resource in the system has been utilized, and the program is just waiting for something. In fact, this is a very frequent case, because the system is distributed, and there may be many processes and flows there, and some kind of waiting for another is necessary, and all this needs to be somehow linked to each other in order to properly consider.
The simplest thing is to look at the utilization of resources, at some numerical value. For example, you run some top, and he writes: processor - 100%. Or run iostat, and he writes: disks - 100%. True, this is often not enough. One person will see that the program rests on the disks. What can be done? You can simply mark it and go to rest, decide that everything, nothing can be optimized. But in fact, each of the devices inside is quite complex. The processor has a bunch of computing devices for different types of operations. Disks may have a RAID array. If the SSD, then there inside your processor, its controller, which makes it unclear what. And one value - 50% or 100% - is not enough. The basic rule is: if you see that some resource is 100% utilized, do not give up. Often, you can still improve something. But it happens the other way around. Let's say you can see that the disposal is 50%, but nothing will be done.
Let's take a closer look at this.
The easiest and most convenient resource is the processor. You watch top, it says that the processor is 100%. But it is worth bearing in mind that this is not a 100% processor. The top program does not know what the processor is doing there. It looks from the point of view of the OS scheduler. That is, now some program thread is running on the processor. The processor does something, and then it will be shown 100% if it is averaged over some time. At the same time, the processor is doing something, and it is not clear how effective. It can perform a different number of instructions per clock. If there are few instructions, the processor itself may wait for something, for example, loading data from memory. In this case, the top will display the same thing - 100%. We wait while the processor executes our instructions. And what he does inside there is unclear.
Finally, there are just rakes when you think that your program runs into the processor. This is true, but the processor for some reason lowered the frequency. There can be many reasons: overheating, power limit. For some reason, in the data center there is a power limit on the power supply, or energy saving can simply be turned on. Then the processor will constantly switch from a higher frequency to a lower one, but if your load is intermittent, then this is not enough and, on average, the code will be slower. The real processor frequency is in turbostat. Check whether there was overheating, you can in dmesg. If there was anything like this, it will be written there: “Overheating. The frequency is reduced.
If you are interested in how many cache misses were inside, how many instructions are executed per clock, use perf record. Record a sample of the program. Then you can see it with perf stat or perf report.
And vice versa. Suppose you look at the top and the processor is disposed of less than 50%. Suppose you have 32 virtual processor cores in the system, and 16 physical cores on the Intel processor, because hyper-threading is double. But this does not mean that additional kernels are useless. It all depends on the load. Suppose you have well-optimized operations of some kind of linear algebra, or you calculate hashes for mining Bitcoins. Then the code will be clear, many instructions will be executed per clock cycle, there will be no cash misses, branch mispredictions as well. And hyper-threading does not help. It helps when you have one core waiting for something, while the other can simultaneously execute instructions from another thread.
There are both situations in ClickHouse. For example, when we do data aggregation (GROUP BY) or filtering by set (IN subquery), we will have a hash table. If the hash table does not fit in the processor cache, cache misses will occur. This is almost impossible to avoid. In this case, hyper-threading will help us.
By default, ClickHouse uses only physical processor cores, not including hyper-threading. If you know that your query can benefit from hyper-threading - just double the number of threads: SET max threads = 32, and your query will be executed faster.
It happens that the processor is perfectly used, but you look at the graph and see, for example, 10%. And you have, for example, a five-minute schedule at worst. Even if one-second, there is still some kind of averaged value. In fact, you constantly had requests, they are executed quickly, for 100 ms every second, and this is normal. Because ClickHouse tries to execute the query as quickly as possible. It does not try to use and overheat your processors at all.
Let's take a closer look, a bit complicated option. There is a query with the expression in subquery. Inside the subquery we have 100 million random numbers. And we just filter on this result.
We see such a picture. By the way, who can say, with the help of which tool do I see this wonderful picture? Absolutely right - perf. I am very glad that you know this.
I opened the perf, thinking that I would understand everything now. I open the assembler listing. There I have written how often the execution of the program was on a specific instruction, that is, how often there was an instruction pointer. Here, the numbers are in percent, and it is written that almost 90% of the time the instruction was executed test% edx,% edx, that is, checking four bytes for zero.
The question is: why can a processor take so much time to perform a simple comparison instruction of four bytes with zero? (Answers from the audience ...) There is no remainder of the division. There are bit shifts, then there is a crc32q instruction, but as if the instruction pointer never happens. And the generation of random numbers is not in this listing. There was a separate function, and it is very well optimized, it does not slow down. There is something else going on here. The execution of the code seems to stop at this instruction and spends a lot of time. Idle loop? Not. Why should I insert empty loops? Also, if I inserted an idle loop, that would also be visible in perf. There is no division by zero, there is just a comparison with zero.
The processor has a pipeline, it can execute several instructions in parallel. And when the instruction pointer is in some place, it does not mean at all that it executes this instruction. Maybe he is waiting for some other instructions.
We have a hash table to check that some number is found in some set. For this we do a lookup in memory. When we lookup in memory, we have a cache miss, because the hash table contains 100 million numbers, it does not fit into any cache. This means that to execute the zero check instruction, this data must already be loaded from memory. And we wait until they are loaded.
Now the next resource, a little more complicated - the disks. Disks are sometimes called SSDs, although this is not entirely correct. In this example, the SSD will also be included.
We open, for example, iostat, it shows the utilization of 100%.
At conferences it often happens that a speaker comes on the scene and says with pathos: “Databases always run into a disk. Therefore, we made an in-memory database. It will not slow down. " If a person approaches you and says so, you can safely send him. There will be some problems - say, I have resolved. :)
Suppose the program rests on disks, recycling 100. But this, of course, does not mean that we use the disks optimally.
A typical example is when you just have a lot of random access. Even if the access is sequential, you simply read the file sequentially, but still it may be more or less optimal.
For example, you have a RAID array, several devices — say, 8 disks. And you just read consistently without read ahead, with a buffer size of 1 MB, and the chunk size in your stripe in RAID is also 1 MB. Then you will have every reading from one device. Or, if not aligned, with two devices. There will go half a megabyte somewhere, another half a megabyte somewhere, and so on - the disks will be used in turn: either one, or the other, or the third.
It is necessary, that was read ahead. Or, if you have O_DIRECT, increase the buffer size. That is, the rule is: 8 disks, chunk size 1 MB, set the buffer size to at least 8 MB. But it will work optimally only if the reading is aligned. And if not aligned, then there will first be extra pieces, and you need to put more, increase it a few more.
Or, for example, you have RAID 10. How fast can you read from RAID 10 - say, from 8 disks? What will be the advantage? Four, because there is a mirror, or eight? Actually it depends on how the RAID is created, what is the location of the chunks in the stripes.
If you use mdadm in Linux, you can set near layout and far layout there, with near better for writing, far for reading.
I always recommend using far layout, because when you make a record in the analytical database, this is usually not so time critical - even if there is a lot more writing than reading. This is done by some background process. But when you read, you need to execute it as quickly as possible. So it is better to optimize RAID for reading by setting far layout.
As luck would have it, in Linux mdadm will default to you near layout, and you will get only half the performance. There are a lot of such rakes.
Another terrible rake is RAID 5 or RAID 6. Everything there scales well in sequential reads and records. In RAID 5, the multiplicity will be “number of devices minus one”. It scales well even by random reads, but does not scale well by random entries. You make an entry in any one place, and you need to read data from all other disks, copy them (XOR - editor's note) and write to another place. For this, a certain stripe cache is used, a terrible rake. In Linux, it is by default such that you create RAID 5 and it will slow you down. And you will think that RAID 5 is always slow, because this is understandable. But in fact, the reason for the wrong setting.
One more example. You are reading from an SSD, and you have bought yourself a good SSD, it is written in the specification - 300 thousand random reads per second. And you somehow fail. And you think - yes, they all lie in their specifications, there is no such thing. But all these readings should be done in parallel, with the maximum degree of parallelism. The only way to do this optimally enough is to use asynchronous I / O, which is implemented using the io_submit, io_getevents, io_setup system calls, and so on.
By the way, the data on the disk, if you store them, you should always compress. I will give an example from practice. One person contacted us in the ClickHouse support chat and said:
- ClickHouse compresses data. I see it rests on the processor. I have very fast SSD NVMe disks, they have a reading speed of several gigabytes per second. Is it possible to somehow disable compression in ClickHouse?
“No, no way,” I say. - You need the data to be compressed.
- Let me counter it, there will just be another compression algorithm that does nothing.
- Easy. Write these letters in this line of code.
“Indeed, everything is very simple,” he answered every other day. - I did.
- How much has the performance changed?
“Could not test,” he wrote a day later. - Data has become too much. They now do not fit on the SSD.
Let's now see what disk reading might look like. Run dstat, it shows the read speed.
The first example of dstat and iostat
Here is the read column - 300 MB / s. We read from disks. I don't know whether it is a lot or a little.
Now I run iostat to check it out. Here is a breakdown by device. I have a RAID, md2, and eight hard drives. Each of them shows recycling, it does not even reach 100% (50-60%). But the most important thing is that I read from each disk only at a speed of 20-30 MB / s. And since my childhood I remembered the rule that from a hard disk you can read somewhere around 100 MB / s. For some reason, this is still almost unchanged.
The second example of dstat and iostat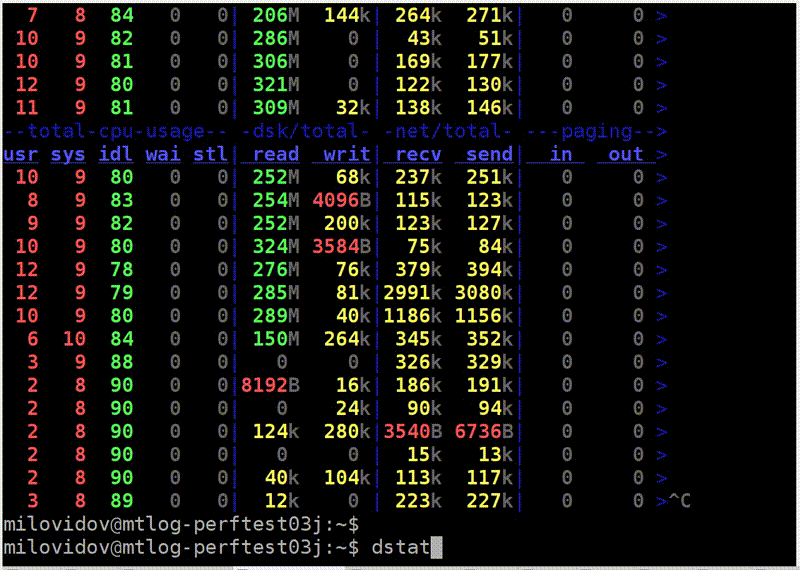
Here is another example. Reading is more optimal. I run dstat, and I have a read speed from this RAID 5 of eight disks - 1 GB / s. What does iostat show? Yes, almost 1 GB / s.
Now the discs are finally 100% loaded. True, for some reason, two at 100%, and the rest at 95%. Probably, they are still a little different. But from each of them I read 150 MB / s, even better than it can be. What is the difference? In the first case, I read with insufficient buffer size in insufficient chunks. It's simple, I tell you the truths.
By the way, if you think that the data still does not need to be compressed for the analytical database, that is, a report from the HighLoad ++ Siberia conference ( report on the report motifs - approx. Ed.). The organizers decided to make the most hardcore reports in Novosibirsk.
The next example is memory. Continuing truisms. First, on Linux, never see what free shows. For those who watch, specially created the site linuxatemyram.com. Come in, there will be an explanation. You don't need to look at the amount of virtual memory either, because what's the difference how much address space the program has allocated? Look at how much physical memory is used.
And one more rake, which even it is not clear how to fight. Remember: the fact that allocators often do not like to give memory to the system is normal. They made mmap, and munmap no longer do. Memory will not return to the system. The program thinks - I know better how I will use the memory. I'll leave it to myself. Because the mmap and munmap system calls are pretty slow. Changing the address space, resetting the processor's TLB caches is better not to. However, the OS still has the ability to free the memory correctly using the madvise system call. The address space will remain, but physically the memory may be unloaded.
And never turn on swap on production servers with databases. You think - not enough memory, including swap. After that, the query will stop working. It will crack endless time.
With the network, too, the typical rake. If you create a TCP connection every time, it takes some time before the correct window size is chosen, because the TCP protocol does not know how fast it will be to transfer data. He adapts to this.
Or imagine - you are transferring a file, and you have a large latency on the network and a decent packet loss. Then it is not at all obvious whether it is right to use TCP to transfer files. I think that is wrong, as TCP guarantees consistency. On the other hand, you could transfer one half of a file and the other at the same time. Use at least a few TCP connections or not use TCP at all for data transfer.For example, if you download data, movies and TV shows by torrents, there TCP may not be used. And the data needs to be compressed.
If you have a 100-gigabit network within the rack, you can not compress. But if you have 10 gigabits between data centers, especially between Europe and the USA, then who knows how your bytes will crawl under the ocean. Squeeze them. Let crawls less bytes.
Everyone saw this picture? If everything in the system slows down - you have the necessary tools. You will begin to use them, begin to deal with the problem and, from experience, find 10 other problems. These tools are powerful enough to keep you occupied for a very long time.
: « - » — . iotop, , , iops.
, . Let's get a look.
: top
top -, , clickHouse-server - , - . , , Shift+H, . , ClickHouse . ParalInputsProc, . BackgrProcPool — merges . , .
? ClickHouse, , . BackgroundProcessingPool. 15 . 16 1, 1 — . 16? , Linux — , : «16 . ». :)
clickhouse-benchmark. clickhouse-client. , clickhouse-client, . - . .
: clickhouse-benchmark + perf top
. clickhouse-benchmark, , , , , . peft top. peft top, . , - -, uniq: UniquesHashSet. . , . , .
, , . — -. , , XOR - . -. - -. , -.
, , crc32q. , , - , - .
, ClickHouse. , , . ClickHouse.
. , — , SHOW PROCESSLIST. . , SELECT * FROM system processes. : , , . ClickHouse top.
ClickHouse ? background-. Background- — merges. , merges , SELECT * FROM system.merges.
c
, . -. . — ClickHouse. . , , . , . - traf_testing. What is it? , , . ClickHouse .
Go ahead. , . , , , , . query_log. — , - , SELECT , - . query_log , . - . — , . : .
, , — merge, inserts, . part_log. , .
query_log clickhouse-benchmark. select , , stdin clickhouse-benchmark.
query_log - , .
, , . . SET send_logs_level = 'trace', , .
:
, . , 98%. , . It is very simple. SET send_logs_level = 'trace', , . - : merging aggregated data, . 1% . , .
, , query_log.
Let's get a look. SELECT * FROM system.query_log . . , , , query_log. . — , , , . .
ClickHouse . — system.events, system.metrics system.asynchronous_metrics. Events — , , . 100 . — 10 . system.metrics — . , 10 , 10 .
system.asynchronous_metrics , . . — . , system.asynchronous_metrics — , - . , .
, . SHOW PROCESSLIST . query_log, .
, . , . , . , , . , Linux, . Linux . , . , . .
, OSReadChars OSReadBytes. ? , , , . , . , , , . , - , .
page cache
, . - . , 40 , 6,7 . Fine. , , . , , .
, 1,3 , 5 . Why? , — page cache. ?
c
. . , , . . : 3,2 , — 2,5 . , , , . Why? -, : read ahead. , — ? -, — 4 , , 512 KB. . , . , - read ahead.
. . , . , , ReadBytes — , . 3 , 3 . , , .
— IOWait. 87 . 7 , IOWait — 87. ? — . . , , 87 . , - .
— CPUWait. , , , . - — , . CPU. CPU. - , . — , , user space. , - . Well, okay.
— , Linux. - , . , , .
: query_thread_log
And now the most advanced that we have: query_thread_log. With it, you can understand what each thread of the query spent time on.
I look for my query, select by query_id and indicate the metric "The amount of processor time spent in user space". Here are our streams. For parallel processing of the request was allocated 16 threads. Each of them spent 800 ms. And then another 16 streams were allocated for merging of the state of the aggregate functions, 0.25 s were spent on each of them. Now I can understand exactly what time was spent on each request.
Video report on HighLoad ++:
Source: https://habr.com/ru/post/459198/
All Articles