Let's transform the image into a sound - what can be heard?
Hi Habr.
A recent publication here on the site described a device that allows blind people to "see" the image, transforming it with the help of sound waves. From a technical point of view, in that article there were no details at all (and suddenly they stole the idea for a million ), but the concept itself seemed interesting. Having some experience in signal processing, I decided to experiment on my own.
')
What came out of it, the details and examples of files under the cut.
The first obvious task that awaits us is to transform a two-dimensional “flat” image into a “one-dimensional” sound wave. As suggested in the comments to that article, it is convenient to use the Hilbert curve for this.

It is essentially similar to a fractal, and the idea is that when you increase the image resolution, the relative position of objects does not change (if the object was in the upper left corner of the picture, then it will remain there ). Different dimensions of the Hilbert curves can give us different images: 32x32 for N = 5, 64x64 for N = 6, and so on. “Bypassing” the image along this curve, we get a line, a one-dimensional object.
The next question is the size of the picture. Intuitively, I want to take a larger image, but there is a big “but”: even the picture is 512x512, this is 262144 pixels. If we transform each point into a sound pulse, then at a sampling rate of 44100, we get a sequence that is as long as 6 seconds, and this is too long - the images should be updated quickly, for example using a webcam. It makes no sense to make the sampling rate higher, we will get ultrasonic frequencies that are inaudible by the ear (although it may and will work for an owl or a bat). As a result, the resolution of 128x128 was chosenby the method of scientific typing , which will give impulses 0.37c long - on the one hand, it is fast enough to navigate in real time, on the other hand, it is enough to catch any changes in the waveform by ear.
The first step is to load the image, convert it to b / w and scale it to the desired size. Image size depends on the dimension of the Hilbert curve.
The next step is to form a sound wave. Here, of course, there can be a great variety of algorithms and know-how, for the test I just took the brightness component. Of course, there are certainly better ways.
From the code, I hope everything is clear. The coordinates_from_distance function does all the work for us to transform the coordinates (x, y) into the distance on the Hilbert curve, we invert and convert the brightness value L to color.
That's not all. Because There may be large blocks of the same color in the image, this may lead to the appearance of “dc-components” in the sound - a long series of non-zero values, for example [100,100,100, ...]. To remove them, apply to our array of high-pass filter ( Butterworth filter ) with a cut-off frequency of 50 Hz (coincidence with the frequency of the network randomly). The synthesis of filters is in the scipy library, which we will use.
The last step is to save the image. Because the length of one impulse is short, we repeat it 10 times, it will be by ear more close to a real repeating image, for example, from a webcam.
The above algorithm is, of course, quite primitive. I wanted to check three points - how much can be distinguished between different simple figures, and how much can one estimate the distance to the figures.
Test 1

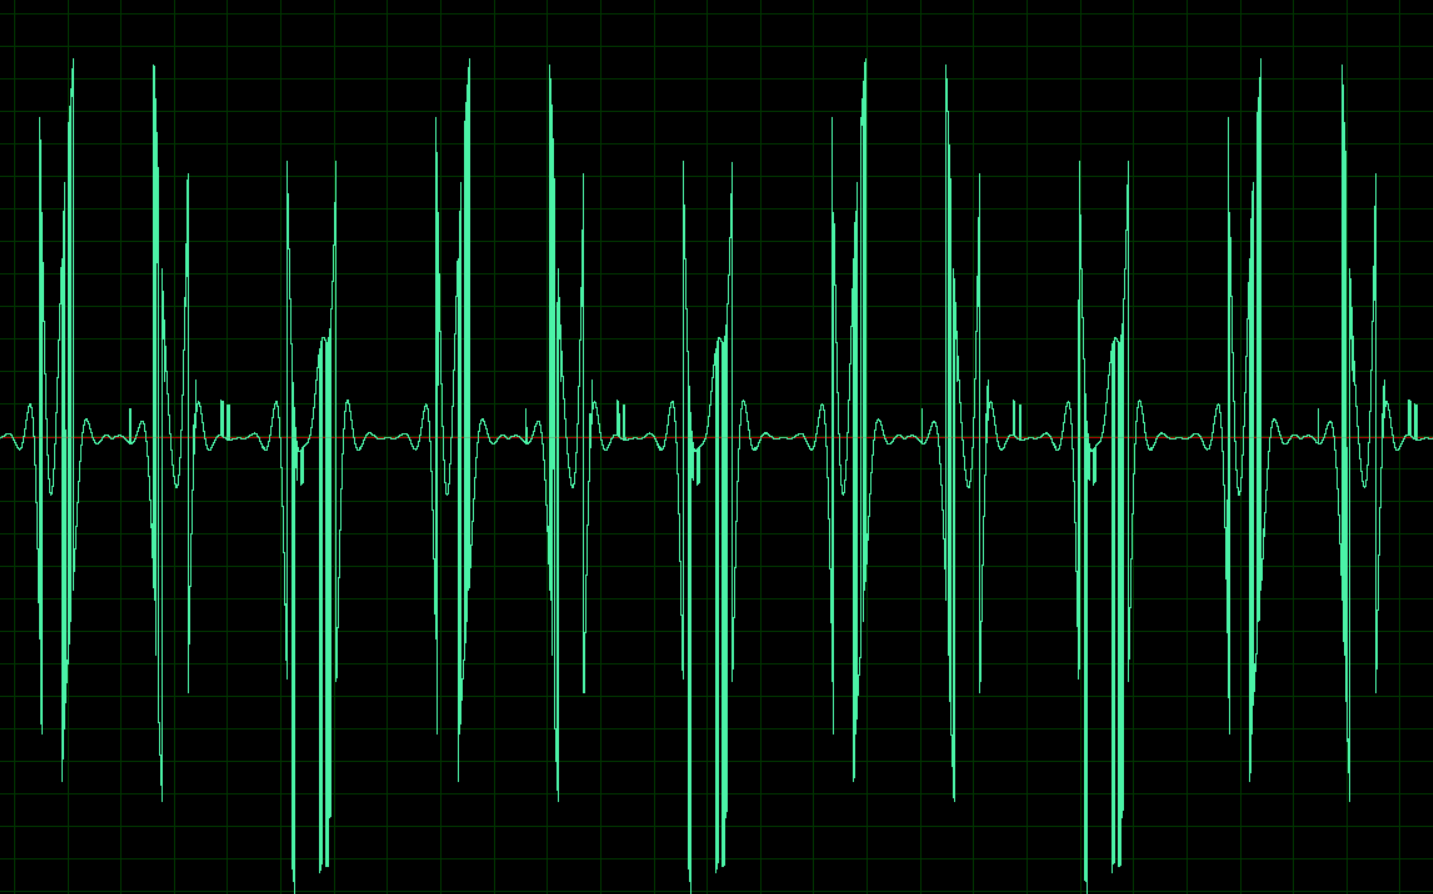
The image corresponds to the following audio signal:
Wav : cloud.mail.ru/public/nt2R/2kwBvyRup
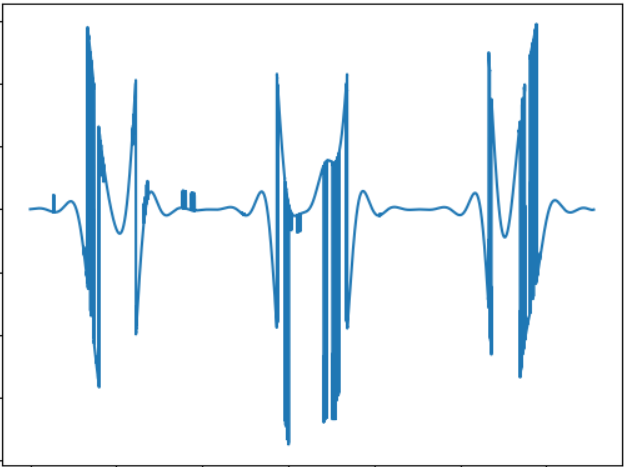
Test 2

The idea of this test is to compare the “sound” of an object of another form. Sound signal:
Wav : cloud.mail.ru/public/2rLu/4fCNRxCG2
You may notice that the sound is really different, and there is a difference in the ear.
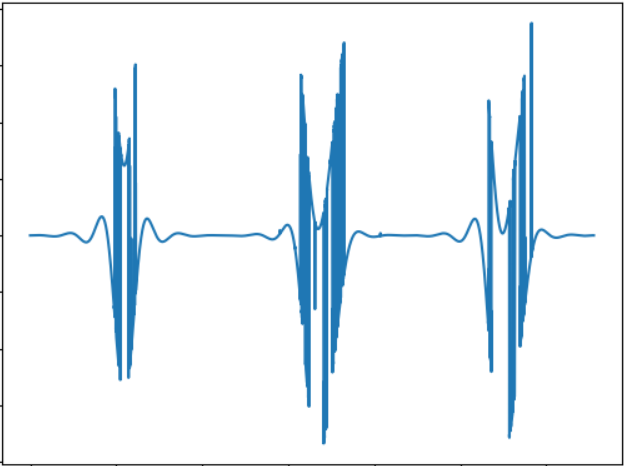
Test 3

The test idea is to test a smaller object. Sound signal:
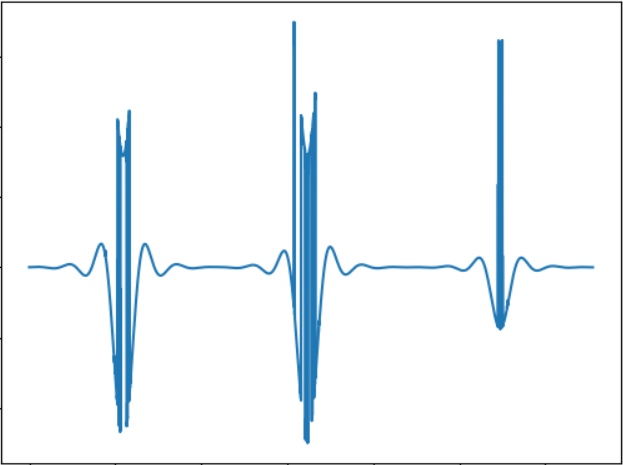
Wav : cloud.mail.ru/public/5GLV/2HoCHvoaY
In principle, the smaller the object's size, the smaller the “bursts” in the sound will be, so the dependence here is quite straightforward.
Edit:
As suggested in the comments, you can use the Fourier transform to directly convert the image into sound. A quick test shows the following results (pictures are the same):
Test-1: cloud.mail.ru/public/2C5Z/5MEQ8Swjo
Test-2: cloud.mail.ru/public/2dxp/3sz8mjAib
Test-3: cloud.mail.ru/public/3NjJ/ZYrfdTYrk
Tests sound interesting, at least for small and large squares (files 1 and 3), the difference in hearing is clearly noticeable. But the shape of the figures (1 and 2) is almost the same, so here too there is something to think about. But in general, the sound received using FFT, I like the ear more.
This test, of course, is not a dissertation, but simply a proof of concept, made in a few hours of free time. But even so, it basically works, and the difference in hearing is quite real. I do not know whether it is possible to learn to navigate in space with such sounds, hypothetically probably after some training. Although there is a huge field for improvements and experiments, for example, you can use stereo sound, which will allow you to better separate objects from different sides, you can experiment with other ways of converting an image into sound, for example, encode a color with different frequencies, etc. Finally, the promising use of 3d-cameras capable of perceiving depth (alas, there is no such camera available). By the way, with the help of a simple code on OpenCV, the above algorithm can be adapted to the use of a web-camera, which will allow you to experiment with dynamic images.
Well, as usual, all successful experiments.
A recent publication here on the site described a device that allows blind people to "see" the image, transforming it with the help of sound waves. From a technical point of view, in that article there were no details at all (
')
What came out of it, the details and examples of files under the cut.
Convert 2D to 1D
The first obvious task that awaits us is to transform a two-dimensional “flat” image into a “one-dimensional” sound wave. As suggested in the comments to that article, it is convenient to use the Hilbert curve for this.
It is essentially similar to a fractal, and the idea is that when you increase the image resolution, the relative position of objects does not change (if the object was in the upper left corner of the picture, then it will remain there ). Different dimensions of the Hilbert curves can give us different images: 32x32 for N = 5, 64x64 for N = 6, and so on. “Bypassing” the image along this curve, we get a line, a one-dimensional object.
The next question is the size of the picture. Intuitively, I want to take a larger image, but there is a big “but”: even the picture is 512x512, this is 262144 pixels. If we transform each point into a sound pulse, then at a sampling rate of 44100, we get a sequence that is as long as 6 seconds, and this is too long - the images should be updated quickly, for example using a webcam. It makes no sense to make the sampling rate higher, we will get ultrasonic frequencies that are inaudible by the ear (although it may and will work for an owl or a bat). As a result, the resolution of 128x128 was chosen
Image processing
The first step is to load the image, convert it to b / w and scale it to the desired size. Image size depends on the dimension of the Hilbert curve.
from PIL import Image from hilbertcurve.hilbertcurve import HilbertCurve import numpy as np from scipy.signal import butter, filtfilt # Create Hilbert curve dimension = 7 hilbert = HilbertCurve(dimension, n=2) print("Hilbert curve dimension:", dimension) # Maximum distance along curve print("Max_dist:", hilbert.max_h) # Maximum distance along curve print("Max_coord:", hilbert.max_x) # Maximum coordinate value in any dimension # Load PIL image f_name = "image01.png" img = Image.open(f_name) width, height = img.size out_size = hilbert_curve.max_x + 1 if width != out_size: img = img.resize((out_size, out_size), Image.ANTIALIAS) # Get image as grayscale numpy array img_grayscale = img.convert(mode='L') img_data = np.array(img_grayscale) The next step is to form a sound wave. Here, of course, there can be a great variety of algorithms and know-how, for the test I just took the brightness component. Of course, there are certainly better ways.
width, height = img_grayscale.size sound_data = np.zeros(width*height) for ii in range(width*height): coord_x, coord_y = hilbert_curve.coordinates_from_distance(ii) pixel_l = img_data[coord_x][coord_y] # Inverse colors (paper-like, white = 0, black = 255) pixel_l = 255 - pixel_l # Adjust values 0..255 to 0..8192 ampl = pixel_l*32 sound_data[ii] = ampl From the code, I hope everything is clear. The coordinates_from_distance function does all the work for us to transform the coordinates (x, y) into the distance on the Hilbert curve, we invert and convert the brightness value L to color.
That's not all. Because There may be large blocks of the same color in the image, this may lead to the appearance of “dc-components” in the sound - a long series of non-zero values, for example [100,100,100, ...]. To remove them, apply to our array of high-pass filter ( Butterworth filter ) with a cut-off frequency of 50 Hz (coincidence with the frequency of the network randomly). The synthesis of filters is in the scipy library, which we will use.
def butter_highpass(cutoff, fs, order=5): nyq = 0.5 * fs normal_cutoff = cutoff / nyq b, a = butter(order, normal_cutoff, btype='high', analog=False) return b, a def butter_highpass_filter(data, cutoff, fs, order=5): b, a = butter_highpass(cutoff, fs, order) y = filtfilt(b, a, data) return y # Apply high pass filter to remove dc component cutoff_hz = 50 sample_rate = 44100 order = 5 wav_data = butter_highpass_filter(sound_data, cutoff_hz, sample_rate, order) The last step is to save the image. Because the length of one impulse is short, we repeat it 10 times, it will be by ear more close to a real repeating image, for example, from a webcam.
# Clip data to int16 range sound_output = np.clip(wav_data, -32000, 32000).astype(np.int16) # Save repeat = 10 sound_output_ntimes = np.tile(sound_output, repeat) wav_name = "ouput.wav" scipy.io.wavfile.write(wav_name, sample_rate, sound_output_ntimes) results
The above algorithm is, of course, quite primitive. I wanted to check three points - how much can be distinguished between different simple figures, and how much can one estimate the distance to the figures.
Test 1
The image corresponds to the following audio signal:
Wav : cloud.mail.ru/public/nt2R/2kwBvyRup
Test 2
The idea of this test is to compare the “sound” of an object of another form. Sound signal:
Wav : cloud.mail.ru/public/2rLu/4fCNRxCG2
You may notice that the sound is really different, and there is a difference in the ear.
Test 3
The test idea is to test a smaller object. Sound signal:
Wav : cloud.mail.ru/public/5GLV/2HoCHvoaY
In principle, the smaller the object's size, the smaller the “bursts” in the sound will be, so the dependence here is quite straightforward.
Edit:
As suggested in the comments, you can use the Fourier transform to directly convert the image into sound. A quick test shows the following results (pictures are the same):
Test-1: cloud.mail.ru/public/2C5Z/5MEQ8Swjo
Test-2: cloud.mail.ru/public/2dxp/3sz8mjAib
Test-3: cloud.mail.ru/public/3NjJ/ZYrfdTYrk
Tests sound interesting, at least for small and large squares (files 1 and 3), the difference in hearing is clearly noticeable. But the shape of the figures (1 and 2) is almost the same, so here too there is something to think about. But in general, the sound received using FFT, I like the ear more.
Conclusion
This test, of course, is not a dissertation, but simply a proof of concept, made in a few hours of free time. But even so, it basically works, and the difference in hearing is quite real. I do not know whether it is possible to learn to navigate in space with such sounds, hypothetically probably after some training. Although there is a huge field for improvements and experiments, for example, you can use stereo sound, which will allow you to better separate objects from different sides, you can experiment with other ways of converting an image into sound, for example, encode a color with different frequencies, etc. Finally, the promising use of 3d-cameras capable of perceiving depth (alas, there is no such camera available). By the way, with the help of a simple code on OpenCV, the above algorithm can be adapted to the use of a web-camera, which will allow you to experiment with dynamic images.
Well, as usual, all successful experiments.
Source: https://habr.com/ru/post/458962/
All Articles