JVM TI: how to make a plugin for a virtual machine

Would you like to add some useful feature to the JVM? Theoretically, each developer can contribute to OpenJDK, however, in practice, any non-trivial changes in HotSpot are not very readily accepted from the side, and even with the current shortened release cycle, it may take years before JDK users see your feature.
However, in some cases it is possible to expand the functionality of a virtual machine without even touching its code. The JVM Tool Interface, the standard API for interacting with the JVM, helps in this.
')
In this article, I will show you with concrete examples what can be done with it, tell you what has changed in Java 9 and 11, and honestly warn you about difficulties (spoiler: you have to deal with C ++).
I also told this material at the JPoint. If you prefer video, you can watch the video report.
Introduction
The Odnoklassniki social network, where I work as a lead engineer, is almost entirely written in Java. But today I will tell just about the other part, which is not entirely in Java.
As you know, the most popular problem with Java developers is NullPointerException. Once, while on duty on the portal, I also stumbled upon NPE in production. The error was accompanied by something like this stack-trace:
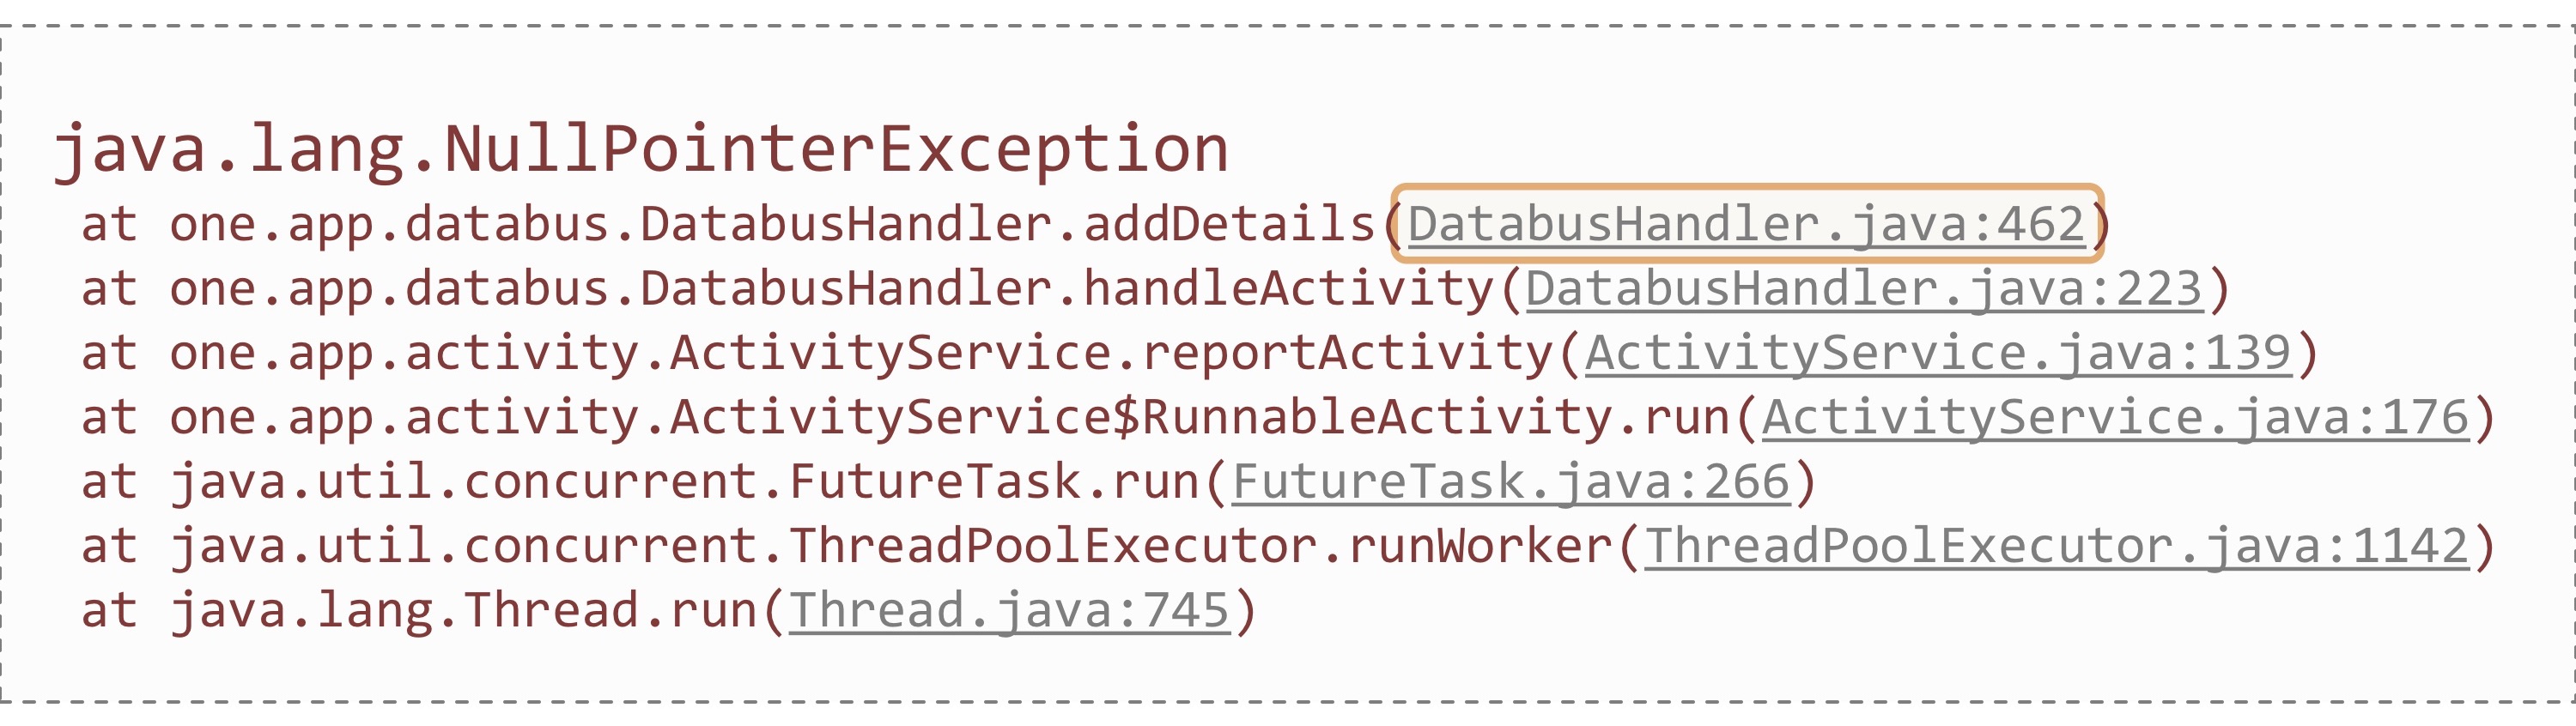
Of course, by the stack-trace you can trace the place of occurrence of an exception up to a specific line in the code. Only in this case it didn’t make me feel better, because here the NPE can meet a lot of places:
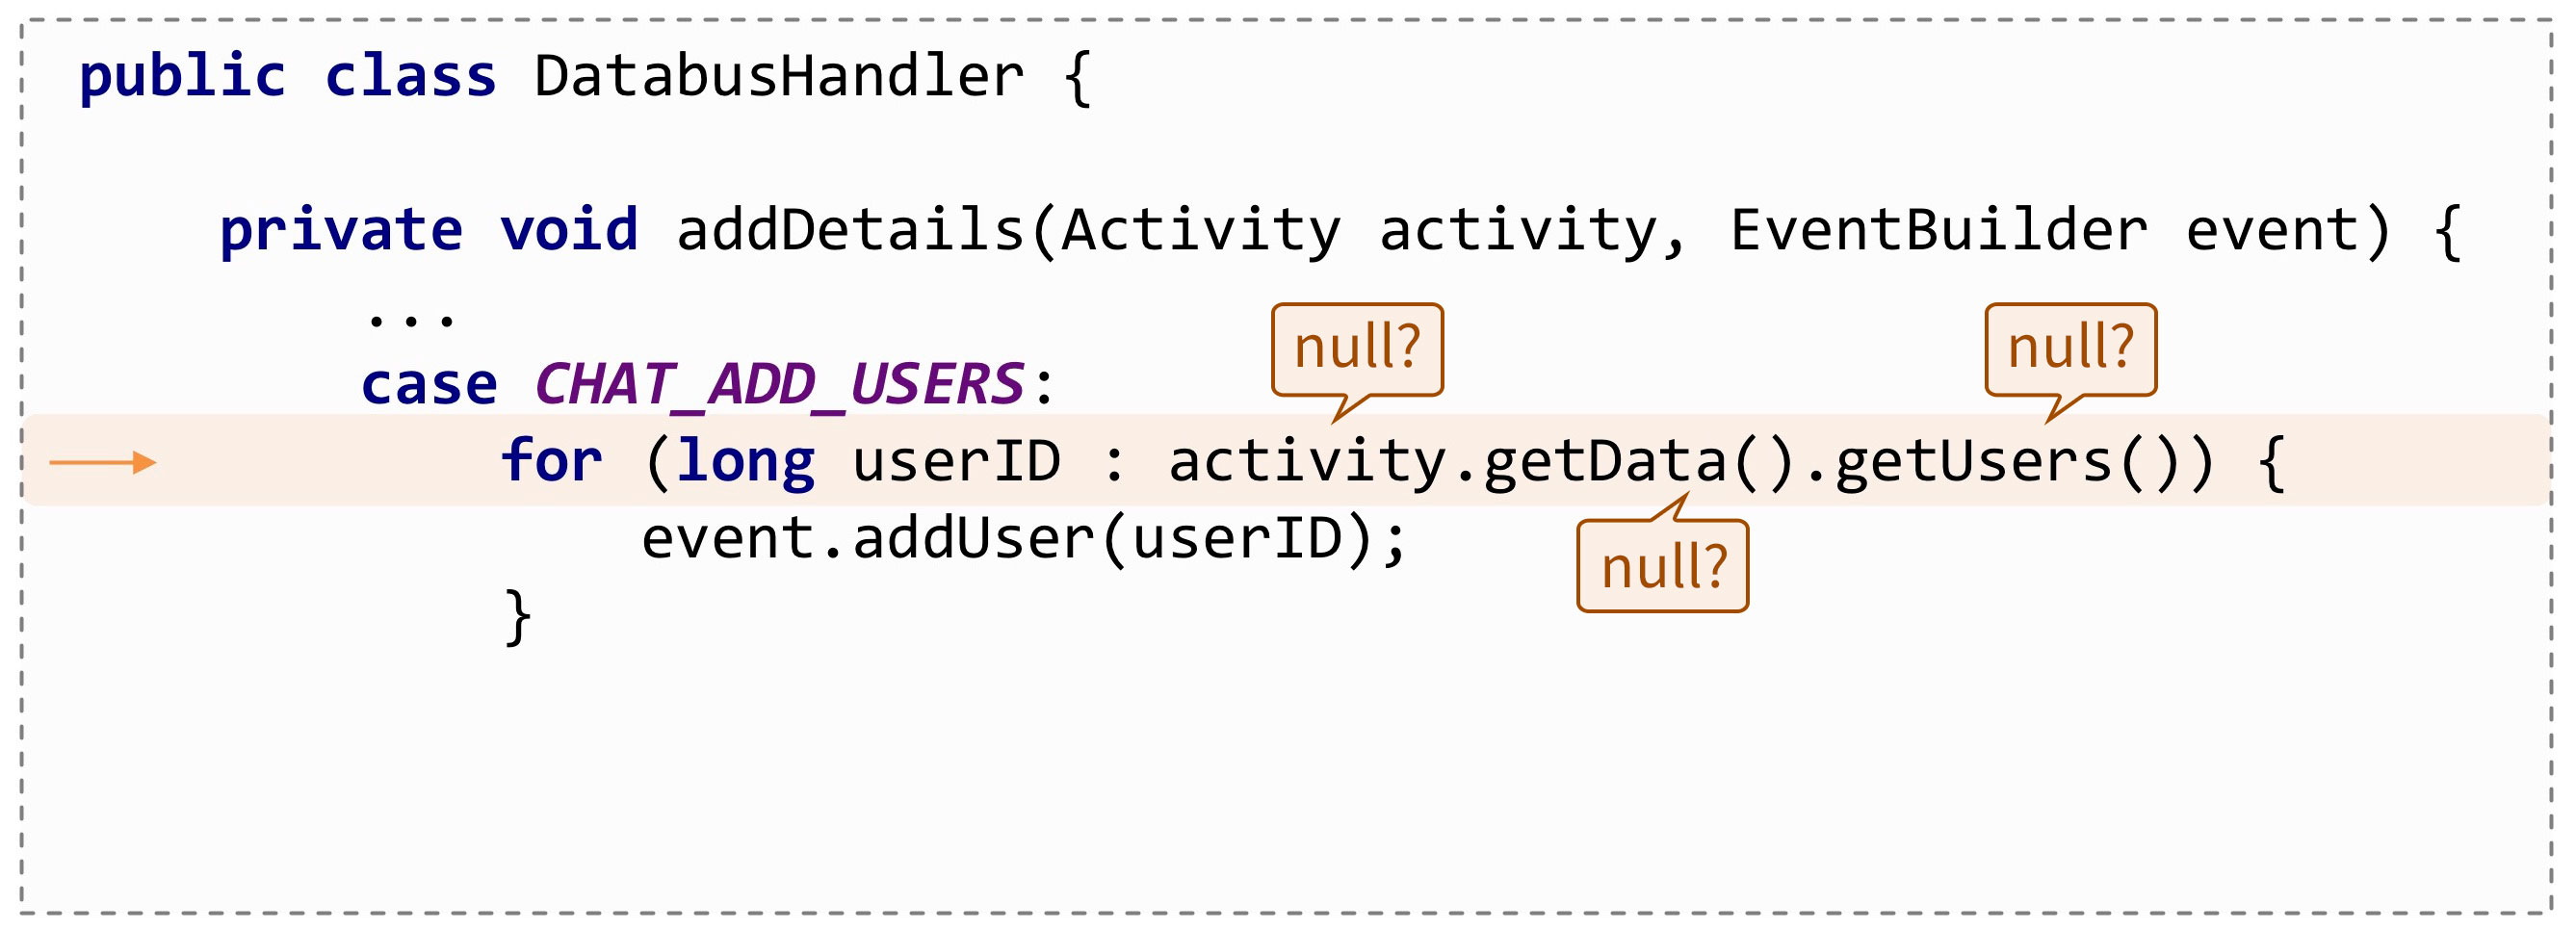
It would be great if the JVM suggested exactly where this error was, like this:
java.lang.NullPointerException: Called 'getUsers()' method on null objectBut, unfortunately, now NPE does not contain anything like this. Although they have been asking for this for a long time, at least with Java 1.4: this bug is already 16 years old. Periodically, more and more new bugs on this topic were opened, but they were invariably closed as “Won't Fix”:

This is not happening everywhere. Volker Simonis from SAP told how this feature was implemented in SAP JVM long ago and helped out more than once. Another SAP employee once again found a bug in OpenJDK and volunteered to implement a mechanism similar to that in SAP JVM. And, about a miracle, this time the bug was not closed - there is a chance that this feature will be included in JDK 14.
But when will JDK 14 come out yet, and when will we go to it? What to do if you want to explore the problem here and now?
You can, of course, support your fork OpenJDK. The very feature of the NPE report is not so difficult, we could well implement it. But at the same time there will be all the problems of maintaining your own build It would be great to implement the feature once, and then just connect it to any version of the JVM like a plugin. And this is really possible! The JVM has a special API (originally developed for various debuggers and profilers): the JVM Tool Interface.
Most importantly, this API is standard. It has a strict specification , and when implementing a feature in accordance with it, you can be sure that it will work in new versions of the JVM.
To use this interface, you need to write a small (or large, depending on what tasks you have) program. Native: usually written in C or C ++. In the standard JDK
jdk/include/jvmti.h , there is a jdk/include/jvmti.h header file that needs to be jdk/include/jvmti.h .The program is compiled into a dynamic library, and is connected with the
-agentpath parameter during the start of the JVM. It is important not to confuse it with another similar parameter: -javaagent . In fact, Java agents are a special case of TI agent JVMs. Further in the text, the word "agent" refers to the native agent.Where to begin
Let's take a practical look at how to spell the simplest JVM TI-agent, a kind of “hello world”.
#include <jvmti.h> #include <stdio.h> JNIEXPORT jint JNICALL Agent_OnLoad(JavaVM* vm, char* options, void* reserved) { jvmtiEnv* jvmti; vm->GetEnv((void**) &jvmti, JVMTI_VERSION_1_0); char* vm_name = NULL; jvmti->GetSystemProperty("java.vm.name", &vm_name); printf("Agent loaded. JVM name = %s\n", vm_name); fflush(stdout); return 0; } The first line I connect the same header file. Next comes the main function that you need to implement in the agent:
Agent_OnLoad() . It is caused by the virtual machine itself when the agent is loaded, passing a pointer to a JavaVM* object JavaVM* .Using it, you can get a pointer to the JVM TI environment:
jvmtiEnv* . And through him, in turn, already call JVM TI-functions. For example, using GetSystemProperty to read the value of a system property.If now I run this “hello world” by passing the compiled dll file to
-agentpath , then the line printed by our agent will appear in the console before the Java program starts to run:
NPE enrichment
Since “hello world” is not the most interesting example, let's return to our exceptions. The full code of the agent supplementing NPE reports is on GitHub .
This is what
Agent_OnLoad() looks like if I want to ask the virtual machine to notify us about all exceptions: JNIEXPORT jint JNICALL Agent_OnLoad(JavaVM* vm, char* options, void* reserved) { jvmtiEnv* jvmti; vm->GetEnv((void**) &jvmti, JVMTI_VERSION_1_0); jvmtiCapabilities capabilities = {0}; capabilities.can_generate_exception_events = 1; jvmti->AddCapabilities(&capabilities); jvmtiEventCallbacks callbacks = {0}; callbacks.Exception = ExceptionCallback; jvmti->SetEventCallbacks(&callbacks, sizeof(callbacks)); jvmti->SetEventNotificationMode(JVMTI_ENABLE, JVMTI_EVENT_EXCEPTION, NULL); return 0; } First, I request the appropriate capability (can_generate_exception_events) from the JVM TI. We'll talk more about capability separately.
The next step is to subscribe to the Exception event. Whenever a JVM throws exceptions (whether caught or not), our
ExceptionCallback() function will be called.The final step is to call
SetEventNotificationMode() to turn on notification delivery.The ExceptionCallback JVM passes everything we need to handle exceptions.
void JNICALL ExceptionCallback(jvmtiEnv* jvmti, JNIEnv* env, jthread thread, jmethodID method, jlocation location, jobject exception, jmethodID catch_method, jlocation catch_location) { jclass NullPointerException = env->FindClass("java/lang/NullPointerException"); if (!env->IsInstanceOf(exception, NullPointerException)) { return; } jclass Throwable = env->FindClass("java/lang/Throwable"); jfieldID detailMessage = env->GetFieldID(Throwable, "detailMessage", "Ljava/lang/String;"); if (env->GetObjectField(exception, detailMessage) != NULL) { return; } char buf[32]; sprintf(buf, "at location %id", (int) location); env->SetObjectField(exception, detailMessage, env->NewStringUTF(buf)); } Here there is both the thread object that threw the exception (thread), and the place where it happened (method, location), and the exception object itself (exception), and even that place in the code that will catch this exception (catch_method, catch_location).
What is important: in this callback, in addition to the pointer to the JVM TI environment, the JNI environment (env) is also transmitted. This means that we can use all JNI functions in it. That is, JVM TI and JNI perfectly coexist, complementing each other.
In my agent, I use both. In particular, through JNI I check that my exception is of type
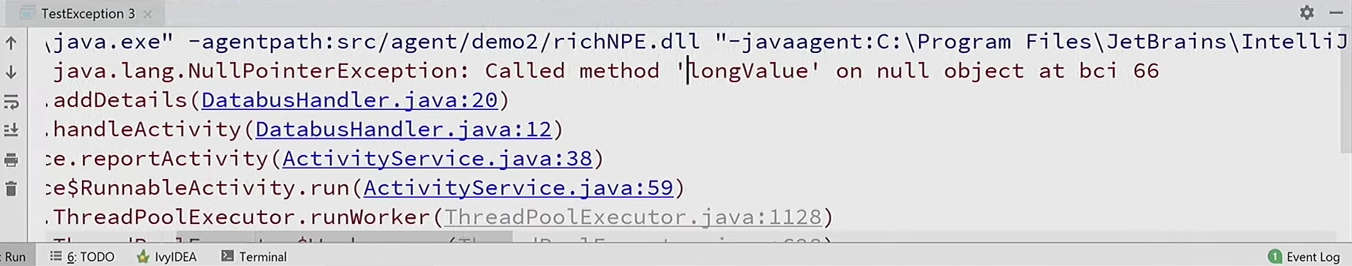
NullPointerException , and then I substitute the detailMessage field detailMessage an error message.Since the JVM itself sends the location to us - the bytecode index on which the exception occurred, I’m just here and added this location to the message:

The number 66 indicates the bytecode index where this exception occurred. But it’s hard to analyze bytecode manually: you need to decompile the class file, look for the 66th instruction, try to understand what it did ... It would be great if our agent could show something more human-readable.
However, in the JVM TI and in this case there is everything that is needed. True, you have to request additional features of the JVM TI: get bytecode and constant pool method.
jvmtiCapabilities capabilities = {0}; capabilities.can_generate_exception_events = 1; capabilities.can_get_bytecodes = 1; capabilities.can_get_constant_pool = 1; jvmti->AddCapabilities(&capabilities); Now I’ll extend the ExceptionCallback: via the JVM TI function
GetBytecodes() I get the method body to check what is in it by the location index. Next comes a big switch on bytecode instructions: if this is a call to an array, there will be one error message, if the call to a field is another message, if the method call is third, and so on.ExceptionCallback Code
jint bytecode_count; u1* bytecodes; if (jvmti->GetBytecodes(method, &bytecode_count, &bytecodes) != 0) { return; } if (location >= 0 && location < bytecode_count) { const char* message = get_exception_message(bytecodes[location]); if (message != NULL) { ... env->SetObjectField(exception, detailMessage, env->NewStringUTF(buf)); } } jvmti->Deallocate(bytecodes); It remains only to substitute the name of the field or method. You can get it from the constant pool , which is available again thanks to the JVM TI.
if (jvmti->GetConstantPool(holder, &cpool_count, &cpool_bytes, &cpool) != 0) { return strdup("<unknown>"); } Next comes a bit of magic, but in reality, nothing tricky, just in accordance with the specification of the file class file, we analyze the constant pool and from there isolate the line - the name of the method.
Analysis of the constant pool
u1* ref = get_cpool_at(cpool, get_u2(bytecodes + 1)); // CONSTANT_Fieldref u1* name_and_type = get_cpool_at(cpool, get_u2(ref + 3)); // CONSTANT_NameAndType u1* name = get_cpool_at(cpool, get_u2(name_and_type + 1)); // CONSTANT_Utf8 size_t name_length = get_u2(name + 1); char* result = (char*) malloc(name_length + 1); memcpy(result, name + 3, name_length); result[name_length] = 0; Another important point: some JVM TI functions, for example,
GetConstantPool() or GetBytecodes() , allocate a certain structure in the native memory that needs to be released after working with it. jvmti->Deallocate(cpool); Let's run the source program with our extended agent, and now a completely different description of the exception: it reports that we called the longValue () method on the null object.
Other uses
Generally speaking, developers often want to handle exceptions in their own way. For example, automatically restart the JVM if a
StackOverflowError occurred.This desire can be understood, since
StackOverflowError is the same fatal error as OutOfMemoryError , after its occurrence, the correct operation of the program can no longer be guaranteed. Or, for example, sometimes to analyze a problem, I want to receive a thread dump or heap dump when an exception occurs.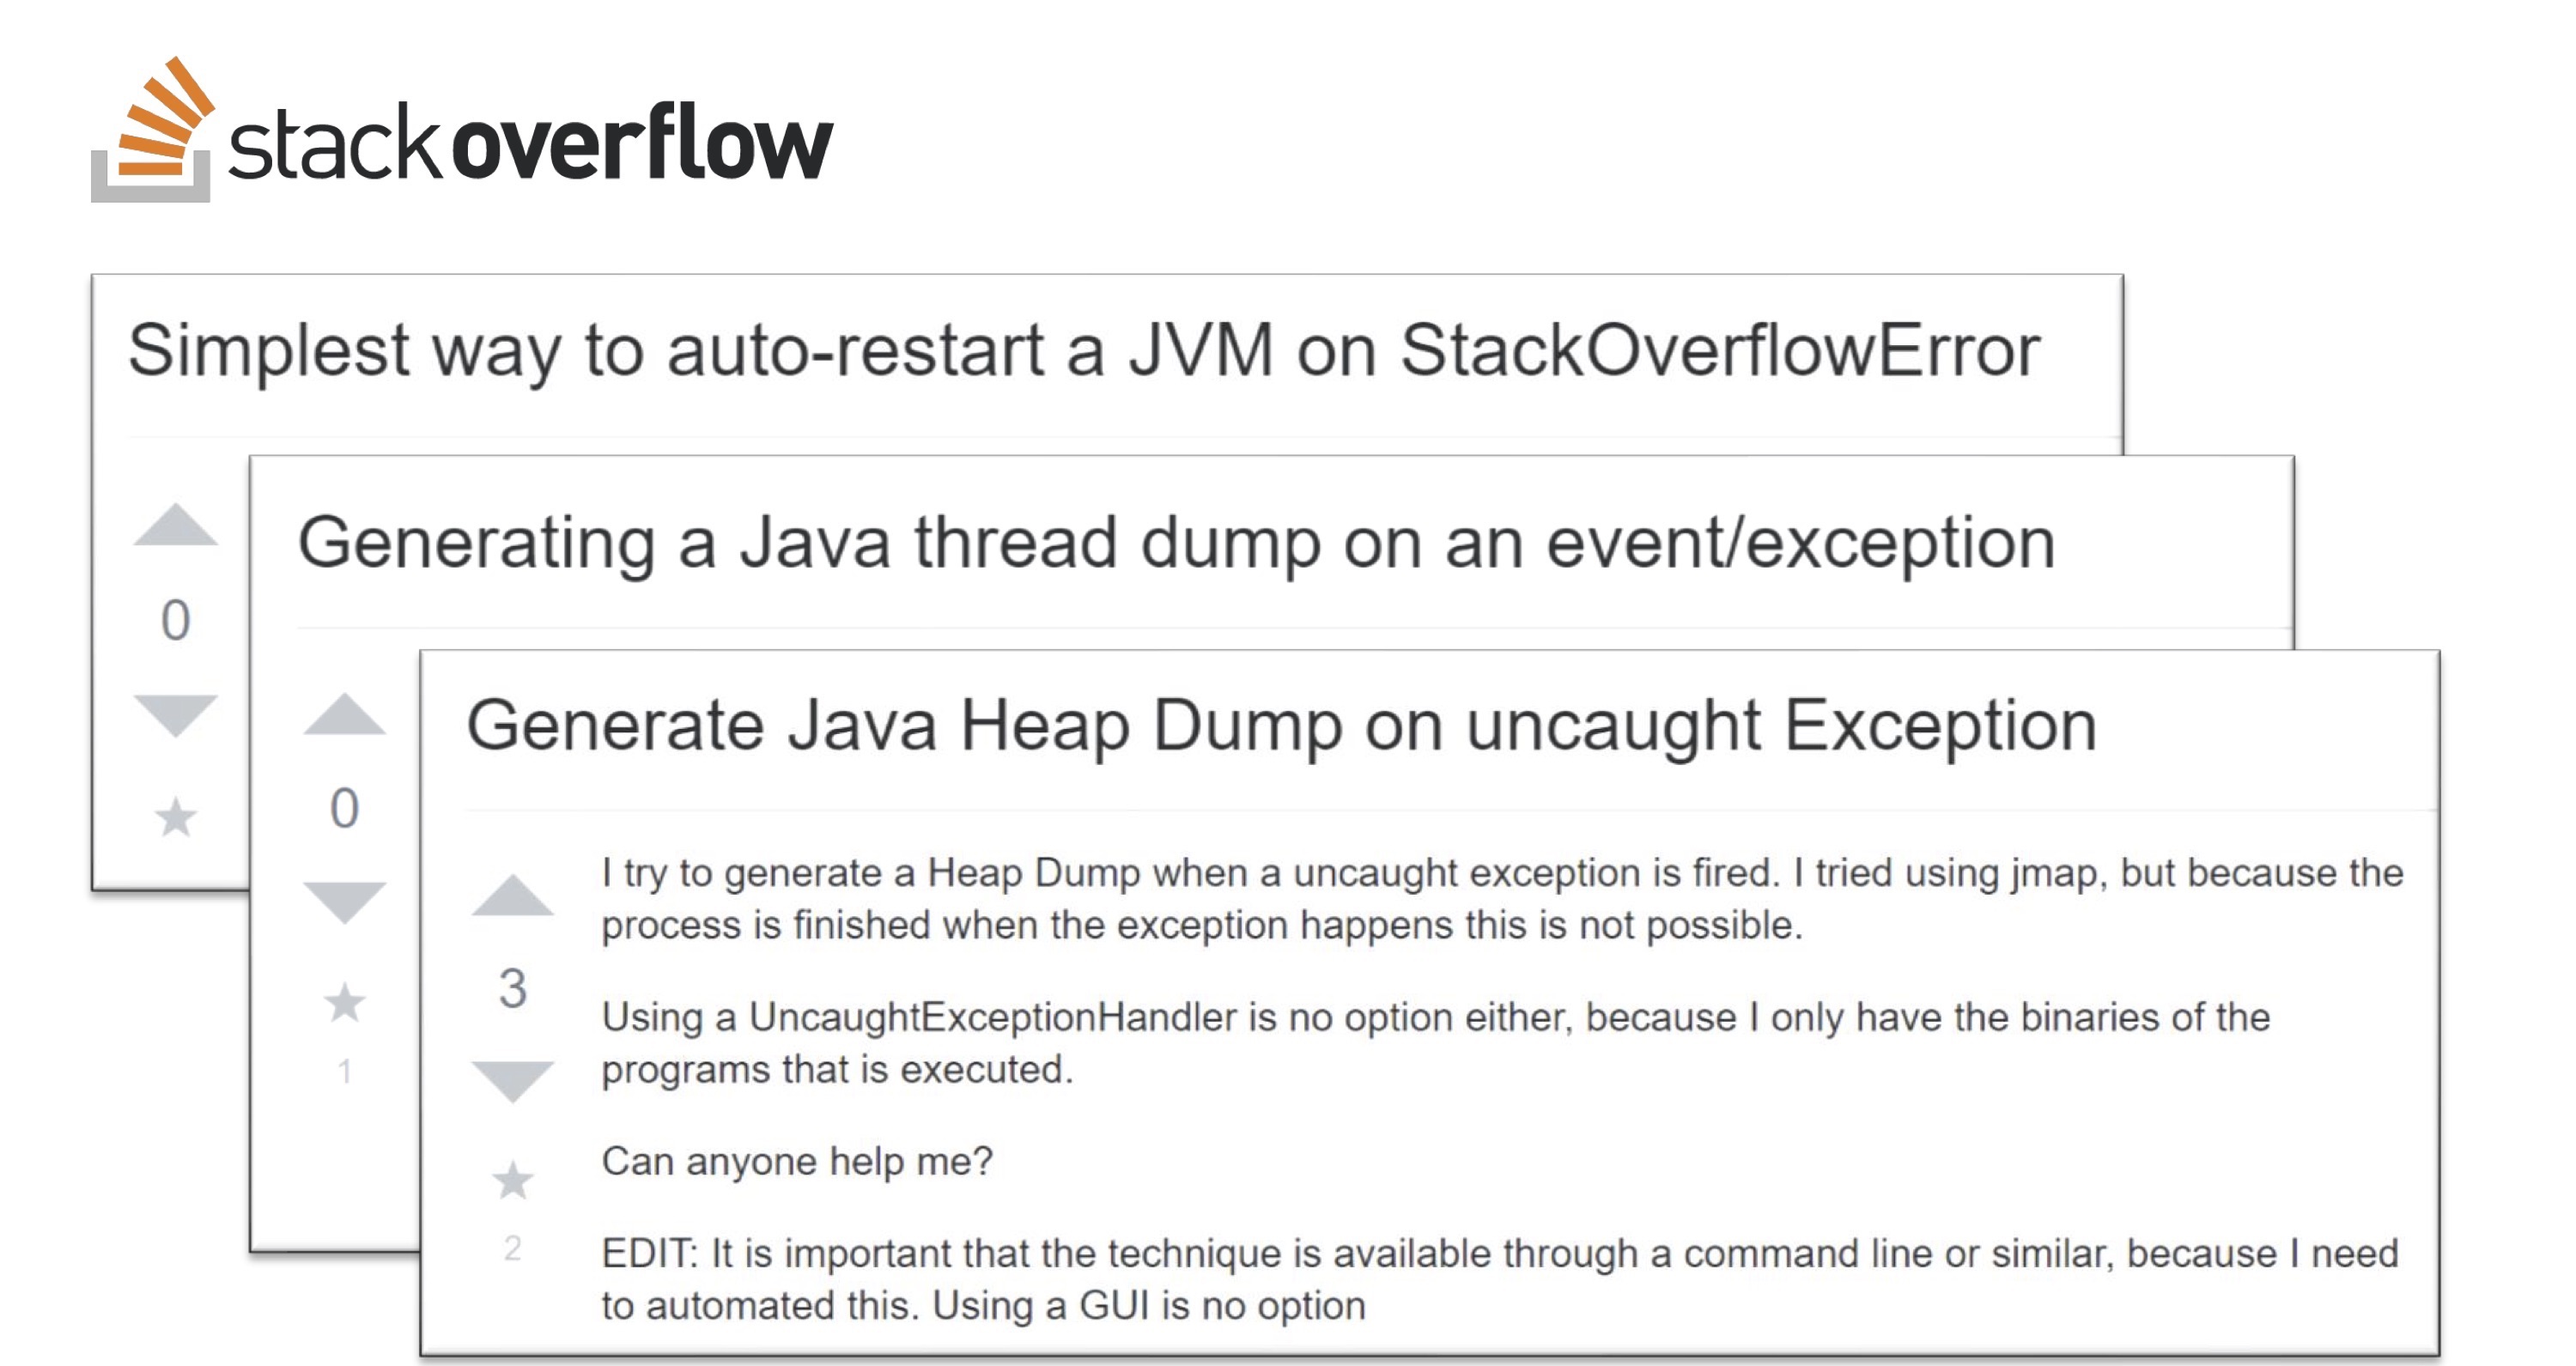
In fairness, IBM JDK has such an opportunity out of the box. But now we already know that using a TI agent JVM, you can implement the same thing in HotSpot. Just subscribe to exception callback and analyze the exception. But how to remove a thread dump or heap dump from our agent? The JVM TI has everything you need in this case:

It’s not very convenient to implement the whole hip bypass and dumping mechanism. But I will share the secret of how to make it easier and faster. True, it is no longer included in the standard JVM TI, but is a private extension of Hotspot.
You need to connect the header file jmm.h from the HotSpot sources and call the
JVM_GetManagement() function: #include "jmm.h" JNIEXPORT void* JNICALL JVM_GetManagement(jint version); void JNICALL ExceptionCallback(jvmtiEnv* jvmti, JNIEnv* env, ...) { JmmInterface* jmm = (JmmInterface*) JVM_GetManagement(JMM_VERSION_1_0); jmm->DumpHeap0(env, env->NewStringUTF("dump.hprof"), JNI_FALSE); } It will return a pointer to the HotSpot Management Interface, which in one call will generate a Heap Dump or Thread Dump. The complete example code can be viewed in my response to Stack Overflow.
Naturally, you can handle not only exceptions, but also a bunch of other various events related to JVM operation: starting / stopping threads, loading classes, garbage collection, compiling methods, entering / exiting methods, even accessing or modifying specific fields of Java objects.
I have an example of another vmtrace agent that subscribes to many standard JVM TI events and logs them. If I start a simple program with this agent, I will receive a detailed log of what was done with timestamps:
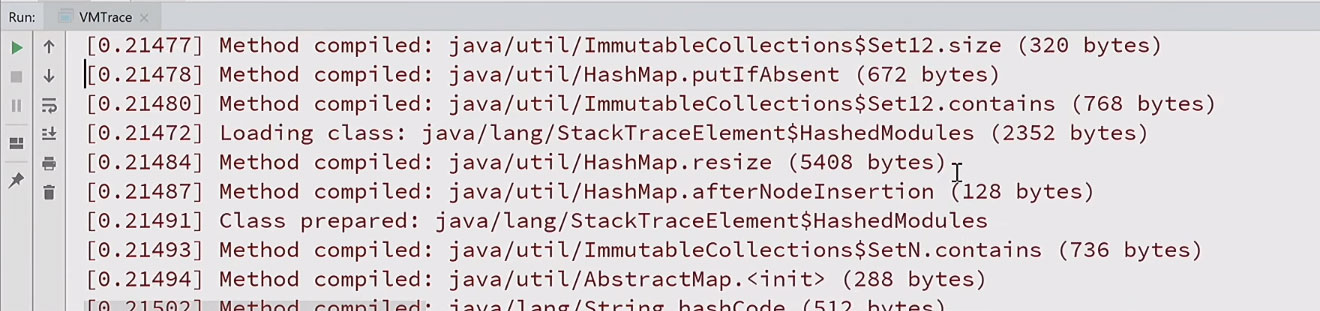
As you can see, to simply print hello world, hundreds of classes are loaded, tens and hundreds of methods are generated and compiled. It becomes clear why Java runs so long. All about everything took more than two hundred milliseconds.
What can JVM TI
In addition to event handling in the JVM TI there are a bunch of other features. They can be divided into two groups.
One is a must-have that any JVM supporting TI JVM must implement. These include the analysis of methods, fields, streams, the ability to add new classes to the classpath, and so on.
There are optional features that require prior request for capabilities. The JVM is not required to support them all, however HotSpot implements the entire specification completely. Optional features are further divided into two subgroups: those that can only be connected at the start of the JVM (for example, the ability to set a breakpoint or analysis of local variables), and those that can be connected at any time (in particular, receiving bytecode or constant pool, which I used above).

You may notice that the feature list is very similar to the debugger features. In fact, a Java debugger is nothing more than a special case of a TI agent JVM that takes advantage of all these capabilities and requests all of its capabilities.
The division of capabilities into those that can be enabled at any time, and those that are only at boot, is done on purpose. Not all features are free, some carry overhead.
If with direct overheads that accompany the use of the feature, everything is clear, that is, even less obvious indirect ones that manifest themselves, even if you do not use the feature, but simply, through the capabilities, state that you will need it in the future. This is due to the fact that the virtual machine can compile the code in a different way or add additional checks at runtime.
For example, the already considered capability of subscribing to exceptions (can_generate_exception_events) leads to the fact that all throwing exceptions will go on a slow path. In principle, this is not so bad, because exceptions are rare in a good Java program.
A little worse is the case with local variables. For can_access_local_variables, which allows you to get local variable values at any time, you need to disable some important optimizations. In particular, Escape Analysis stops working completely, which can give a tangible overhead: depending on the application, 5-10%.
Hence the conclusion: if you run Java with the debug agent enabled, even without using it, applications will run slower. Anyway, turning on a debugging agent in production is not a good idea.
And a number of features, for example, setting a breakpoint or tracing all the inputs / outputs from a method, incur much more serious overhead. In particular, some JVM TI events (FieldAccess, MethodEntry / Exit) work only in the interpreter.
One agent is good and two is better.
You can connect multiple agents to the same process by simply specifying several
-agentpath parameters. Everyone will have their own JVM TI environment. This means that everyone can subscribe to their capabilities and intercept their events independently.And if two agents have subscribed to a Breakpoint event, and one has put a breakpoint in some method, will the second agent receive the event when this method is executed?
In reality, this situation cannot arise (at least in the HotSpot JVM). Because there are some capabilities that only one of the agents can own at any one time. These include breakpoint_events in particular. Therefore, if the second agent requests the same capability, it will receive an error in response.
From here an important conclusion: in the agent you should always check the results of the query of capabilities, even if you run on HotSpot and know that they are all available. The TI JVM specification does not say anything about exclusive capabilities, but HotSpot has this implementation feature.
True, the isolation of agents does not always work perfectly. During the development of the async-profiler, I came across such a problem: when we have two agents and one requests the generation of method compilation events, all agents receive these events. I, of course, filed a bug , but it should be borne in mind that there may be events in your agent that you do not expect.
Use in a regular program
The JVM TI may seem like a very specific thing for debuggers and profilers, but it can also be used in a regular Java program. Consider an example.
The paradigm of reactive programming is now common, when everything is asynchronous, but there is a problem with this paradigm.
public class TaskRunner { private static void good() { CompletableFuture.runAsync(new AsyncTask(GOOD)); } private static void bad() { CompletableFuture.runAsync(new AsyncTask(BAD)); } public static void main(String[] args) throws Exception { good(); bad(); Thread.sleep(200); } } I run two asynchronous tasks that differ only in parameters. And if something goes wrong, an exception occurs:
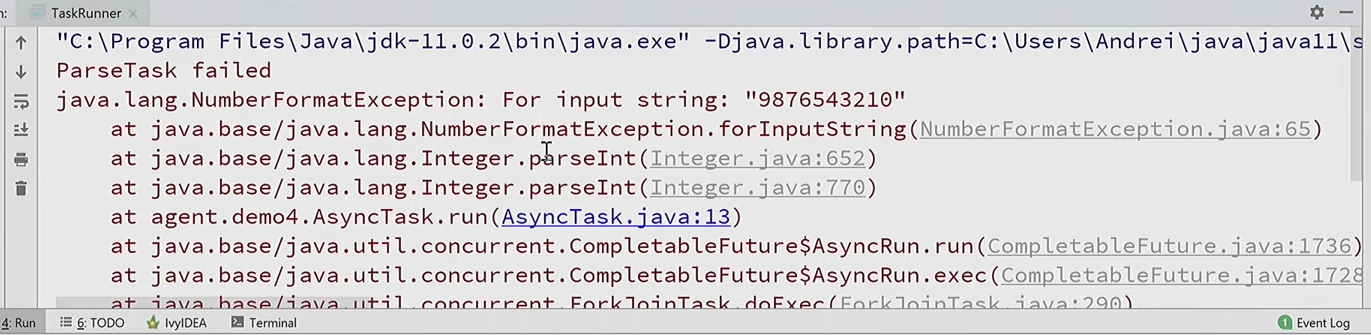
From the stack-trace it is completely incomprehensible which of these tasks caused the problem. Because an exception occurs in a completely different stream, where we have no context. How to understand exactly which task?
As one of the solutions, you can add to the constructor of our asynchronous task information about where we created it:
public AsyncTask(String arg) { this.arg = arg; this.location = getLocation(); } That is, to remember the location - a specific place in the code, up to the line from where the constructor was called. And in the case of an exception, to secure it:
try { int n = Integer.parseInt(arg); } catch (Throwable e) { System.err.println("ParseTask failed at " + location); e.printStackTrace(); } Now, when an exception occurs, we will see that it happened on line 14 in TaskRunner (where the task with the BAD parameter is created):

But how to get that place in the code where the constructor is called from? Before Java 9, there was the only legal way to do this: get the stack trace, skip a few irrelevant frames, and just below the stack will be the place that caused our code.
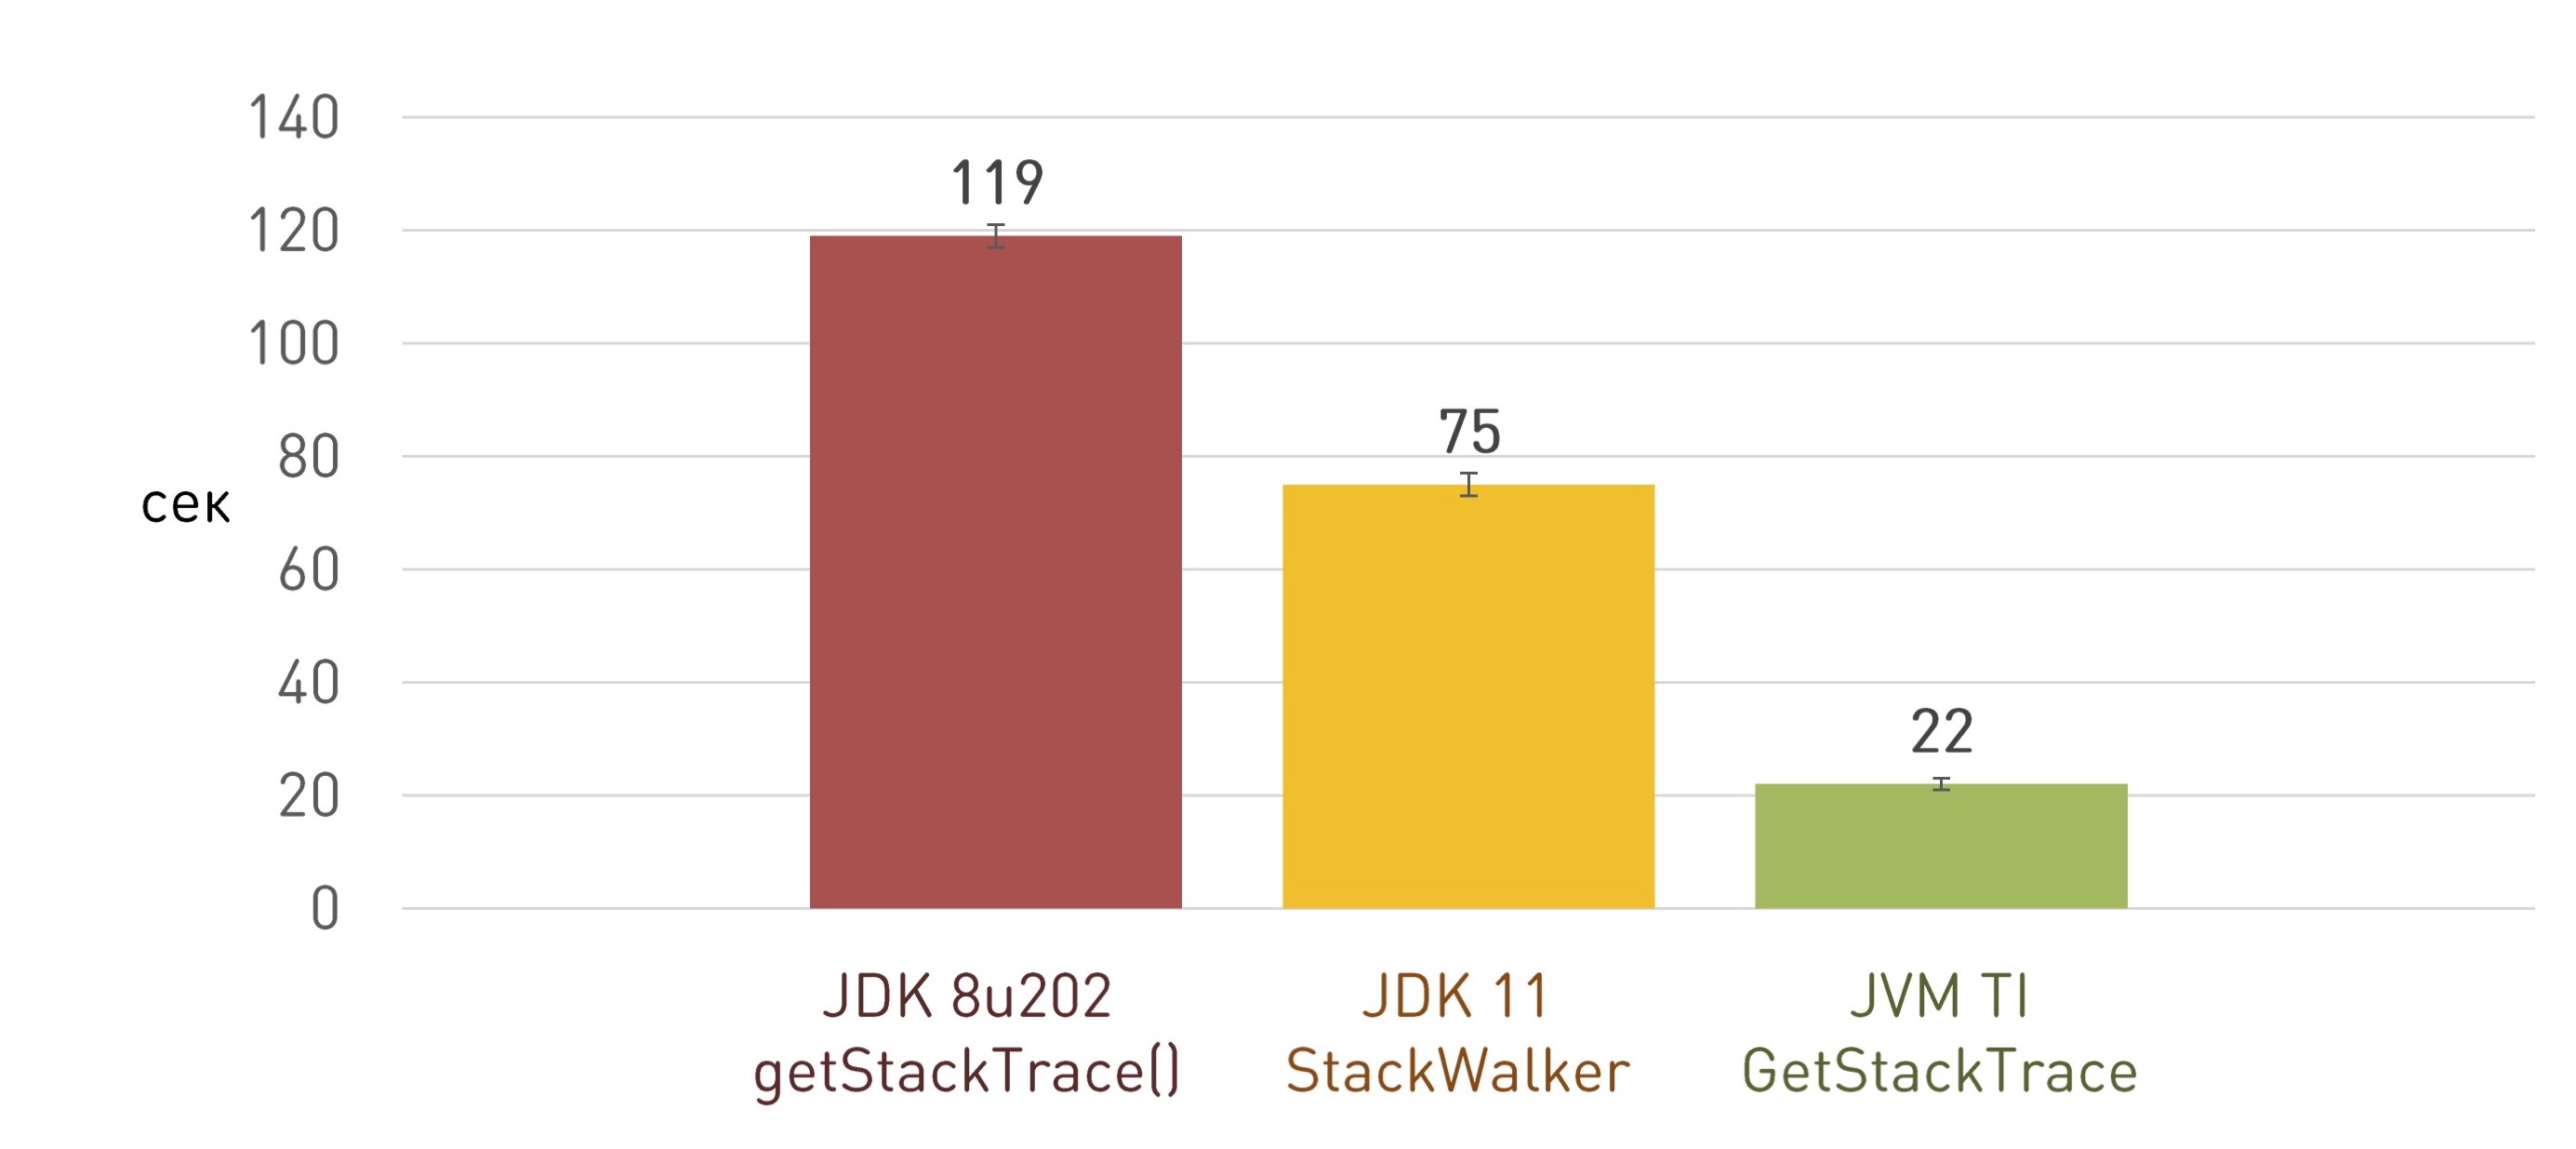
String getLocation() { StackTraceElement caller = Thread.currentThread().getStackTrace()[3]; return caller.getFileName() + ':' + caller.getLineNumber(); } But there is a problem. Getting the full StackTrace is pretty slow. I have a whole report on this .
It would not be such a big problem if it happened rarely. But, for example, we have a web service, a frontend that accepts HTTP requests. This is a great application, millions of lines of code. And to catch rendering errors, we use a similar mechanism: in the components for rendering, we remember the place where they are created. We have millions of such components, so getting all the stack traces takes considerable time at the start of the application, not one minute. Therefore, earlier this feature was disabled in production, although it is necessary in production to analyze problems.
In Java 9, a new way to bypass stream stacks has appeared: StackWalker, which through the Stream API can do all this lazily, upon request. That is, we can skip the required number of frames and get only one of our interest.
String getLocation() { return StackWalker.getInstance().walk(s -> { StackWalker.StackFrame frame = s.skip(3).findFirst().get(); return frame.getFileName() + ':' + frame.getLineNumber(); }); } It works a little better than getting a full stack of the stack, but not by an order of magnitude, and not even at times. In our case, it was faster about half as much:

There is a known problem related to the non-optimal implementation of StackWalker, and, most likely, it will even be fixed in JDK 13. But again, what do we do right now in Java 8, where StackWalker is not even slow?
JVM TI comes to the rescue again. There is a
GetStackTrace() function that can do everything it needs: get a fragment of a setraice of a given length, starting from the specified frame, and not do anything extra. GetStackTrace(jthread thread, jint start_depth, jint max_frame_count, jvmtiFrameInfo* frame_buffer, jint* count_ptr) There is only one question left: how can we call the JVM TI function from our Java program? Just like any other native method: use
System.loadLibrary() load the native library, where the JNI implementation of our method will be. public class StackFrame { public static native String getLocation(int depth); static { System.loadLibrary("stackframe"); } } A pointer to the JVM TI environment can be obtained not only from Agent_OnLoad (), but also while the program is running, and continue to use it from the usual native JNI methods:
JNIEXPORT jstring JNICALL Java_StackFrame_getLocation(JNIEnv* env, jclass unused, jint depth) { jvmtiFrameInfo frame; jint count; jvmti->GetStackTrace(NULL, depth, 1, &frame, &count); This approach works several times faster and allowed us to save a few minutes of launching the application:
True, with the next update of the JDK, a surprise was waiting for us: the application suddenly began to start very, very slowly. The investigation led to the very native library for getting stack-traces. Understanding, we came to the conclusion that the bug did not appear in our country, but in the JDK. Starting with JDK 8u112, all JVM TI functions that work with methods (GetMethodName, GetMethodDeclaringClass, and so on) have become terribly slow.
I started a bug , looked around a bit, and found a funny story: some JVM TI-functions added debug checks, but did not notice that they are called from the production code as well. This usage scenario was not found, because it was not in the C ++ source code, but in the filejvmtiEnter.xsl .
Imagine: during the compilation of HotSpot, part of the source code is generated on the fly through XSLT transformation. This is how the enterprise struck back HotSpot.
What solution can there be? Just do not call these functions too often, try to cache the results. That is, if for some jmethodID received information, remember it locally in your agent. Applying this caching at the agent level, we returned the performance to the previous level.
Dynamic connection
With the previous example, I showed that you can use TI JVM directly from Java code using normal native methods using
System.loadLibrary.In addition, we have already seen how you can connect JVM TI-agents through
-agentpathwhen you start the JVM.And there is a third way: dynamic attach.
What is the idea? If you launched into the application and did not think that you would need some feature in the future, or you suddenly needed to investigate a production bug, you can download the JVM TI agent right during execution.
Starting with JDK 9, this became possible directly from the command line using the jcmd utility:
jcmd <pid> JVMTI.agent_load /path/to/agent.so [arguments] And for older versions of JDK, you can use my jattach utility . For example, async-profiler can connect to applications running without any additional JVM arguments on the fly, thanks to jattach.
In order to take advantage of the possibility of dynamic connection in your JVM TI-agent, you need, in addition
Agent_OnLoad(), to implement a similar function Agent_OnAttach(). The only difference is: Agent_OnAttach()you cannot use those capabilities that are available only during agent loading.It is important to remember that you can dynamically connect the same library several times, so that it
Agent_OnAttach()can be called again.I will demonstrate with an example. In the role of production will be IntelliJ IDEA: this is also a Java application, which means that we can also connect to it on the fly and do something.
Find the process ID of our IDEA, then use the jattach utility to connect the patcher.dll TI library to this process:
jattach 8648 load patcher.dll trueAnd on the fly, it changed the menu color to red:

What does this agent do? Finds all Java objects of the specified class (
javax.swing.AbstractButton) and calls through the JNI method setBackground(). Fully code can be seen here .What's new in java 9
JVM TI has been around for a long time, and, despite existing bugs, there is already a well-established debugged API, which has not changed for a long time. The first significant innovations appeared in Java 9.
As you know, Java 9 brought developers pain and suffering associated with modules. First of all, it has become difficult to use the “secrets” of the JDK, which sometimes can’t be done without.
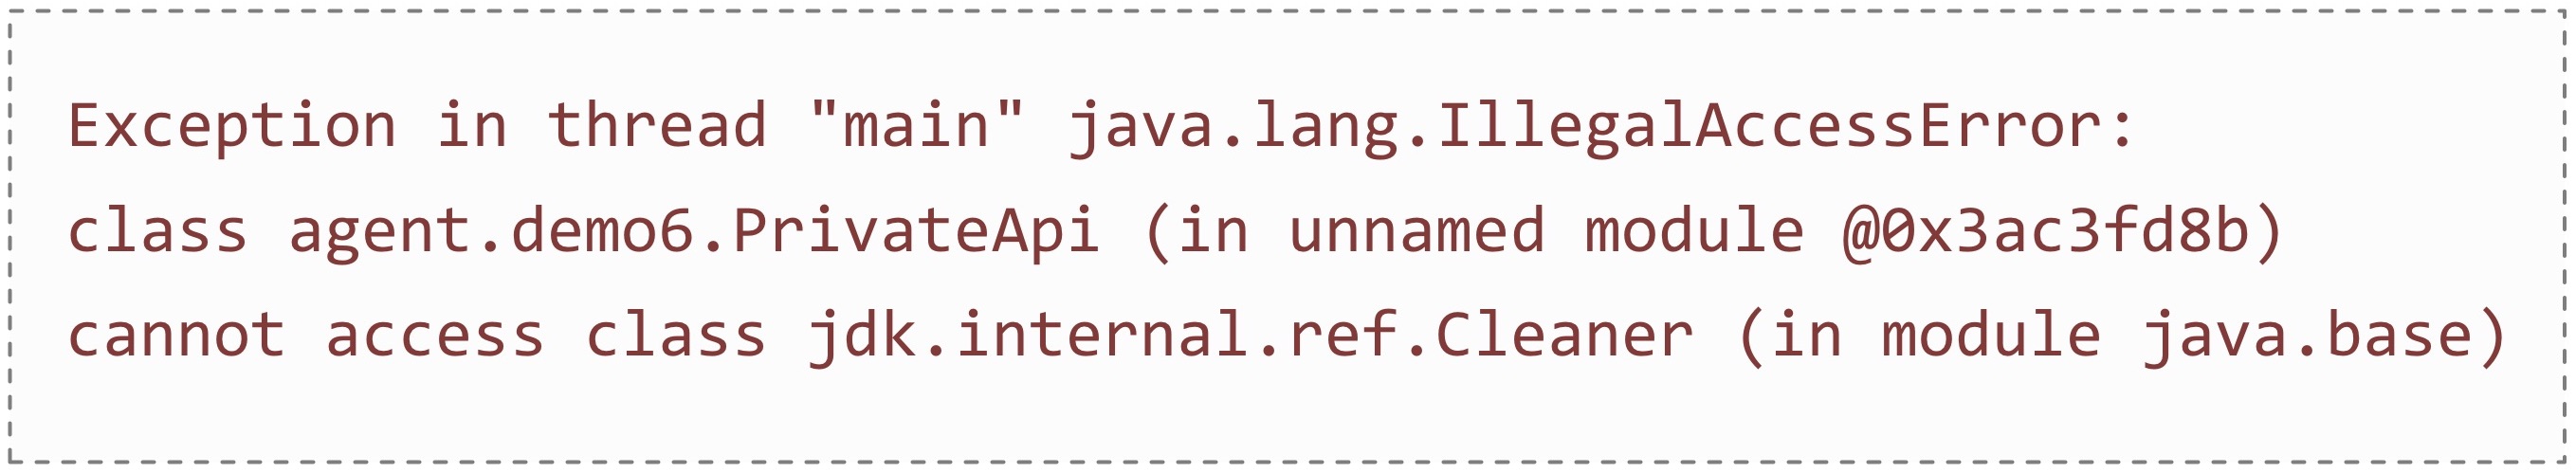
For example, in the JDK there is no legal way to clear the Direct ByteBuffer. Only through a private API:

Say, Cassandra without this feature is nowhere, because all the DBMS work is built on working with MappedByteBuffer, and if they are not manually cleared, the JVM will quickly fall.
And if you try to run the same code on JDK 9, you will get IllegalAccessError:
Approximately the same is true with Reflection: it has become difficult to reach private fields.
For example, in Java, not all file operations from Linux are available. Therefore, for Linux-specific capabilities, programmers took a
java.io.FileDescriptorsystem file descriptor from a reflex from an object and, using JNI, called some system functions on it. And now, if you run it on JDK 9, you will see abuse in the logs: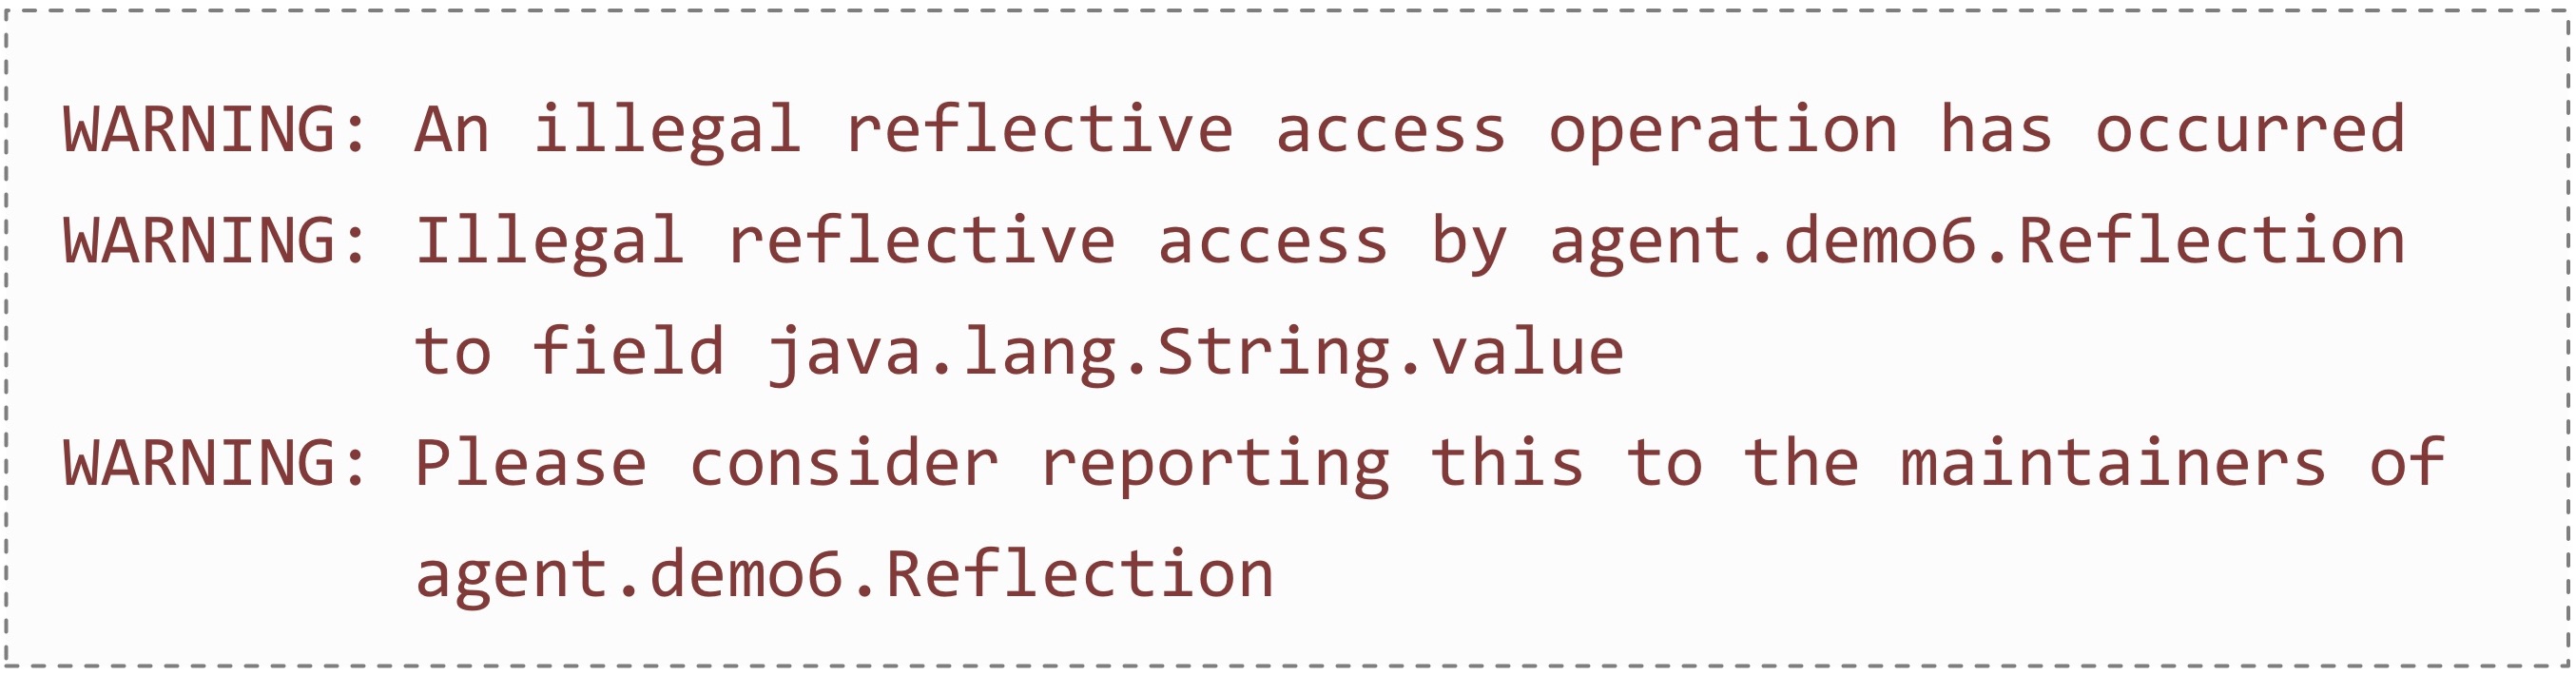
Of course, there are JVM checkboxes that open the necessary private modules and allow you to use private classes and reflection. But you need to manually register all the packages that are going to use. For example, to just run Cassandra on Java 11, you need to prescribe such a panel:
--add-exports java.base/jdk.internal.misc=ALL-UNNAMED --add-exports java.base/jdk.internal.ref=ALL-UNNAMED --add-exports java.base/sun.nio.ch=ALL-UNNAMED --add-exports java.management.rmi/com.sun.jmx.remote.internal.rmi=ALL-UNNAMED --add-exports java.rmi/sun.rmi.registry=ALL-UNNAMED --add-exports java.rmi/sun.rmi.server=ALL-UNNAMED --add-exports java.sql/java.sql=ALL-UNNAMED --add-opens java.base/java.lang.module=ALL-UNNAMED --add-opens java.base/jdk.internal.loader=ALL-UNNAMED --add-opens java.base/jdk.internal.ref=ALL-UNNAMED --add-opens java.base/jdk.internal.reflect=ALL-UNNAMED --add-opens java.base/jdk.internal.math=ALL-UNNAMED --add-opens java.base/jdk.internal.module=ALL-UNNAMED --add-opens java.base/jdk.internal.util.jar=ALL-UNNAMED --add-opens jdk.management/com.sun.management.internal=ALL-UNNAMED However, along with the modules, JVM TI functions appeared to work with them:
- GetAllModules
- AddModuleExports
- AddModuleOpens
- etc.
Looking at this list, the decision suggests itself: you can wait for the JVM to load, get a list of all the modules, run through all the packages, open everything for everyone, and rejoice.
Here is the very example with Direct ByteBuffer:
public static void main(String[] args) { ByteBuffer buf = ByteBuffer.allocateDirect(1024); ((sun.nio.ch.DirectBuffer) buf).cleaner().clean(); System.out.println("Buffer cleaned"); } If we run it without agents, we expect to receive an IllegalAccessError. And if I add an antimodule agent to my agentpath , the example will work without errors. The same with reflexion.
What's new in java 11
Another innovation appeared in Java 11. It is only one, but what a! The possibility of lightweight profiling of allocations has appeared: a new event has been added
SampledObjectAlloc, to which you can subscribe, so that selective notifications about allocations come.Everything that is needed for further analysis will be transferred to the callback: the stream that allocates, the selected object itself, its class, size. Another method
SetHeapSampingIntervalis to change the frequency, how often these notifications will arrive.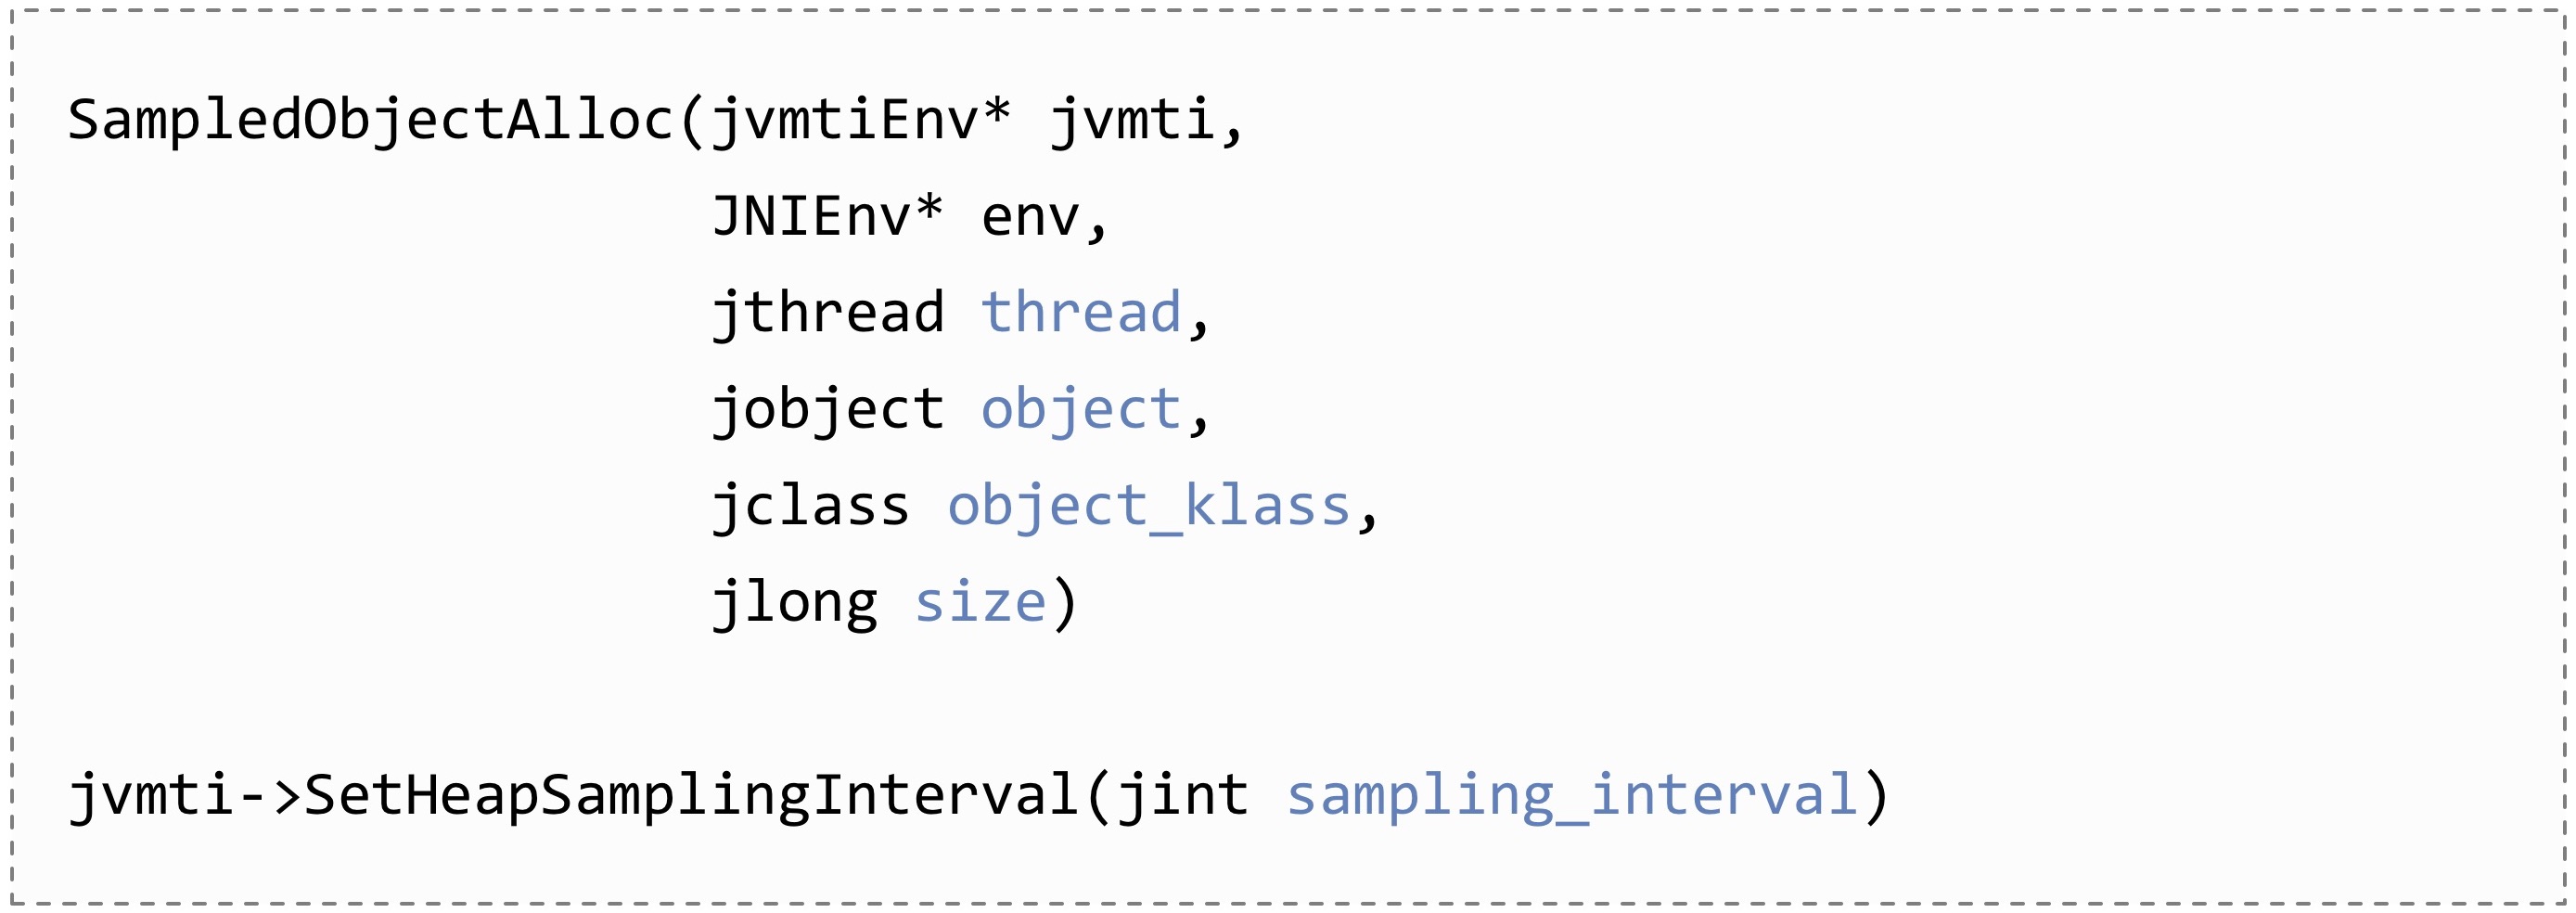
Why do you need it? Allocation profiling was done earlier in all popular profilers, but it worked through instrumentation, which is fraught with large overheads. The only profiling tool with a low overhead was Java Flight Recorder.
The idea of a new method is not to instrument all allocations, but only some of them, in other words, to sample.
In the fastest and most frequent case, allocation occurs inside the Thread Local Allocation Buffer by simply increasing the pointer. And with the inclusion of sampling in TLAB is added to the virtual boundary corresponding to the sampling frequency. As soon as the next location crosses this boundary, an event about the selection of the object is sent.

In some cases, large objects that do not fit into a TLAB are allocated directly in the heap. Such objects also pass through a slow allocation path through the JVM runtime and are also sampled.
Due to the fact that now sampling is performed only for some objects, overhead costs are already acceptable for production - in most cases less than 5%.
Interestingly, this opportunity was a long time ago, since the days of JDK 7, made specifically for Flight Recorder. But through the private API of Hotspot, this was also used by async-profiler. And now, starting with JDK 11, this API has become public, entered into the JVM TI, and other profilers can use it. In particular, YourKit already knows how. And how to use this API, you can see in the example laid out in our repository.
With the help of this profiler you can build beautiful allocation diagrams. Look at what objects stand out, how many of them stand out and, most importantly, from where.

Conclusion
JVM TI is a great way to interact with a virtual machine.
Plug-ins written in C or C ++ can be launched when the JVM is started, or it can be connected dynamically while the application is running. In addition, the application itself can use JVM TI functions through native methods.
All demonstrated examples are posted in our repository on GitHub . Use, study and ask questions.
Source: https://habr.com/ru/post/458812/
All Articles