Zabbix, time series and timescaleDB
Each monitoring system faces three types of performance problems.
First, a good monitoring system must very quickly receive, process and record incoming data from outside. The account goes on microseconds. Offhand this may not seem obvious, but when the system becomes large enough, all these fractions of seconds are summed up, turning into well noticeable delays.
The second task is to provide convenient access to large arrays of previously collected metrics (in other words, to historical data). Historical data is used in many different contexts. According to them, for example, reports and graphs are generated, aggregated checks are built on them, and triggers depend on them. If there are any delays in accessing the history, this immediately affects the speed of the system as a whole.
')
Third, historical data takes up a lot of space. Even relatively modest monitoring configurations quickly acquire a solid history. But hardly anyone wants to keep on hand the history of CPU usage five years ago, so the monitoring system should be able not only to record well, but also to delete the history well (in Zabbix this process is called “housekeeping”). Deleting old data does not have to be as effective as collecting and analyzing new ones, but heavy deletion operations detract from the precious resources of the DBMS and can slow down more critical operations.
The first two problems are solved by caching. Zabbix supports several specialized caches to speed up read and write operations. The mechanisms of the DBMS itself are not suitable here, since even the most advanced general-purpose caching algorithm will not know which data structures require instant access at a given point in time.
All is well as long as the data is in the memory of the Zabbix server. But the memory is not infinite and at some point the data required to write (or read) to the database. And if database performance is seriously lagging behind the speed of collecting metrics, then even the most advanced special caching algorithms will not help for a long time.
The third problem also comes down to database performance. To solve it, you need to choose a reliable deletion strategy that would not interfere with other database operations. By default, Zabbix deletes historical data in batches of several thousand records per hour. You can set up longer periods of housekeeping or larger packet sizes if the speed of data collection and place in the database allows it. But with a very large number of metrics and / or a high frequency of their collection, the correct setting of housekeeping can be a daunting task, since the schedule for deleting data may not keep pace with the pace of recording new ones.
Summarizing, the monitoring system solves performance problems in three areas - collecting new data and writing it to the database using SQL INSERT queries, accessing data using SELECT queries, and deleting data using DELETE. Let's see how a typical SQL query is executed:
In general, there is a lot of work. Most DBMSs provide a ton of options for optimizing queries, but they are usually focused on some average workflows, in which insertion and deletion of records occurs at about the same frequency as change.
However, as mentioned above, for monitoring systems, the most typical operations are adding and periodic deletion in batch mode. Changes to previously added data almost never occur, and access to data involves the use of aggregated functions. In addition, the values of added metrics are usually ordered by time. Such data is usually called time series ( time series ):
From a database perspective, time series have the following properties:
Obviously, traditional SQL databases are not suitable for storing such data, since general-purpose optimizations do not take these qualities into account. Therefore, in recent years, quite a lot of new, time-oriented DBMS, such as, for example, InfluxDB, have appeared. But all popular DBMS for time series have one major drawback - the lack of full SQL support. Moreover, most of them are not even CRUD (Create, Read, Update, Delete).
Can Zabbix use these DBMS somehow? One of the possible approaches is to transfer historical data for storage to an external, specialized for the time series of the DBMS. Given that the Zabbix architecture supports external backends for storing historical data (for example, this is how Zabbix supports Elasticsearch), at first glance this option looks very reasonable. But if we supported one or several DBMS for time series as external servers, then users would have to take into account the following points:
For some users, the advantages of dedicated dedicated storage for historical data may outweigh the inconvenience associated with the need to worry about another system. But for many, this is an unnecessary complication. It is also worth remembering that since most of these specialized solutions have their own APIs, the complexity of the universal layer for working with Zabbix databases will increase significantly. And we, ideally, prefer to create new functions, rather than deal with other people's APIs.
The question arises - is there a way to take advantage of the DBMS for the time series, but without losing the flexibility and benefits of SQL? Naturally, there is no universal answer, but one specific solution was very close to the answer - TimescaleDB .
TimescaleDB (TSDB) is a PostgreSQL extension that optimizes working with time series in a regular PostgreSQL database (PG). Although, as mentioned above, there is no shortage of well-scalable solutions for time series in the market, a unique feature of TimescaleDB is its ability to work well with time series without sacrificing the compatibility and benefits of traditional CRUD relational databases. In practice, this means that we get the best of both worlds. The database knows which tables should be treated as time series (and apply all necessary optimizations), but you can work with them as you would with regular tables. Moreover, applications are not required to know that TSDB controls the data!
To mark a table as a time series table (in TSDB this is called a hypertable), it is enough to call the TSDB create_ hypertable () procedure. Under the hood, TSDB divides this table into so-called fragments (English term - chunk) in accordance with the specified conditions. Fragments can be presented as automatically controlled sections of the table. Each fragment has a corresponding time range. For each fragment, TSDB also establishes special indices so that working with one data range does not affect access to others.
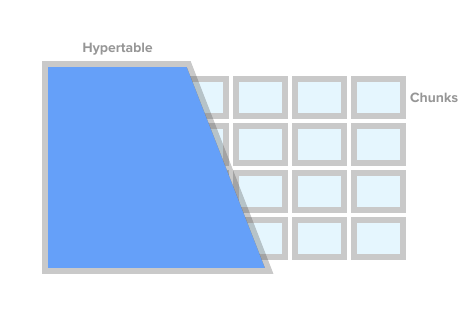
Hypertable Image from timescaledb.com
When an application adds a new time series value, the extension directs that value to the desired snippet. If the range for the time of the new value is not defined, the TSDB will create a new fragment, assign it the desired range and insert the value there. If an application requests data from a hyper table, then before executing the query, the extension checks which fragments are associated with this query.
But that's not all. TSDB complements PostgreSQL's robust and time-tested ecosystem with a host of performance and scalability changes. These include the rapid addition of new records, quick requests for time and virtually free batch deletion.
As noted earlier, in order to control the size of the database and adhere to storage policies (i.e. not keep the data longer than necessary), a good monitoring solution should effectively remove a large amount of historical data. With TSDB, we can delete the desired history by simply deleting certain fragments from the hypertable. In this case, the application does not need to track fragments by name or any other links, TSDB will remove all the necessary fragments for a given time condition.
At first glance it may seem that TSDB is a beautiful wrapper around the standard partitioning of PG tables ( declarative partitioning , as it is officially called in PG10). Indeed, you can use the standard PG10 partitioning to store historical data. But if you take a closer look, the fragments of the TSDB and the PG10 section are far from identical concepts.
To begin with, setting up partitioning in PG requires insight into the details that either the application itself or the DBMS should deal with in a good way. First, you need to plan the partition hierarchy and decide whether to use nested partitions. Secondly, you need to come up with a scheme for naming sections and somehow shift it to the scripts for creating a scheme. Most likely, the naming scheme will include the date and / or time, and such names will need to be somehow automated.
Next, you need to think about how to delete data with expired storage. In TSDB, you can simply call the drop_chunks () command, which determines which fragments are deleted in a given period of time. In PG10, if you need to remove a certain range of values from the standard PG sections, you will have to calculate the list of section names for this range yourself. If the selected partitioning scheme involves nested sections, this further complicates the removal.
Another problem that will have to be solved is what to do with data that goes beyond the current time ranges. For example, data may come from a future under which sections have not yet been created. Or from the past for already deleted sections. By default in PG10, adding such a record will not work and we will simply lose data. In PG11, you can define a default section for such data, but this only temporarily masks the problem and does not solve it.
Of course, all of the above problems can be solved one way or another. You can hang the database with triggers, cron-jobs and richly spice up scripts. It will be though ugly, but workable. Without a doubt, the PG section is better than the giant monolithic tables, but what is not exactly solved through scripts and triggers is the improvements designed for time series that are not found in PG.
Those. in comparison with PG sections, TSDB hypertables compare favorably not only with the savings of nerves of DB administrators, but also with optimizations for both data access and adding new ones. For example, fragments in TSDB are always a one-dimensional array. This simplifies fragment management and speeds up inserts and selections. To add new data, TSDB uses its own routing algorithm in the desired fragment, which, unlike the standard PG, does not open all sections at once. With a large number of sections, the difference in performance may differ significantly. Technical details about the difference between standard partitioning in PG and TSDB can be found in this article .
Of all the possible variants, TimescaleDB looks like the safest choice for Zabbix and its users:
Let's see what needs to be done to run TSDB with a freshly installed Zabbix. After installing Zabbix and running PostgreSQL database creation scripts, you need to download and install TSDB on the required platform. See installation instructions here . After installing the extension, you need to enable it for the Zabbix database, and then run the timecaledb.sql script that comes with Zabbix. It is located either in database / postgresql / timecaledb.sql, if installation is done from source, or in /usr/share/zabbix/database/timecaledb.sql.gz, if installation is done from packages. That's all! Now you can start the Zabbix server and it will work with TSDB.
The timescaledb.sql script is trivial. All he does is convert normal Zabbix historical tables into TSDB hyper tables and change default settings — sets the Override item history period and Override item trend period parameters. Now (version 4.2), the following Zabbix tables are running under TSDB control - history, history_uint, history_str, history_log, history_text, trends and trends_uint. The same script can be used to migrate these tables (note that the migrate_data parameter is set to true). It must be borne in mind that data migration is a very long process and can take several hours.
Before running timecaledb.sql, the change may also require the chunk_time_interval => 86400 parameter. Chunk_time_interval is a gap that limits the time values falling into this fragment. For example, if you set the chunk_time_interval interval to 3 hours, the data for the whole day will be divided into 8 fragments, with the first fragment No. 1 covering the first 3 hours (0: 00-2: 59), the second fragment No. 2 - the second 3 hours ( 3: 00-5: 59), etc. The last fragment number 8 will contain values with a time of 21: 00-23: 59. 86400 seconds (1 day) is the average default, but users who are loaded may want to reduce it.
In order to roughly estimate the memory requirements, it is important to understand how much space one fragment can take on average. The general principle is that the system should have enough memory to locate at least one fragment from each hyper table. In this case, of course, the sum of the sizes of the fragments should not only get into the memory with a margin, but also be smaller than the value of the shared_buffers parameter from postgresql.conf. Further information on this topic can be found in the TimescaleDB documentation.
For example, if you have a system that collects mostly integer metrics and you decide to divide the history_uint table into 2-hour fragments and divide the remaining tables into one-day fragments, then you need to change this line in timecaledb.sql:
After accumulating a certain amount of historical data, you can check the fragment sizes for the history_uint table by calling chunk_relation_size ():
This call can be repeated to find fragment sizes for all hypertables. If, for example, it was found that the size of the history_uint fragment is 13MB, fragments for other history tables, say, 20MB and for trend tables 10MB, then the total memory requirement is 13 + 4 x 20 + 2 x 10 = 113MB. You must also leave space from shared_buffers to store other data, say 20%. Then the value of shared_buffers should be set to 113MB / 0.8 = ~ 140MB.
For more fine-tuning TSDB, the timescaledb-tune utility recently appeared. It analyzes postgresql.conf, relates it to the system configuration (memory and processor), and then issues recommendations for setting memory parameters, parameters for parallel processing, and WAL. The utility changes the postgresql.conf file, but you can run it with the -dry-run parameter and check the proposed changes.
We will dwell more on the Zabbix Override item history history and Override item trend period parameters (available in Administration -> General -> Housekeeping). They are needed to delete historical data with whole fragments of TSDB hypertables, not records.
The fact is that Zabbix allows you to set a housekeeping period for each data element (metric) individually. However, this flexibility is achieved by scanning the list of items and calculating individual periods in each iteration of housekeeping. If the system has individual housekeeping periods for individual elements, then in the system, obviously, there can be no single cut-off history for all metrics together and Zabbix will not be able to give the correct command to delete the necessary fragments. Thus, turning off Override history for metrics will prevent Zabbix from quickly removing history by calling the drop_chunks () procedure for history_ * tables, and, accordingly, turning off Override trends will also remove the same function for trends__ tables.
In other words, in order to fully take advantage of the new housekeeping system, both options must be made global. In this case, the housekeeping process will not read the settings of the data elements at all.
It's time to check whether all of the above works in practice. Our test bench is Zabbix 4.2rc1 with PostgreSQL 10.7 and TimescaleDB 1.2.1 for Debian 9. The test machine is a 10-core Intel Xeon with 16 GB of RAM and 60 GB of disk space on an SSD. By today's standards, this is a very modest configuration, but our goal is to find out how effective TSDB is in real life. In configurations with an unlimited budget, you can simply insert 128-256 GB of RAM and put most (if not all) of the database in memory.
Our test configuration consists of 32 active Zabbix agents, transmitting data directly to the Zabbix Server. Each agent serves 10,000 items. Zabbix historical cache is set to 256MB, and PG's shared_buffers is 2GB. This configuration provides a sufficient load on the database, but at the same time does not create a large load on Zabbix server processes. To reduce the number of moving parts between the data sources and the base, we did not use Zabbix Proxy.
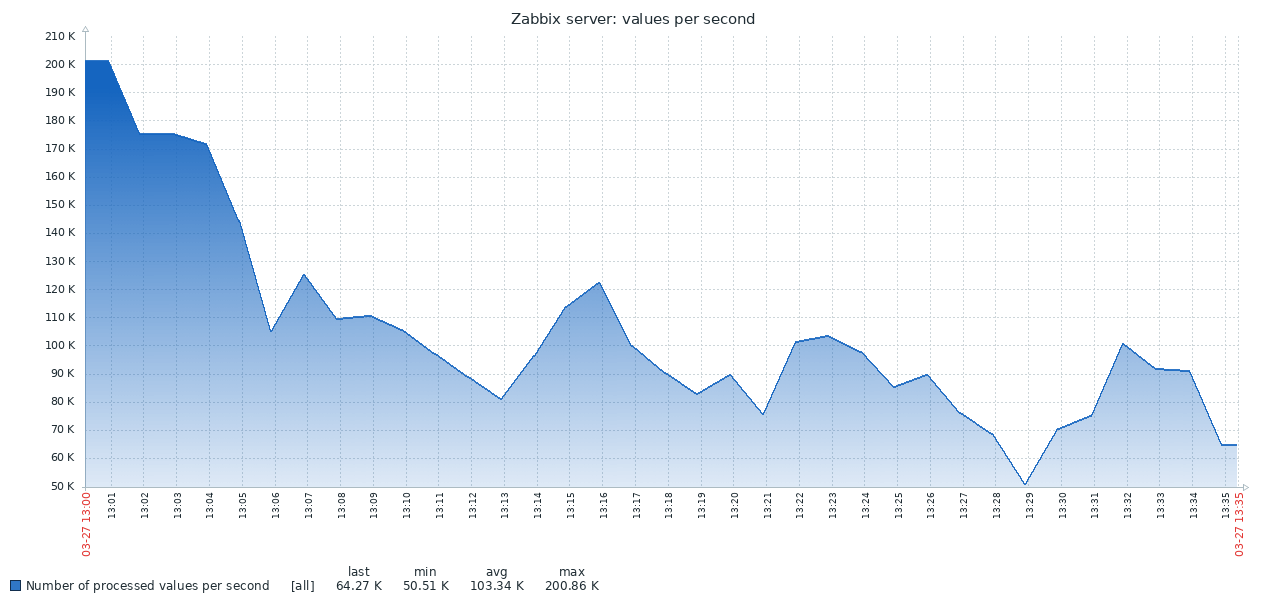
Here is the first result obtained from the standard PG system:
The result of the work of TSDB looks quite different:

The graph below combines both results. Work begins with fairly high NVPS values at 170–200K, since it takes some time to fill the history cache before synchronization with the database begins.
When the history table is empty, the write speed in the TSDB is comparable to the write speed in the PG, and even with a small margin of the latter. As soon as the number of records in history reaches 50-60 million, the PG bandwidth drops to 110K NVPS, but, more unpleasantly, it further changes in inverse proportion to the number of records accumulated in the historical table. At the same time, TSDB maintains a stable speed of 130K NVPS during the entire test from 0 to 300 million records.
So, in our example, the difference in average performance is quite significant (130K versus 90K without taking into account the initial peak). It also shows that the rate of inserts in a standard PG varies over a wide range. Thus, if the workflow requires storing tens or hundreds of millions of records in history, but there are no resources for very aggressive caching strategies, then TSDB is a strong candidate for replacing the standard PG.
The advantage of TSDB is already obvious for this relatively modest system, but most likely the difference will become even more noticeable on large arrays of historical data. On the other hand, this test is not a generalization of all possible scenarios for working with Zabbix. Naturally, there are many factors affecting the results, such as hardware configurations, operating system settings, Zabbix server settings and additional load from other services running in the background. Ie, your mileage may vary.
TimescaleDB is a very promising technology. It is already successfully used in serious production environments. TSDB works well with Zabbix and provides significant advantages over the standard PostgreSQL database.
Does TSDB have any shortcomings or reasons to delay its use? From a technical point of view, we see no arguments against it. But it should be borne in mind that the technology is still new, with an unsustainable release cycle and an unclear strategy for the development of functionality. In particular, every month or two new versions are released with significant changes. Some functions may be removed, as happened, for example, with adaptive chunking. Separately, as another uncertainty factor, it is worth mentioning the licensing policy. It is very confusing because there are three levels of licensing. The TSDB core is made under the Apache license, some functions are released under their own Timescale License, but there is also a closed version of Enterprise.
If you are using Zabbix with PostgreSQL, then at least there’s no reason to try TimescaleDB. Perhaps this thing will pleasantly surprise you :) Just keep in mind that support for TimescaleDB in Zabbix is still experimental - for the time being we collect user feedback and gain experience.
First, a good monitoring system must very quickly receive, process and record incoming data from outside. The account goes on microseconds. Offhand this may not seem obvious, but when the system becomes large enough, all these fractions of seconds are summed up, turning into well noticeable delays.
The second task is to provide convenient access to large arrays of previously collected metrics (in other words, to historical data). Historical data is used in many different contexts. According to them, for example, reports and graphs are generated, aggregated checks are built on them, and triggers depend on them. If there are any delays in accessing the history, this immediately affects the speed of the system as a whole.
')
Third, historical data takes up a lot of space. Even relatively modest monitoring configurations quickly acquire a solid history. But hardly anyone wants to keep on hand the history of CPU usage five years ago, so the monitoring system should be able not only to record well, but also to delete the history well (in Zabbix this process is called “housekeeping”). Deleting old data does not have to be as effective as collecting and analyzing new ones, but heavy deletion operations detract from the precious resources of the DBMS and can slow down more critical operations.
The first two problems are solved by caching. Zabbix supports several specialized caches to speed up read and write operations. The mechanisms of the DBMS itself are not suitable here, since even the most advanced general-purpose caching algorithm will not know which data structures require instant access at a given point in time.
Monitoring and time series data
All is well as long as the data is in the memory of the Zabbix server. But the memory is not infinite and at some point the data required to write (or read) to the database. And if database performance is seriously lagging behind the speed of collecting metrics, then even the most advanced special caching algorithms will not help for a long time.
The third problem also comes down to database performance. To solve it, you need to choose a reliable deletion strategy that would not interfere with other database operations. By default, Zabbix deletes historical data in batches of several thousand records per hour. You can set up longer periods of housekeeping or larger packet sizes if the speed of data collection and place in the database allows it. But with a very large number of metrics and / or a high frequency of their collection, the correct setting of housekeeping can be a daunting task, since the schedule for deleting data may not keep pace with the pace of recording new ones.
Summarizing, the monitoring system solves performance problems in three areas - collecting new data and writing it to the database using SQL INSERT queries, accessing data using SELECT queries, and deleting data using DELETE. Let's see how a typical SQL query is executed:
- The DBMS analyzes the request and checks it for syntax errors. If the request is syntactically correct, the engine builds a syntax tree for further processing.
- The query planner analyzes the syntax tree and calculates the various ways (ways) to execute the query.
- The scheduler calculates the cheapest way. In the process, it takes into account a lot of things - how big the tables are, whether the results need to be sorted, whether there are indices applicable to the query, etc.
- When the optimal path is found, the engine performs the query by accessing the necessary data blocks (using indexes or sequential scanning), applies the sorting and filtering criteria, collects the result and returns it to the client.
- For insert, update and delete queries, the engine must also update the indexes for the corresponding tables. For large tables, this operation may take longer than working with the data itself.
- Most likely, the DBMS will also update the internal statistics of data usage for subsequent calls to the query planner.
In general, there is a lot of work. Most DBMSs provide a ton of options for optimizing queries, but they are usually focused on some average workflows, in which insertion and deletion of records occurs at about the same frequency as change.
However, as mentioned above, for monitoring systems, the most typical operations are adding and periodic deletion in batch mode. Changes to previously added data almost never occur, and access to data involves the use of aggregated functions. In addition, the values of added metrics are usually ordered by time. Such data is usually called time series ( time series ):
Time series are a series of data points indexed (or listed or graffiti) on a temporary basis.
From a database perspective, time series have the following properties:
- Time series can be located on a disk in the form of a sequence of blocks ordered by time.
- Time series data tables can be indexed by a time stamped column.
- Most SQL SELECT queries will use WHERE, GROUP BY, or ORDER BY clauses on a timed column.
- Typically, time series data has a “shelf life” after which it can be deleted.
Obviously, traditional SQL databases are not suitable for storing such data, since general-purpose optimizations do not take these qualities into account. Therefore, in recent years, quite a lot of new, time-oriented DBMS, such as, for example, InfluxDB, have appeared. But all popular DBMS for time series have one major drawback - the lack of full SQL support. Moreover, most of them are not even CRUD (Create, Read, Update, Delete).
Can Zabbix use these DBMS somehow? One of the possible approaches is to transfer historical data for storage to an external, specialized for the time series of the DBMS. Given that the Zabbix architecture supports external backends for storing historical data (for example, this is how Zabbix supports Elasticsearch), at first glance this option looks very reasonable. But if we supported one or several DBMS for time series as external servers, then users would have to take into account the following points:
- Another system that needs to be studied, configured and maintained. Another place to keep track of parameters, disk space, data storage policies, performance, etc.
- Reducing the fault tolerance of the system for monitoring, because a new link appears in the chain of connected components.
For some users, the advantages of dedicated dedicated storage for historical data may outweigh the inconvenience associated with the need to worry about another system. But for many, this is an unnecessary complication. It is also worth remembering that since most of these specialized solutions have their own APIs, the complexity of the universal layer for working with Zabbix databases will increase significantly. And we, ideally, prefer to create new functions, rather than deal with other people's APIs.
The question arises - is there a way to take advantage of the DBMS for the time series, but without losing the flexibility and benefits of SQL? Naturally, there is no universal answer, but one specific solution was very close to the answer - TimescaleDB .
What is TimescaleDB?
TimescaleDB (TSDB) is a PostgreSQL extension that optimizes working with time series in a regular PostgreSQL database (PG). Although, as mentioned above, there is no shortage of well-scalable solutions for time series in the market, a unique feature of TimescaleDB is its ability to work well with time series without sacrificing the compatibility and benefits of traditional CRUD relational databases. In practice, this means that we get the best of both worlds. The database knows which tables should be treated as time series (and apply all necessary optimizations), but you can work with them as you would with regular tables. Moreover, applications are not required to know that TSDB controls the data!
To mark a table as a time series table (in TSDB this is called a hypertable), it is enough to call the TSDB create_ hypertable () procedure. Under the hood, TSDB divides this table into so-called fragments (English term - chunk) in accordance with the specified conditions. Fragments can be presented as automatically controlled sections of the table. Each fragment has a corresponding time range. For each fragment, TSDB also establishes special indices so that working with one data range does not affect access to others.
When an application adds a new time series value, the extension directs that value to the desired snippet. If the range for the time of the new value is not defined, the TSDB will create a new fragment, assign it the desired range and insert the value there. If an application requests data from a hyper table, then before executing the query, the extension checks which fragments are associated with this query.
But that's not all. TSDB complements PostgreSQL's robust and time-tested ecosystem with a host of performance and scalability changes. These include the rapid addition of new records, quick requests for time and virtually free batch deletion.
As noted earlier, in order to control the size of the database and adhere to storage policies (i.e. not keep the data longer than necessary), a good monitoring solution should effectively remove a large amount of historical data. With TSDB, we can delete the desired history by simply deleting certain fragments from the hypertable. In this case, the application does not need to track fragments by name or any other links, TSDB will remove all the necessary fragments for a given time condition.
TimescaleDB and PostgreSQL partitioning
At first glance it may seem that TSDB is a beautiful wrapper around the standard partitioning of PG tables ( declarative partitioning , as it is officially called in PG10). Indeed, you can use the standard PG10 partitioning to store historical data. But if you take a closer look, the fragments of the TSDB and the PG10 section are far from identical concepts.
To begin with, setting up partitioning in PG requires insight into the details that either the application itself or the DBMS should deal with in a good way. First, you need to plan the partition hierarchy and decide whether to use nested partitions. Secondly, you need to come up with a scheme for naming sections and somehow shift it to the scripts for creating a scheme. Most likely, the naming scheme will include the date and / or time, and such names will need to be somehow automated.
Next, you need to think about how to delete data with expired storage. In TSDB, you can simply call the drop_chunks () command, which determines which fragments are deleted in a given period of time. In PG10, if you need to remove a certain range of values from the standard PG sections, you will have to calculate the list of section names for this range yourself. If the selected partitioning scheme involves nested sections, this further complicates the removal.
Another problem that will have to be solved is what to do with data that goes beyond the current time ranges. For example, data may come from a future under which sections have not yet been created. Or from the past for already deleted sections. By default in PG10, adding such a record will not work and we will simply lose data. In PG11, you can define a default section for such data, but this only temporarily masks the problem and does not solve it.
Of course, all of the above problems can be solved one way or another. You can hang the database with triggers, cron-jobs and richly spice up scripts. It will be though ugly, but workable. Without a doubt, the PG section is better than the giant monolithic tables, but what is not exactly solved through scripts and triggers is the improvements designed for time series that are not found in PG.
Those. in comparison with PG sections, TSDB hypertables compare favorably not only with the savings of nerves of DB administrators, but also with optimizations for both data access and adding new ones. For example, fragments in TSDB are always a one-dimensional array. This simplifies fragment management and speeds up inserts and selections. To add new data, TSDB uses its own routing algorithm in the desired fragment, which, unlike the standard PG, does not open all sections at once. With a large number of sections, the difference in performance may differ significantly. Technical details about the difference between standard partitioning in PG and TSDB can be found in this article .
Zabbix and TimescaleDB
Of all the possible variants, TimescaleDB looks like the safest choice for Zabbix and its users:
- TSDB is designed as an extension to PostgreSQL, and not as a separate system. Therefore, it does not require additional hardware, virtual machines, or any other changes in the infrastructure. Users can continue to use their chosen tools for PostgreSQL.
- TSDB allows you to save almost all the code to work with the database in Zabbix unchanged.
- TSDB significantly improves the speed of history syncer and housekeeper.
- Low entry threshold - the basic concepts of TSDB are simple and straightforward.
- Easy installation and configuration of both the expansion and Zabbix itself will greatly help users of small and medium-sized systems.
Let's see what needs to be done to run TSDB with a freshly installed Zabbix. After installing Zabbix and running PostgreSQL database creation scripts, you need to download and install TSDB on the required platform. See installation instructions here . After installing the extension, you need to enable it for the Zabbix database, and then run the timecaledb.sql script that comes with Zabbix. It is located either in database / postgresql / timecaledb.sql, if installation is done from source, or in /usr/share/zabbix/database/timecaledb.sql.gz, if installation is done from packages. That's all! Now you can start the Zabbix server and it will work with TSDB.
The timescaledb.sql script is trivial. All he does is convert normal Zabbix historical tables into TSDB hyper tables and change default settings — sets the Override item history period and Override item trend period parameters. Now (version 4.2), the following Zabbix tables are running under TSDB control - history, history_uint, history_str, history_log, history_text, trends and trends_uint. The same script can be used to migrate these tables (note that the migrate_data parameter is set to true). It must be borne in mind that data migration is a very long process and can take several hours.
Before running timecaledb.sql, the change may also require the chunk_time_interval => 86400 parameter. Chunk_time_interval is a gap that limits the time values falling into this fragment. For example, if you set the chunk_time_interval interval to 3 hours, the data for the whole day will be divided into 8 fragments, with the first fragment No. 1 covering the first 3 hours (0: 00-2: 59), the second fragment No. 2 - the second 3 hours ( 3: 00-5: 59), etc. The last fragment number 8 will contain values with a time of 21: 00-23: 59. 86400 seconds (1 day) is the average default, but users who are loaded may want to reduce it.
In order to roughly estimate the memory requirements, it is important to understand how much space one fragment can take on average. The general principle is that the system should have enough memory to locate at least one fragment from each hyper table. In this case, of course, the sum of the sizes of the fragments should not only get into the memory with a margin, but also be smaller than the value of the shared_buffers parameter from postgresql.conf. Further information on this topic can be found in the TimescaleDB documentation.
For example, if you have a system that collects mostly integer metrics and you decide to divide the history_uint table into 2-hour fragments and divide the remaining tables into one-day fragments, then you need to change this line in timecaledb.sql:
SELECT create_hypertable('history_uint', 'clock', chunk_time_interval => 7200, migrate_data => true); After accumulating a certain amount of historical data, you can check the fragment sizes for the history_uint table by calling chunk_relation_size ():
zabbix=> SELECT chunk_table,total_bytes FROM chunk_relation_size('history_uint'); chunk_table | total_bytes -----------------------------------------+------------- _timescaledb_internal._hyper_2_6_chunk | 13287424 _timescaledb_internal._hyper_2_7_chunk | 13172736 _timescaledb_internal._hyper_2_8_chunk | 13344768 _timescaledb_internal._hyper_2_9_chunk | 13434880 _timescaledb_internal._hyper_2_10_chunk | 13230080 _timescaledb_internal._hyper_2_11_chunk | 13189120 This call can be repeated to find fragment sizes for all hypertables. If, for example, it was found that the size of the history_uint fragment is 13MB, fragments for other history tables, say, 20MB and for trend tables 10MB, then the total memory requirement is 13 + 4 x 20 + 2 x 10 = 113MB. You must also leave space from shared_buffers to store other data, say 20%. Then the value of shared_buffers should be set to 113MB / 0.8 = ~ 140MB.
For more fine-tuning TSDB, the timescaledb-tune utility recently appeared. It analyzes postgresql.conf, relates it to the system configuration (memory and processor), and then issues recommendations for setting memory parameters, parameters for parallel processing, and WAL. The utility changes the postgresql.conf file, but you can run it with the -dry-run parameter and check the proposed changes.
We will dwell more on the Zabbix Override item history history and Override item trend period parameters (available in Administration -> General -> Housekeeping). They are needed to delete historical data with whole fragments of TSDB hypertables, not records.
The fact is that Zabbix allows you to set a housekeeping period for each data element (metric) individually. However, this flexibility is achieved by scanning the list of items and calculating individual periods in each iteration of housekeeping. If the system has individual housekeeping periods for individual elements, then in the system, obviously, there can be no single cut-off history for all metrics together and Zabbix will not be able to give the correct command to delete the necessary fragments. Thus, turning off Override history for metrics will prevent Zabbix from quickly removing history by calling the drop_chunks () procedure for history_ * tables, and, accordingly, turning off Override trends will also remove the same function for trends__ tables.
In other words, in order to fully take advantage of the new housekeeping system, both options must be made global. In this case, the housekeeping process will not read the settings of the data elements at all.
Performance with TimescaleDB
It's time to check whether all of the above works in practice. Our test bench is Zabbix 4.2rc1 with PostgreSQL 10.7 and TimescaleDB 1.2.1 for Debian 9. The test machine is a 10-core Intel Xeon with 16 GB of RAM and 60 GB of disk space on an SSD. By today's standards, this is a very modest configuration, but our goal is to find out how effective TSDB is in real life. In configurations with an unlimited budget, you can simply insert 128-256 GB of RAM and put most (if not all) of the database in memory.
Our test configuration consists of 32 active Zabbix agents, transmitting data directly to the Zabbix Server. Each agent serves 10,000 items. Zabbix historical cache is set to 256MB, and PG's shared_buffers is 2GB. This configuration provides a sufficient load on the database, but at the same time does not create a large load on Zabbix server processes. To reduce the number of moving parts between the data sources and the base, we did not use Zabbix Proxy.
Here is the first result obtained from the standard PG system:
The result of the work of TSDB looks quite different:
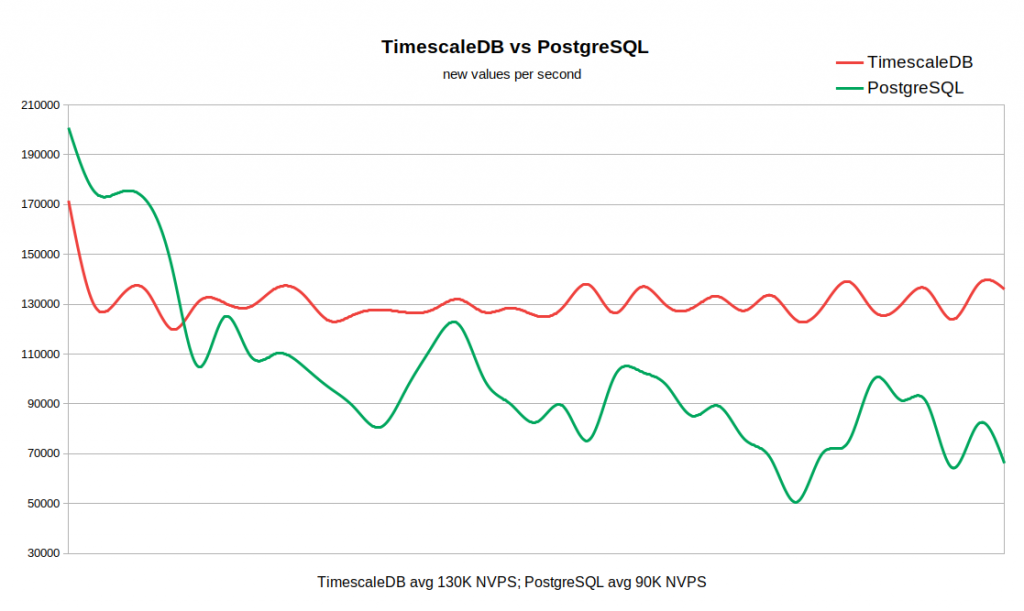
The graph below combines both results. Work begins with fairly high NVPS values at 170–200K, since it takes some time to fill the history cache before synchronization with the database begins.
When the history table is empty, the write speed in the TSDB is comparable to the write speed in the PG, and even with a small margin of the latter. As soon as the number of records in history reaches 50-60 million, the PG bandwidth drops to 110K NVPS, but, more unpleasantly, it further changes in inverse proportion to the number of records accumulated in the historical table. At the same time, TSDB maintains a stable speed of 130K NVPS during the entire test from 0 to 300 million records.
So, in our example, the difference in average performance is quite significant (130K versus 90K without taking into account the initial peak). It also shows that the rate of inserts in a standard PG varies over a wide range. Thus, if the workflow requires storing tens or hundreds of millions of records in history, but there are no resources for very aggressive caching strategies, then TSDB is a strong candidate for replacing the standard PG.
The advantage of TSDB is already obvious for this relatively modest system, but most likely the difference will become even more noticeable on large arrays of historical data. On the other hand, this test is not a generalization of all possible scenarios for working with Zabbix. Naturally, there are many factors affecting the results, such as hardware configurations, operating system settings, Zabbix server settings and additional load from other services running in the background. Ie, your mileage may vary.
Conclusion
TimescaleDB is a very promising technology. It is already successfully used in serious production environments. TSDB works well with Zabbix and provides significant advantages over the standard PostgreSQL database.
Does TSDB have any shortcomings or reasons to delay its use? From a technical point of view, we see no arguments against it. But it should be borne in mind that the technology is still new, with an unsustainable release cycle and an unclear strategy for the development of functionality. In particular, every month or two new versions are released with significant changes. Some functions may be removed, as happened, for example, with adaptive chunking. Separately, as another uncertainty factor, it is worth mentioning the licensing policy. It is very confusing because there are three levels of licensing. The TSDB core is made under the Apache license, some functions are released under their own Timescale License, but there is also a closed version of Enterprise.
If you are using Zabbix with PostgreSQL, then at least there’s no reason to try TimescaleDB. Perhaps this thing will pleasantly surprise you :) Just keep in mind that support for TimescaleDB in Zabbix is still experimental - for the time being we collect user feedback and gain experience.
Source: https://habr.com/ru/post/458530/
All Articles