Rating of territories by the method of thermal potentials using open data
In this article, we consider the algorithm and the results of the analysis of large areas of land without restrictions on their boundaries, using the method of thermal potentials and the method of principal components . As a source of information, preference was given to open data, primarily from OSM. The study was conducted on the territory of 40 subjects of the European part of the territory of the Russian Federation, as a single whole with a total area of 1.8 million sq. Km.
Some problems solved by the method of potentials:
- Determination of a set of point grades in each point of a territory, giving an idea of the level of development of a territory in general, and in a certain subject area in particular. For example, trade, industry, services, etc.
- Finding homogeneous zones (clusters) of the analyzed territory and their exact borders.
- Calculation of recommendations for the placement of a new object , including a compound object that includes other objects.
- Finding models of value or value of territory for each cluster.
- Comparison of territories, ie the compilation of ratings of territories (which will be discussed in this article).
Scope of research
')
The mentioned tasks are solved for the level of cities (several hundred square kilometers with a spatial accuracy of 25 meters) and the level of regions (several hundred thousand square kilometers with a spatial accuracy of 250 meters). The article describes the methods of analyzing the territory in a new scale - the union of cities, regions, districts into a single space.
Basic research methods:
- Open spatial information is used, primarily OSM, and its processing methods.
- To account for the degree of influence of objects of different nature on the territory, the method of potentials is used .
- To reduce the dimension of the problem and improve the quality of models, the principal component method is used.
- <A href = “ ru.wikipedia.org/wiki/Met is used to calculate linear models. • For the analysis, clustering methods are used to determine homogeneous areas. For each cluster its own model is made up, the models are stitched at the boundaries of the clusters.
The study was conducted at the level of the constituent entities of the Russian Federation and large cities, followed by their association.
First of all, we present the algorithm and the results of the study of homogeneous territories of the constituent entities of the Russian Federation - Volga Federal District, Central Federal District, Southern Federal District, North-Western Federal District and part of the Ural Federal District, thus the total area of research was approximately 1.8 million sq. Km.
Description of the research technology:
- Collection of source information from open data sources (our preference is OpenStreetMap) in the context of each subject of the Russian Federation. The initial information is downloaded with the maximum radius of influence Rmax for all factors (for example, in our case the maximum radius of influence was 50 km, that is, the information will be downloaded with a buffer of 50 km).
- The grid is constructed clearly within the boundaries of a constituent entity of the Russian Federation (the grid step for this study is 1 kilometer), and the procedure for splitting the influence factors into fragments for further potential calculation is carried out taking into account the built buffer, in order to take into account the influence of factors on the subject’s boundary.
- The calculation of the potential values and the filling of the calculation results in the grid nodes is carried out within the boundaries of the subject of the Russian Federation.
- Association of subjects of the Russian Federation in the "single project". That is, at this stage, we merge all the grids built for each subject earlier into one. Thus, we get a grid covering an area of 1.8 million sq. Km. and containing 1.8 million knots (points of analysis) and 88 influence factors (in our opinion, the most influential OSM factors are point and extended objects (highways, forests, rivers, infrastructure facilities)).
- The calculation of integral indicators using the principal component method.
- Search for homogeneous areas.
The territories under study are combined into homogeneous areas according to factors that describe a direction of the development of the territory, for example, the social sphere, trade, industry.
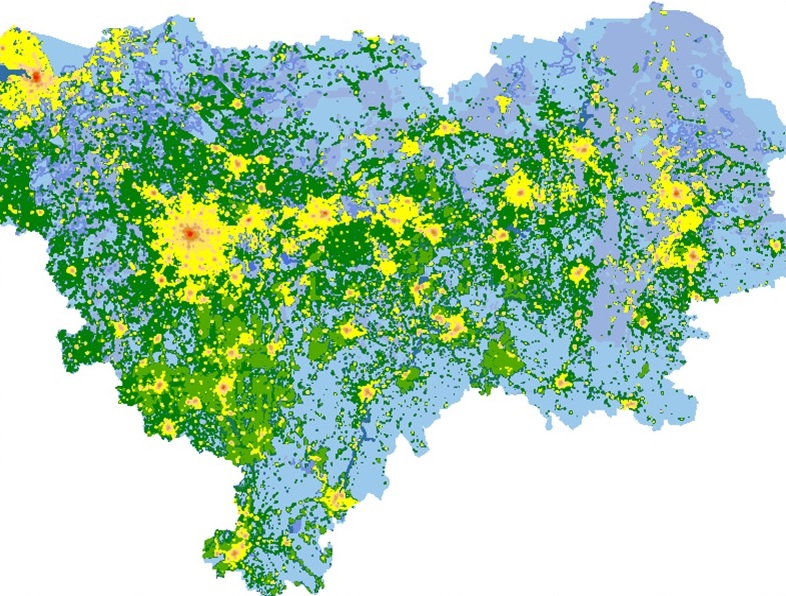
The figure below shows images of homogeneous areas of the “one project” in the context of: industry, trade, services.

Uniform territories of the European part of the Russian Federation by the factor "industry"

Homogeneous territories of the European part of the Russian Federation by the factor "industry" (fragment Moscow)

Uniform territories of the European part of the Russian Federation by the factor "trade"

Uniform territories of the European part of the Russian Federation by the factor "trade" (a fragment of Moscow)

Uniform territories of the European part of the Russian Federation by the factor "services"

Homogeneous territories of the European part of the Russian Federation by the factor “services” (a fragment of Moscow)
On the presented images, the centers of the subjects of the Russian Federation obviously predominate, but it can also be noted that some homogeneous areas (areas highlighted in the same color) are found in almost every subject. In other words, these are homogeneous (by significance) territories in different subjects are the most attractive, both in investment and in other plans.
The next stage of the study was the compilation of ratings of subjects of the European part of the Russian Federation, which are listed in the tables below.
The rankings show the best square kilometer, the best 100 square meters. km and the best 20 000 sq. km. It should be noted that this is not a specific fragment of a territory of 1, 100 or 20 000 sq. Km in size, but a collection of grid nodes (analysis points) built on a subject that have the best integral characteristics, that is, these nodes can be located randomly on the territory of the subject of the Russian Federation.
Table 1. Rating of the subjects of the Russian Federation (the best 1 sq.km.)

Table 2. Rating of the subjects of the Russian Federation (the best 100 square kilometers)

Table 3. Rating of the subjects of the Russian Federation (the best 20 000 sq. Km.)

The first positions in the rating are occupied by Moscow and the Moscow Region, St. Petersburg and the Leningrad Region, the Sverdlovsk Region, the Chelyabinsk Region, the Nizhny Novgorod Region, and Tatarstan. However, it is worth noting that the rating is “floating” depending on the scale of the research (RF subjects change places), that is, the set of best nodes is affected by the fact that we consider -1 sq. Km or 100 sq. Km or 20 000 sq.km.
Solving a similar task for the centers of the constituent entities of the Russian Federation (we selected 40 largest and largest centers), we set the grid construction step of 100 meters and obtain the following results.
Table 4. Rating of the centers of the subjects of the Russian Federation (the best 0.01 sq. Km. - the best point of the territory)

Table 5. Rating of the centers of the subjects of the Russian Federation (the best 10 sq.km.)

Table 6. Rating of the centers of the subjects of the Russian Federation (the best 200 square kilometers)

Thus, as in the task at the level of the subjects of the Russian Federation, the rating turned out to be dependent on the scale studied. This is due to the fact that the number of grid nodes (analysis points) with the best integral indices varies depending on the selected scale.
In conclusion, it is worth noting that any rating is a thing that disposes of discussion, however, we carried out research work on open data using new territory analysis methods that allow transferring existing methods to a smaller scale - the level of subjects of the Russian Federation, federal districts and beyond.
Variable scale and new methods allow analyzing objects distant from each other as a whole, taking into account the mutual influence of territories on each other.
Source: https://habr.com/ru/post/458472/
All Articles