PVS-Studio for Visual Studio
Many of our articles are devoted to anything, but not to the PVS-Studio tool itself. But we are doing a lot to make it convenient for developers to use our tool. But this is often just what happens behind the scenes. I decided to correct this situation and talk about the PVS-Studio plugin for Visual Studio. If you are using Visual Studio, then this article is for you.
What is static code analysis and why is it needed?
Static code analysis is the process of identifying errors and shortcomings in the source code of programs. Static analysis can be viewed as an automated code review process. The joint code review is a great methodology. But it has a significant drawback - the high cost. It is necessary to regularly assemble several programmers to review a new code or re-review a code after making recommendations.
On the one hand, I want to regularly review the code. On the other hand, it is too expensive. A compromise solution is static code analysis tools. They tirelessly process source texts of programs and give out recommendations to a programmer to pay special attention to certain parts of the code. Of course, the program will not replace a full review of the code executed by a team of programmers. However, the cost / benefit ratio makes using static analysis a very useful practice used by many companies. If the reader is interested in specific numbers, then I suggest to get acquainted with the article " PVS-Studio ROI ".
There is a large number of commercial and free static code analyzers. A large list of static analyzers is available on Wikipedia: List of tools for static code analysis . The list of languages for which static code analyzers exist is also quite large (C, C ++, C #, Java, Ada, Fortran, Perl, Ruby, ...). Naturally, we will tell you about the PVS-Studio analyzer.
')
The main advantage of static analysis is the possibility of a significant reduction in the cost of eliminating defects in the program. The earlier the error is detected, the lower the cost of fixing it. So, according to the data given in McConnell's “Perfect Code”, the correction of an error at the testing stage is ten times more expensive than at the design stage (writing code):

Figure 1. The average cost of correcting defects depending on the time of their introduction and detection (data for the table are taken from S. McConnell's “Perfect Code”).
Static analysis tools allow you to identify a large number of errors in the design phase, which significantly reduces the cost of developing the entire project. For example, the PVS-Studio static code analyzer can run in the background immediately after compilation and, in case a potential error is found, notify the programmer. More about this mode will be described below.
PVS-Studio static code analyzer
PVS-Studio is a static analyzer that detects errors and potential vulnerabilities in the source code of applications in C, C ++ languages (extensions: C ++ / CLI and C ++ / CX are also supported), C # and Java on Windows, Linux and macOS platforms. The analyzer perfectly integrates into the Visual Studio 2010 - 2019 and IntelliJ IDEA environments. In this article we will examine in detail the work of PVS-Studio for checking code in C, C ++ and C # languages. You can read about how to use PVS-Studio to check Java code in IntelliJ IDEA here .
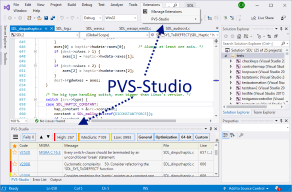
After installing PVS-Studio and integrating into Visual Studio, users receive an additional “PVS-Studio” item in the main menu and a window for working with diagnostic messages (see Figure 2).
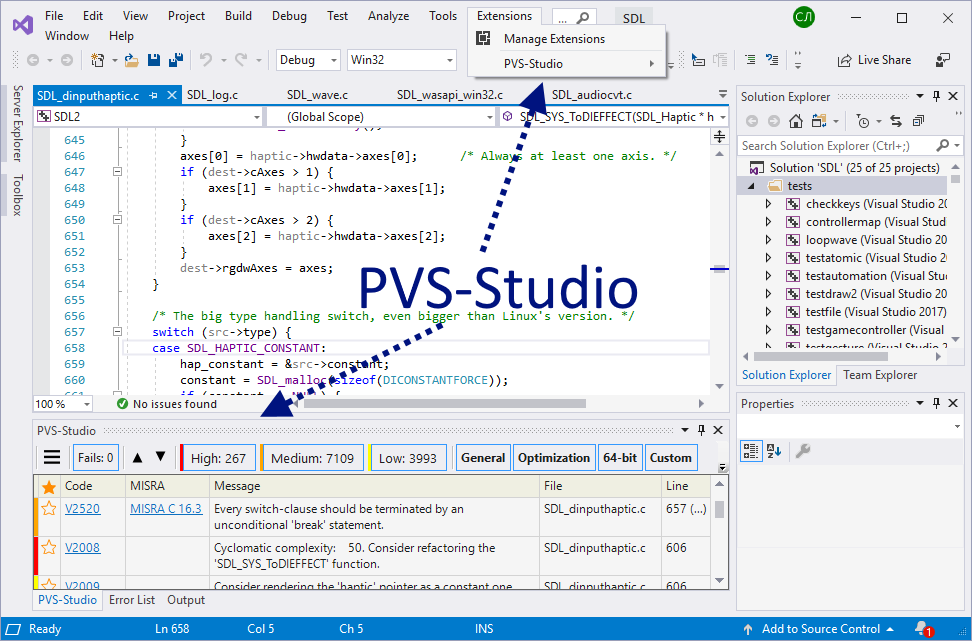
Figure 2. Main elements added by the PVS-Studio analyzer when integrated into Visual Studio.
Initial settings
The analyzer is ready for operation immediately after installation. In most cases, you do not need to configure anything to make the first launch. The only setting that you may need at the beginning is to exclude third-party libraries. After all, you still will not edit anything in the source files, for example, the jpeg library, so there is no need to check it. In addition, eliminating unnecessary folders will reduce the time of project analysis. The directories excluded from the analysis are set here: PVS-Studio> Options ...> Don't Check Files> PathMasks (see Figure 3).

Figure 3. Editing the list of directories that the analyzer will not check.
If there is one of the specified names in the full file path, the analysis will not be performed. By default, the list already includes the names of some directories. However, in your project the folder with the ZLib library may not be called “zlib”, but, for example, “zip_lib”. Therefore, you should edit this list. To start editing, click the button with three dots.
Examples of valid masks for the PathMasks list:
- c: \ Libs \ - all project files located in this folder and its subfolders will be excluded.
- \ Libs \ or * \ Libs \ * - all files located in directories, the path to which contains the “Libs” subfolder, will be excluded. If the characters "*" are not specified, they will still be automatically added, so both recording options are the same.
- Libs or * Libs * - all files to which the path contains a subfolder that has 'Libs' as a name or a fragment of the name will be excluded. Also in this case, files containing Libs in the name will be excluded, for example, c: \ project \ mylibs.cpp. To avoid confusion, we recommend always using slashes.
In addition to exceptions of entire folders, you can set masks to exclude individual files. For this there is a setting FileNameMasks. More information on how to work with exclusion lists can be found in the documentation: Settings: Don't Check Files .
Project Verification
Upon completion of the initial settings, you can proceed to check the project. PVS-Studio for Visual Studio supports checking C ++ (.vcxproj) and C # (.csproj) projects. You can also immediately try to check the solution containing the projects of these types, in its entirety. To do this, select the menu item Extensions> PVS-Studio> Check> Solution (see Figure 4).
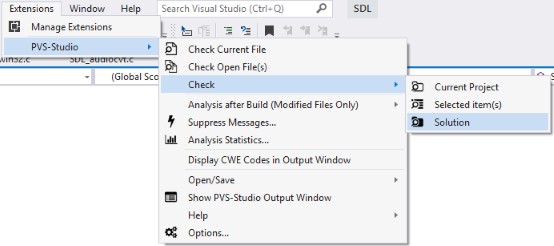
Figure 4. Solution check using the PVS-Studio analyzer.
If there are any difficulties with the verification, we recommend that you refer to the section “ Can not verify? ” On our website. This is not a stupid recommendation in the spirit of "check that the plug is inserted into the outlet." The section describes typical situations that users have approached us with, and suggests options for action.
Work with a list of diagnostic messages
After verification, all diagnostic messages will be displayed in a special window. The window has many controls. All of them serve to show exactly those diagnostic messages that are interesting to the user. However, at first the window may seem complicated. Let's look at all the controls (see Figure 5).
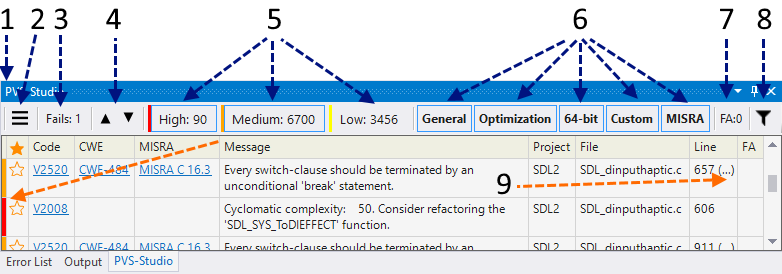
Figure 5. Window with diagnostic messages.
- Actually, the PVS-Studio window.
- Extra menu. It allows you to access such options as: marking a warning as false, hiding messages, adding files to exceptions (see below).
- The button includes the message "something went wrong." For example, it is not possible to preprocess one of the files.
- Go to previous / next post. This opens the corresponding file, and the cursor is placed on the line with a potential error. You can also always select diagnostics from the list by double-clicking the mouse. You can assign shortcuts to navigate to the previous / next message. The default is Alt + '[' and Alt + ']'.
- Buttons that include warnings of different levels. Now included the first two levels of diagnostics. In this case, the window displays 90 warnings of the first level, 6700 warnings of the second level. The message level is shown in the left part of the window, in the form of a bar corresponding to the color of the bar on the corresponding level button. Why are there so many positives? From 6700 warnings? To demonstrate the capabilities of the interface, the MISRA rule set is included, what to do for ordinary application programs is contraindicated :).
- Active sets of diagnostic rules. General - diagnostics of general purpose, Optimization - micro-optimizations, 64-bit - 64-bit diagnostics, MISRA - diagnostics of standards MISRA C and MISRA C ++. Now the window displays all kinds of alerts.
- Shows the number of messages marked as false (False Alarms). You can enable / disable the display of marked messages in the settings, PVS-Studio> Options ...> Specific Analyzer Settings> Display False Alarms.
- Quick filters. You can, for example, leave in the list only messages with the code V501 and that are in the XYZ project.
- Some diagnostics suggest paying attention not to one, but several lines. In this case, an ellipsis appears next to the line number. Clicking on it with the mouse, you can see a list of lines and select one of them.
The table with diagnostic messages is divided into the following columns:
- Level. The confidence level that an error was found. Level 1 (red) - the most suspicious places. The 3rd (yellow) level is most likely a minor inaccuracy in the code.
- Asterisk She has no specific purpose. The user can interpret it at his discretion. For example, he may note the most interesting warnings for further careful analysis. Analogy - mark with asterisks of letters in mail program like Thunderbird or Outlook.
- Id . Unique message number. It can be useful when working with a large list. For example, you can go to the message with a specific number (see “Navigate to ID ...” in the context menu ).
- Code . The message code. If you click on it with the mouse, the page with the description of the warning will open.
- CWE. Allows you to identify a warning code CWE (Common Weakness Enumeration). When you click on the link, you can see the description of this CWE in the network.
- MISRA. Same as above, but only for the MISRA standard .
- Message . The text of the diagnostic message.
- Project . Project name (you can disable this column using the context menu).
- File . File name.
- Line . Line number Important! Notice that there are ellipsis after some lines. Example: “123 (...)”. By clicking on this number, you will receive a list of all lines of code that relate to this message. At the same time it is possible to go to each of the lines in the list.
Yes, it was tiresome to read. However, I assure you, starting to use, you quickly get comfortable with the tool. And you will rarely press something to adjust.
Context menu
So, by double-clicking on a message you go to the desired code snippet. By pressing the right mouse button opens the context menu.
The menu is quite simple, and you should not overload the article with a description of each of the items. If something is not clear, you can peek into the documentation.
However, I want to dwell on one very useful feature. Remember that in the settings you can add folders / files to exclude (see Figure 2). So, adding something is much easier than it seems!
Pay attention to the item “Don't check files and hide all messages from ...”. Clicking on it will drop a list of paths that can be added to the exception (see Figure 6).
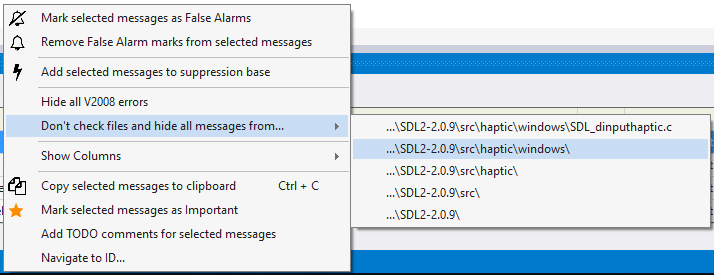
Figure 6. Excluding files from scanning.
You can select both a single file and one of the directories. The figure shows that the folder “SDL2-2.0.9 \ src \ haptic \ windows” is selected. This means that all files in this folder and all subfolders will be excluded from the analysis. Moreover, all messages related to these files will immediately disappear from the list. Very comfortably. You do not need to restart the analysis to remove all messages related to the tests.
Incremental analysis mode
An introduction to PVS-Studio will be incomplete, if you don’t tell about one of the most important features - incremental code analysis .
The earlier the error is found, the cheaper its elimination. It is ideal to immediately emphasize errors in the edited text of the program. However, it is technically difficult and resource-intensive. Therefore, PVS-Studio runs in the background at the moment when the corrected code is successfully compiled. Thus, errors in just changed code are looked for. The fact that an analysis is taking place can be judged by the icon in the system notification area.
When an error is found, a pop-up warning window appears (see Figure 7).
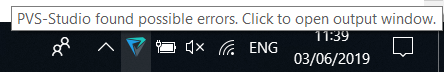
Figure 7. A pop-up message stating that suspicious places were found in the edited files.
If you click on the icon, the IDE opens with the result of checking the project (see Figure 2) and you can examine suspicious code fragments.
In fact, than to describe this mode, it is easier to try to work with it. You write the code as before. And if necessary, the analyzer will disturb you. Try it!
We ourselves constantly use this mode. Yes, we also sometimes make mistakes when coding. And the ability to immediately fix them significantly reduces the time to detect a defect and try to understand why the program does not behave as planned. It’s a shame to spend 15-20 minutes debugging to find a typo in the index. Here is one of the cases when PVS-Studio found an error in PVS-Studio right after it appeared in the code:
if (in[0] == '\\' && in[1] == '.' && in[1] == '\\') { in += 2; continue; } But this, of course, flowers. The PVS-Studio analyzer can sometimes be much more useful. Here is one of the reviews about our analyzer: " An example of using a static analyzer ." The text makes you think.
I summarize. Incremental analysis is something you should definitely try. You will love it as soon as you find a couple of blunders in the fresh code.
PVS-Studio features
We will be short. It is impossible to concisely describe all the diagnostics that are available in PVS-Studio. A complete list of diagnostics and their detailed description can be found in the documentation: Description of diagnosed errors . We confine ourselves to a table in which diagnostics are grouped by type. Some diagnostics are included in more than one group. The fact is that the division is very conditional. For example, a typo can lead to the use of uninitialized memory. Some errors on the contrary places in the table was not found, they are too specific. However, the table as a whole gives an idea of the functionality of the static code analyzer (see Figure 8).
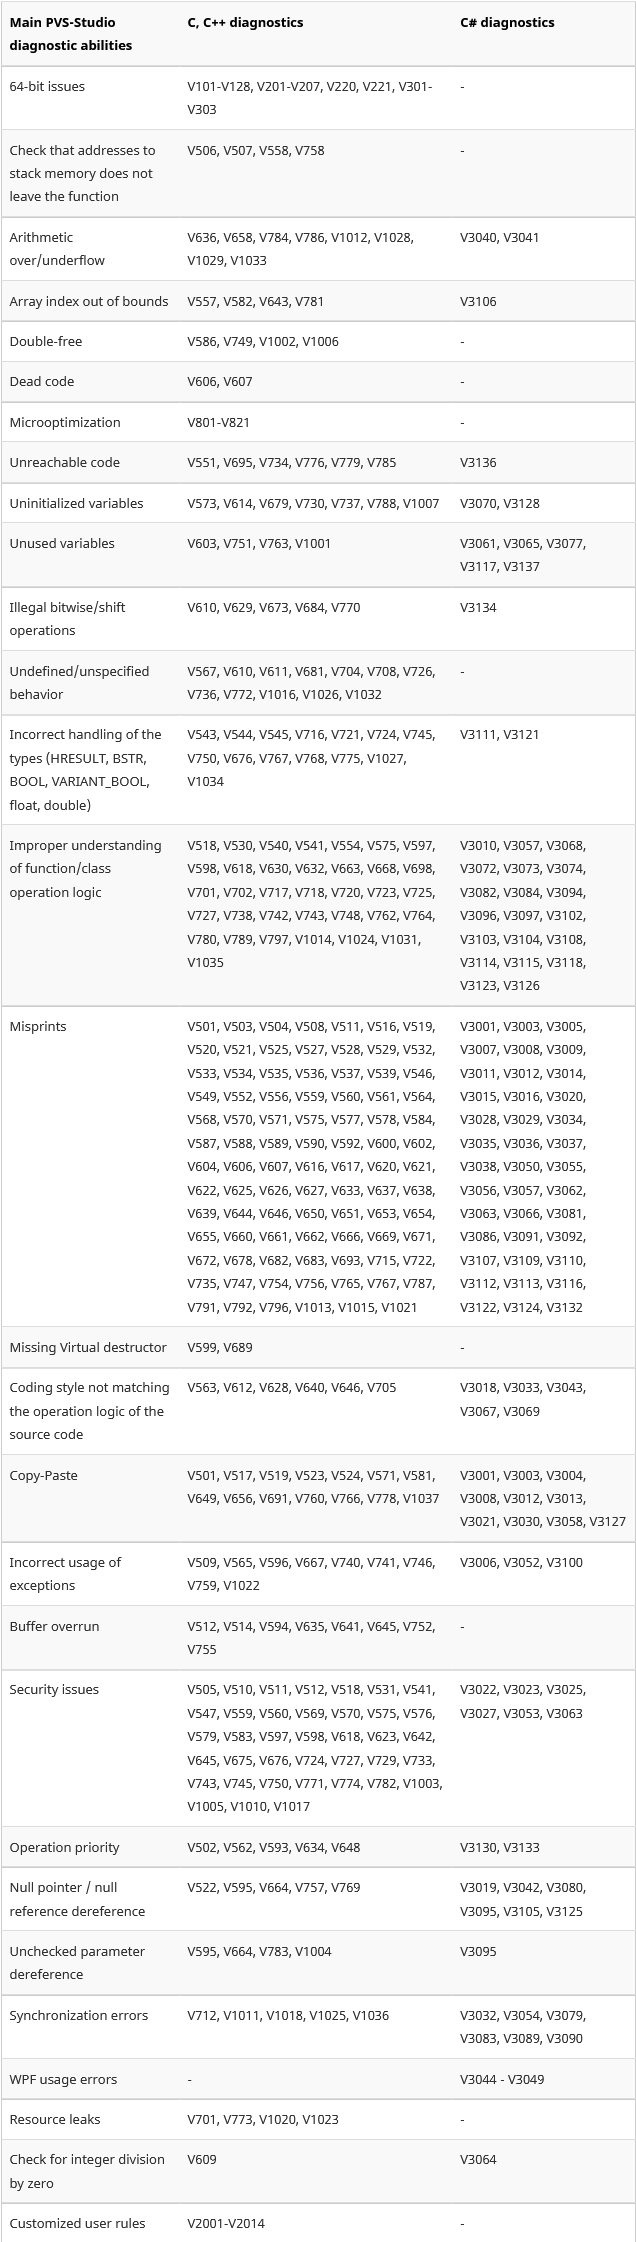
Figure 8. PVS-Studio features.
As you can see, the analyzer maximally manifests itself in such areas as the search for errors caused by typos, Copy-Paste. Well diagnoses problems that are related to code security.
How all this works in practice, you can find out by looking into the database of errors . We collect in this database all the errors that are found by checking various Open-Source projects.
SAST
PVS-Studio is a tool for static application security testing (Static Application Security Testing, SAST) - the analyzer can detect potential vulnerabilities in the project code and show the corresponding error identifier in a particular classification.
PVS-Studio supports the following classifications of errors:
- CWE
- SEI CERT
- Misra
You can enable the display of CWE codes via the context menu in the analyzer window along the path Show Columns> CWE
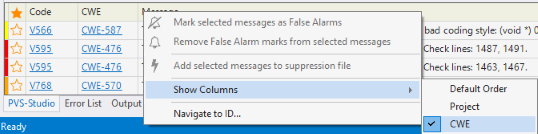
Figure 9. The context menu and sample output of CWE codes.
Or in the menu at the top (Extensions> PVS-Studio> Display CWE Codes in Output Window)
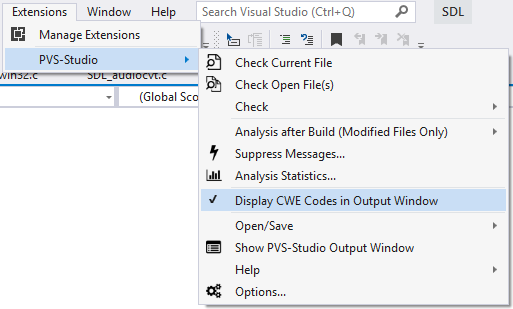
Figure 10. Extension menu.
MISRA diagnostics are included separately in the settings:
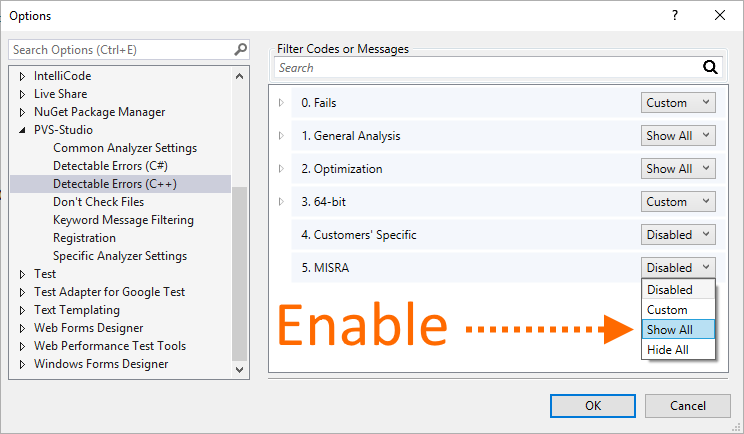
Figure 11. List of detectable errors.
Read more about these classifications here .
Check projects from the command line
PVS-Studio_Cmd.exe is a utility for testing C ++ / C # Visual Studio projects (.vcxproj / .csproj) and .sln solutions from the command line. It can be useful for automating analysis. The program is located in the directory where the installation was made - the default is 'C: \ Program Files (x86) \ PVS-Studio'.
The program has many parameters , but first we need only 3 of them:
- --target: the project or solution file to check.
- --output: plog file to write the report to.
- --progress: show scan progress.
This is what the launch will look like:
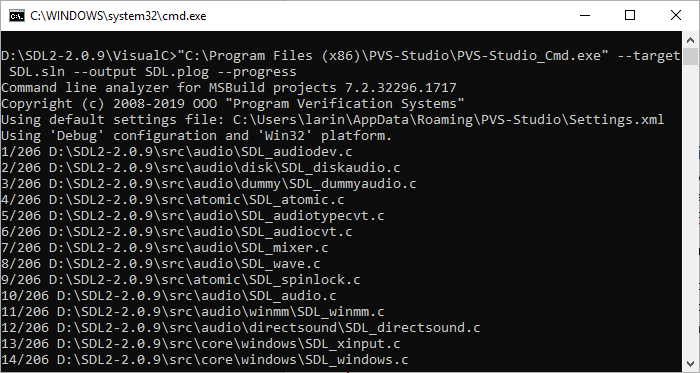
Figure 12. PVS-Studio_Cmd.exe program output
After execution, we will receive a plog-file with the report, the path to which we indicated in the launch parameters. This report can be converted to other formats using the PlogConverter.exe utility, and to view the report in the IDE, double-click on the plog file in the explorer.
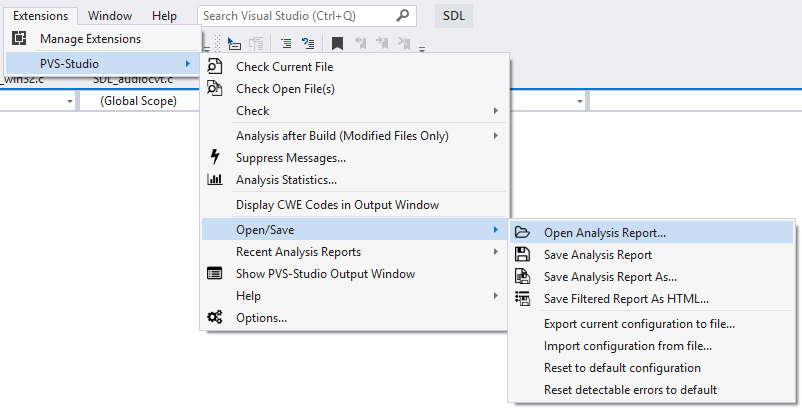
You can also open the report file in the extensions menu under the path Extensions> PVS-Studio> Open / Save> Open Analysis Report ...
Detailed information on the utility and its parameters can be found in the documentation .
Suppression of false warnings
Some messages issued by the analyzer will inevitably be false. Nothing can be done about it. A static analyzer is just a program that does not possess artificial intelligence and cannot precisely determine whether it has found a real error or not.
To combat false positives, a set of various mechanisms is provided in the analyzer. They are described in detail in the following sections of the documentation:
- Fine tuning .
- A coarse method that allows you to work only with warnings related to new or modified code.
Conclusion
Of course, here we told not everything about the instrument. If you tell everything, the article will turn into documentation. The goal was to show how easy it is to work with a tool within the Visual Studio environment. About other environments and modes of operation can be read in the documentation and other articles located on our website . There, by the way, a lot of interesting things for programmers. Come to wander.
It is worth noting that PVS-Studio works not only in the environment from Microsoft. We also support the Java language, we can work under Linux and macOS, integrate into CMake and a lot more. Read more in the documentation .
I wish you a reckless code and I hope that you will enjoy PVS-Studio. If you have any questions, we will always help and advise. Write to us .
Additional resources:
- Code review .
- Static code analysis .
- Static code analysis tools .
- SAST .
- Technologies used in the PVS-Studio analyzer .
- Download PVS-Studio and try it out.
- Visual Studio 2019 support .
- Discuss the price of the PVS-Studio analyzer for your team and how to acquire it: buy PVS-Studio .
- An example of using a static analyzer .
- Answers to frequently asked questions at conferences.
- How to run PVS-Studio Java
- How to run PVS-Studio in Linux and macOS

If you want to share this article with an English-speaking audience, then please use the link to the translation: Sergey Larin. PVS-Studio for Visual Studio
Source: https://habr.com/ru/post/458070/
All Articles