Auditing user access levels using Power BI using the example of CMS Bitrix (BEADS)
The article shows an example of using Power BI to analyze user access on a site running 1C-Bitrix.
Problem
Over time, the development of Internet resources is connected by more and more users in one way or another, having more rights than the ordinary user of the site.
In this regard, it is increasingly difficult to control access to confidential functions. Well, if written regulations that help control access at a more or less secure level. But it often happens that colleagues go to work in other departments, go to the decrees :) or leave, and access remains.
')
Naturally, this carries different threats: a leak of the customer base and, right up to sabotage, etc.
The age of projects with which I have been working has already been 10 years. The database has hundreds of thousands of users, including hundreds with privileged rights.
This article shows an example of how to simplify the audit of users to various objects of the site under the control of CMS Bitrix (BEADS).
The problem is that the admin Beatrix does not allow to get a complete picture with accesses; it is unpleasant to click on a bunch of links and wait for admin pages to load.
As a main tool for this Power BI will be used (a bit not in its main purpose :)
It is assumed that the reader is already familiar with Power BI at the basic level, knows the basics of SQL, and knows how to use the Bitrix admin panel too. Standard Bitrix features in terms of access will be considered.
Disadvantages of the Beatrix admin
It is impossible to conduct a revision in a standard admin panel in a reasonable time due to the lack of a coherent picture with accesses - summary data on all modules / sections / info-blocks, etc., to which access is granted.
Admin performance:
- In the “User Groups” section of the Bitrix admin box there is a feature that generates a SQL query to select all groups with counting the number of users. All is well when the base is small. But with a base of hundreds of thousands of users, with hundreds of user groups on a dedicated server with 128 GB of RAM, simply opening this section takes 8 seconds.
- In the group card there is also a request that for some reason selects all user groups, instead of receiving data only on the selected one. Losses on waiting 3 sec.
Solutions
Usually there are several solutions to the problem.
- Write regulations on providing access to sites and clearly follow them.
- Periodically conduct an audit of accesses.
- Hope for the best and not spend the limited resources of the company.
This article will be considered just the second way.
Tasks
- Choose tools that will allow you to quickly obtain data on the access levels of each user with extended rights.
- Customize the tools so that they clearly show the picture with accesses in general with the necessary detail and interactivity.
- To conduct an access audit.
Access storage in Bitrix
Bitrix allows you to flexibly configure the rights through user groups.
Access settings are stored mainly in MySQL tables. Some of the settings are stored in files. For example, access to files and folders is stored in .access.php files.
The analysis of the access of users and user groups to:
- info blocks
- web forms with access level
- web form status with access level
- sections of the site
- Bitrix modules with access levels
Instruments
- Power BI Desktop, which allows to visualize data well, get data from multiple sources (almost) out of the box. Actually, Power BI can be replaced with regular Excel 2016 and higher - PowerQuery is already included in its delivery, through which all data can be selected for analysis. However, Power BI allows you to interactively display data based on their relationships, and this allows you to quickly find hidden dependencies.
- MySQL Connector will need to be able to create a query through Power BI to a MySQL web server.
- Kitty or Putty for the organization of the tunnel to MySql, if access to the database is open only through SSH.
The following access scheme is obtained: Power BI → MySQL Connector → Kitty → MySQL.
Power BI
Power BI Desktop allows you to visualize data well, get data from multiple sources (almost) out of the box. Actually, Power BI can be replaced with regular Excel 2016 and higher - PowerQuery is already included in its delivery, through which all data can be selected for analysis. However, Power BI allows you to interactively display data based on their relationships, and this allows you to quickly find hidden dependencies, which is what we need for auditing access.
You can download it on the official page .
MySQL Connector
Go to the page . Download and install. Sometimes you have to restart your PC after installation.
Kitty / Putty
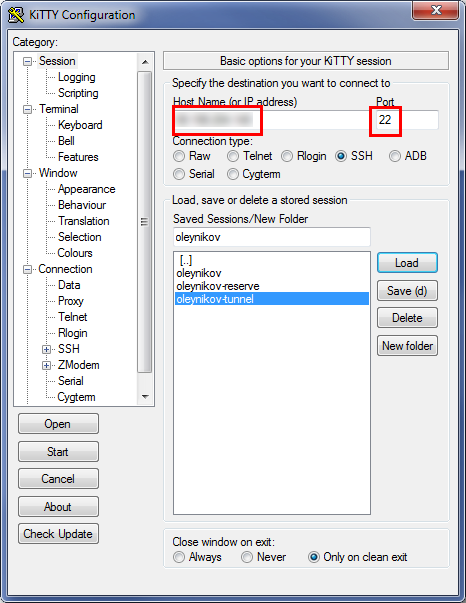
To perform SQL queries to the Bitrix database, you will need to configure the tunnel.
- Enter the server IP and port
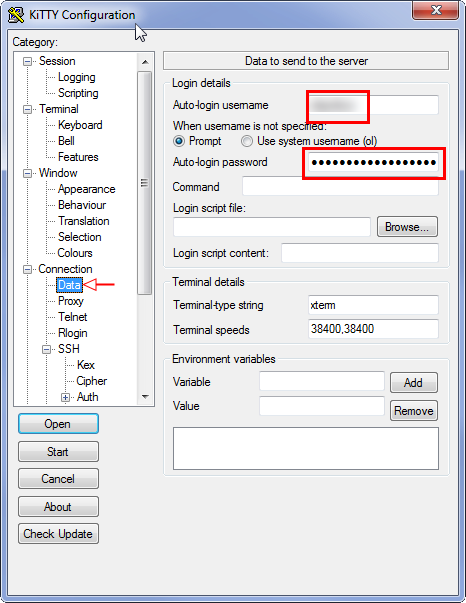
- We hammer in login and the password on SSH
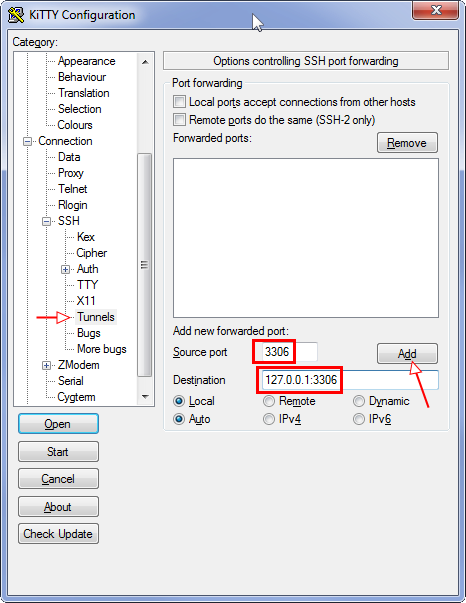
- We do port forwarding:
- We save in the profile the settings made for future uses:
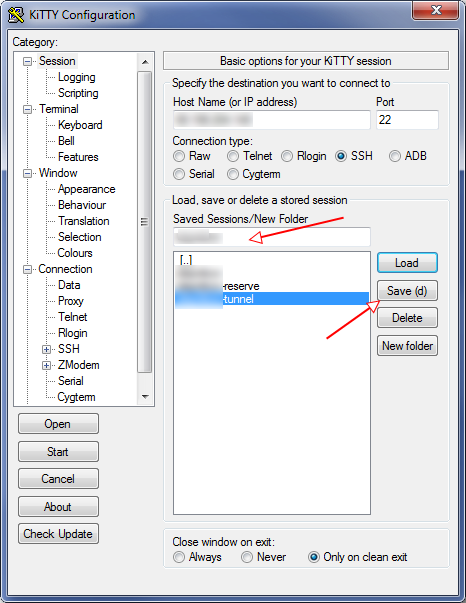
- We start.
You can also just download Putty and run it with the command:
putty.exe -ssh "USER@HOST" -pw "PASSWORD" -2 -v -P 22 -L 3306:127.0.0.1:3306 Naturally, Kitty / Putty should be running before updating data in Power BI.
Users and user groups
As in many CMS, Bitrix has a mechanism for differentiating access rights through user groups.
Upload the following entities to the Power BI data model from the database:
- Groups
- Users
... as well as group and user relationships.
Groups
We confine ourselves only to active groups.
The list of groups is stored in the b_group table.
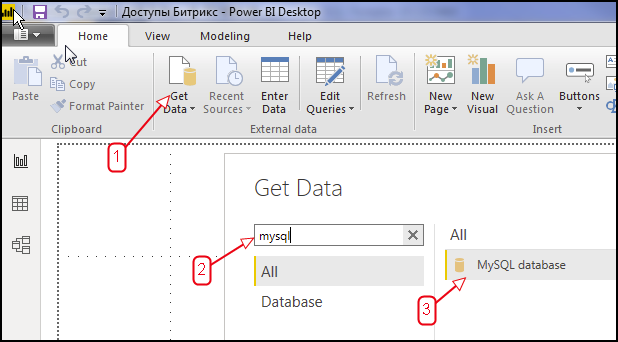
- Create a connection:
- Enter:
- in the Server field: localhost: 3306
- in the Database field: bitrix_db (the name of the database with which Bitrix works)
- SQL query:
SELECT id, timestamp_x, active, name, description, anonymous FROM b_group WHERE active = 'Y';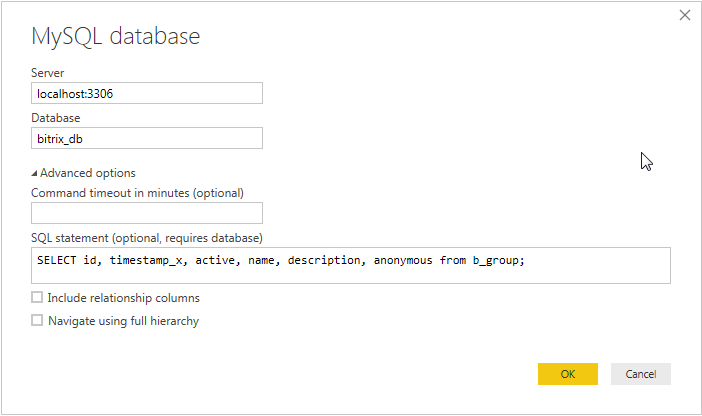
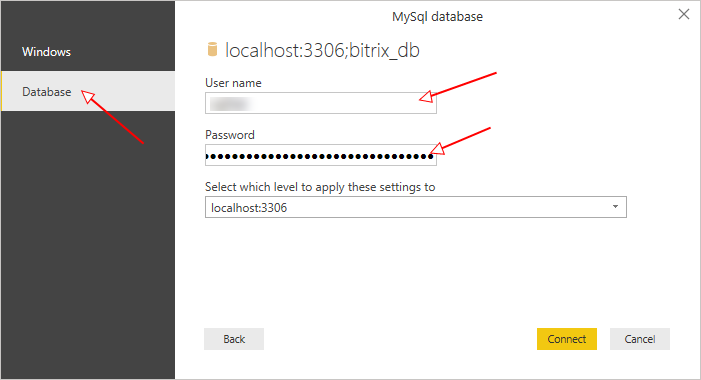
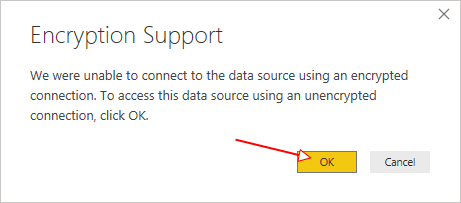
- Enter the username and password to the database and send the request:
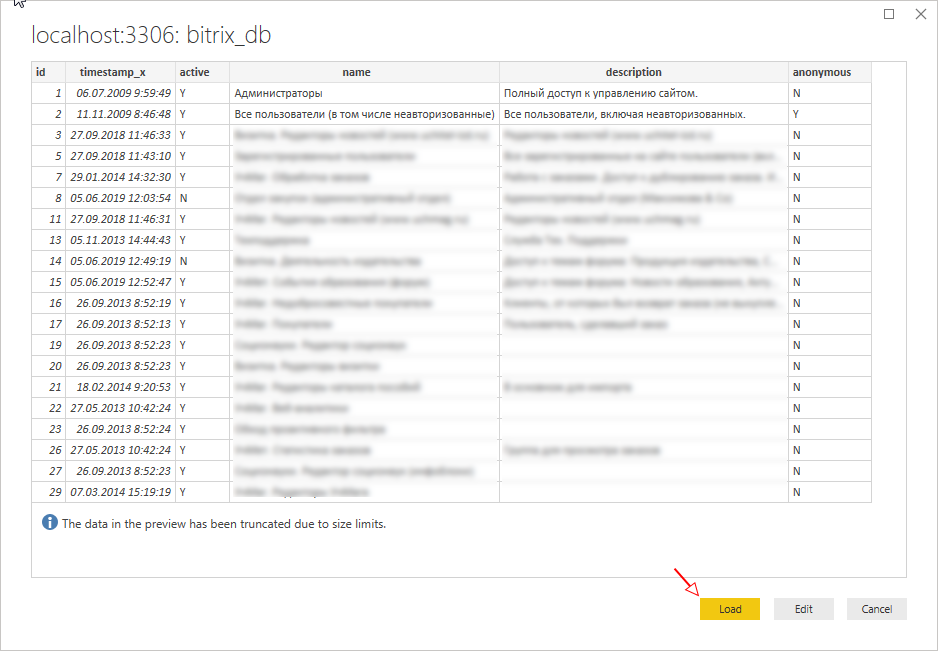
- Immediately give a friendly name request:
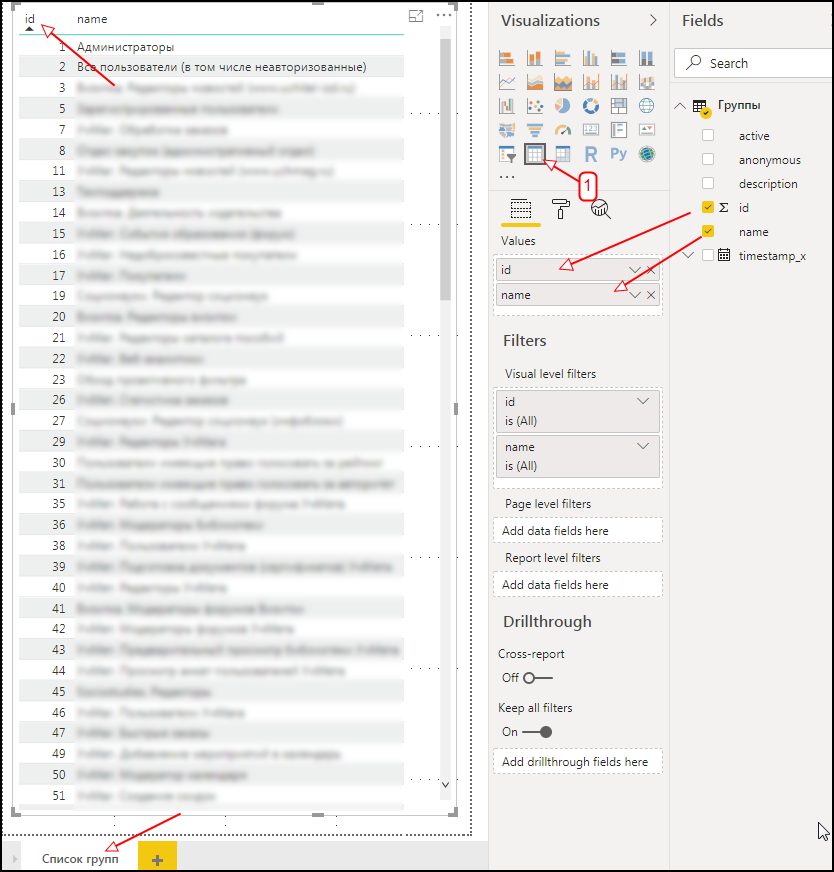
- We list the groups on a separate sheet in tabular form:
This method of extracting and presenting data will be similar for other queries related to the Bitrix database.
Users
Now unload all users who have extended rights. But you should not upload users included only in groups that do not give them any additional rights, for example, “All users, including unregistered ones” (it is worth noting that the connection of this group with users is stored for all users registered up to version 12. In newer versions, the group is considered to be systemic and no longer stores data about user connections.)
We restrict ourselves to activated users.
For this you need:
- Select all group IDs that give extended rights. This is necessary to save on traffic, because The number of entries in b_user_group can reach millions, depending on the complexity of the project.
- Create a dynamic request to unload User-Group links
- Unload users who have a link from item 2.
Let's start:
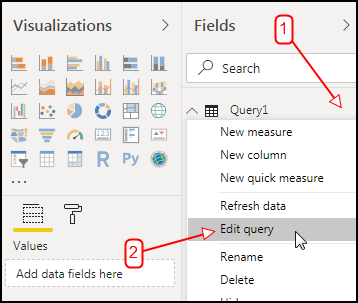
- Call the query editor: Home → Edit Queries
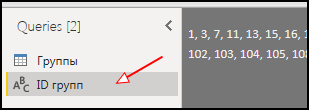
- Create a link to the original request of the “Group”:
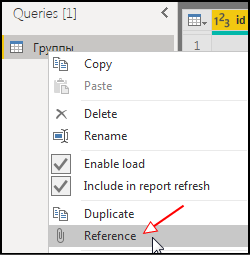
- Rename the new request to “ID groups” and filter select only those groups that are interesting from a security point of view.
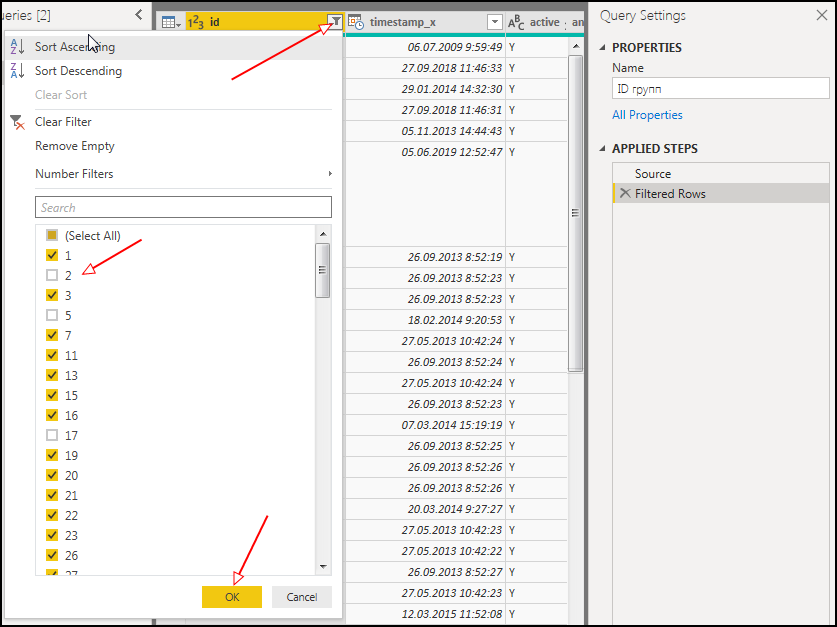
- Now we get a string containing the group ID separated by commas:
- Add a custom column: AddColumn → General → Custom Column
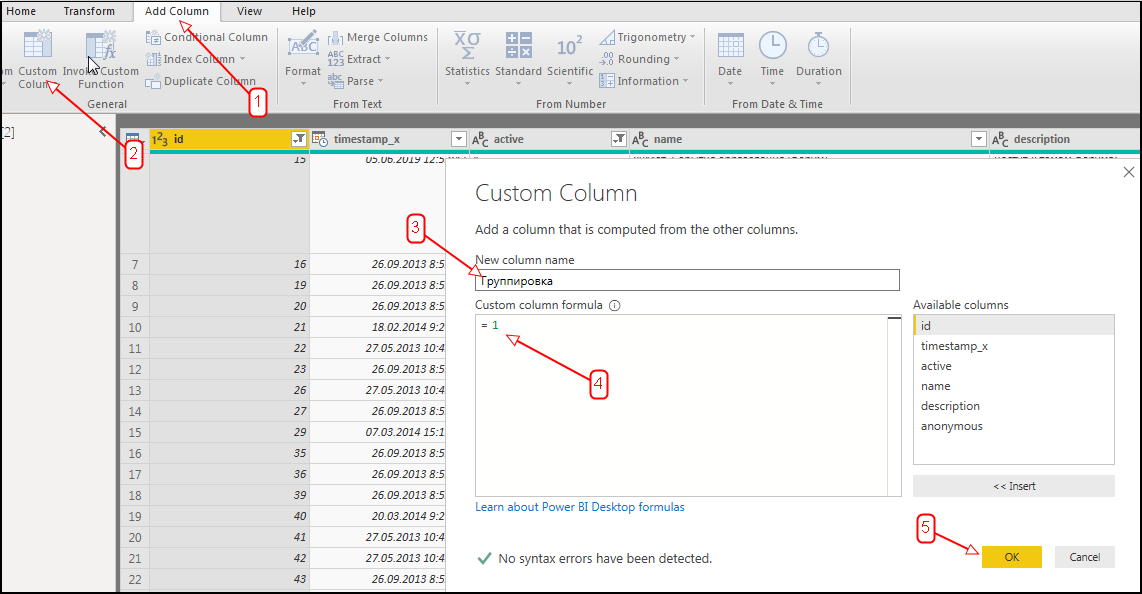
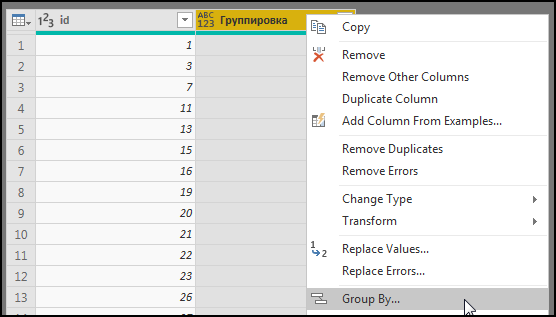
- Delete all columns except ID and Group:
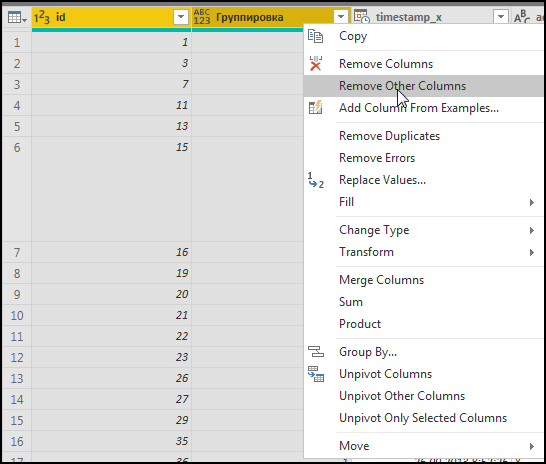
- Group by “Grouping” column:
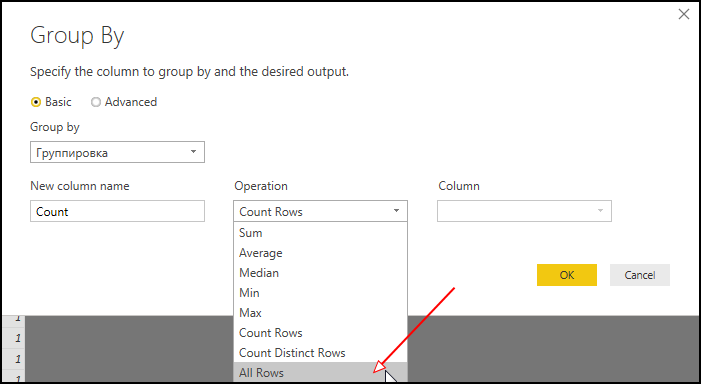
- Add one more column as follows:
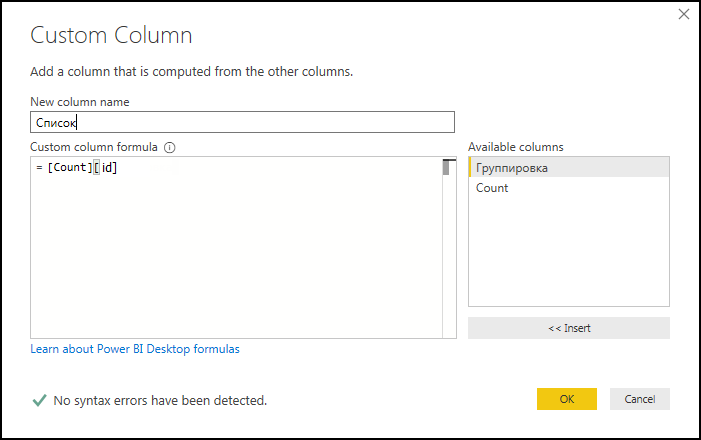
- Let's open the list so that we get the values separated by commas:
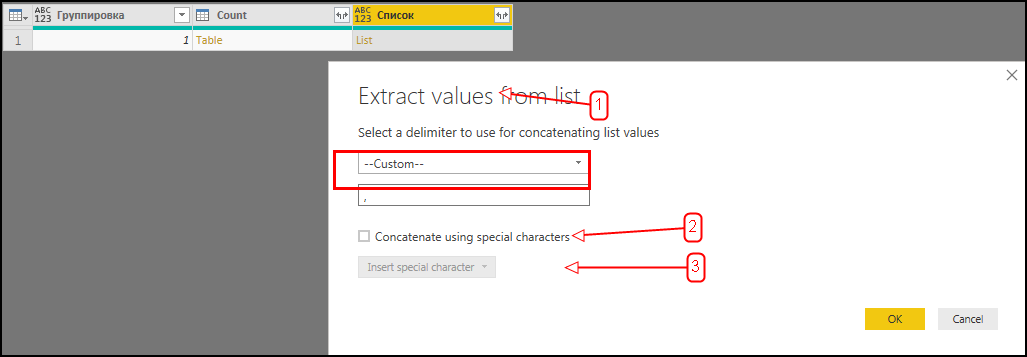
- And fall into the resulting cell:
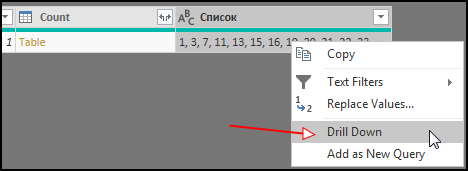
- Power BI then converts the query into a variable that can be used in dynamic SQL queries:
- Add a custom column: AddColumn → General → Custom Column
- Create a query “User-group”, containing the connection of the user with the group, in the same way as it is done in the section “Groups”.
SQL query:SELECT ug.user_id, ug.group_id FROM b_user_group ug JOIN b_group g ON g.id = ug.group_id JOIN b_user u ON u.id = ug.user_id WHERE g.ACTIVE = 'Y' AND u.ACTIVE = 'Y' AND ug.group_id IN ();
XXX will need to be replaced with group IDs separated by commas. - Let's call the source code of the request for editing and replace it with the following:
let sql = "SELECT ug.user_id, ug.group_id #(lf)FROM b_user_group ug #(lf)JOIN b_group g ON g.id = ug.group_id #(lf)JOIN b_user u ON u.id = ug.user_id #(lf)WHERE g.ACTIVE = 'Y' #(lf) AND u.ACTIVE = 'Y' #(lf) AND ug.group_id IN ("&#"ID "&");", Source = MySQL.Database("localhost:3306", "bitrix_db", [ReturnSingleDatabase=true, Query=sql, CreateNavigationProperties=false]) in Source - After that you can get the following warning:
Formula.Firewall: Query '-' (step 'Source') references other queries or steps, so it may not directly access a data source. Please rebuild this data combination.
To get rid of it, you need to change the privacy level: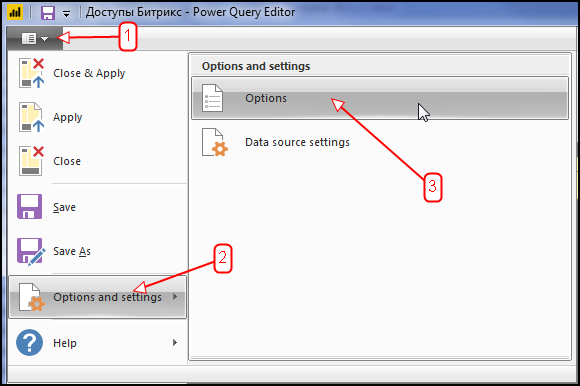
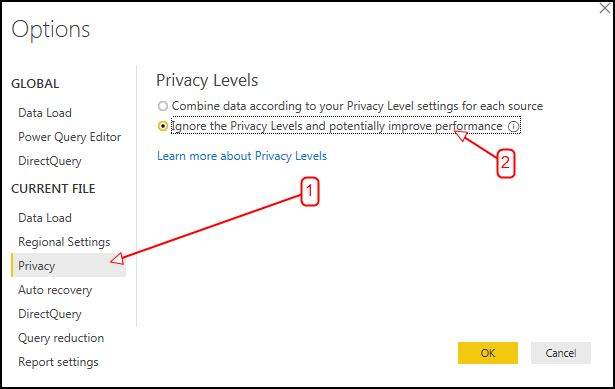
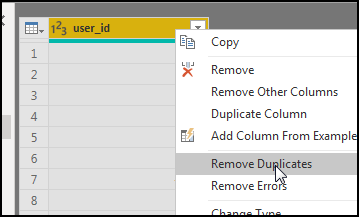
After that, refresh requests. - We make the variable “User IDs” in the same way as it was done for “ID groups” (that is, we make a link from the request Users, etc.). With its help, we will generate a SQL query that will allow you to select only the users you need to analyze. Pre-remove duplicate user_id:
- Create a request to select users, in the same way as it was done for the “User-group”.
SQL: SELECT id, last_name, NAME, email, date_register, last_login FROM b_user WHERE active = 'Y' AND id IN ( );
XXX will need to replace user IDs.
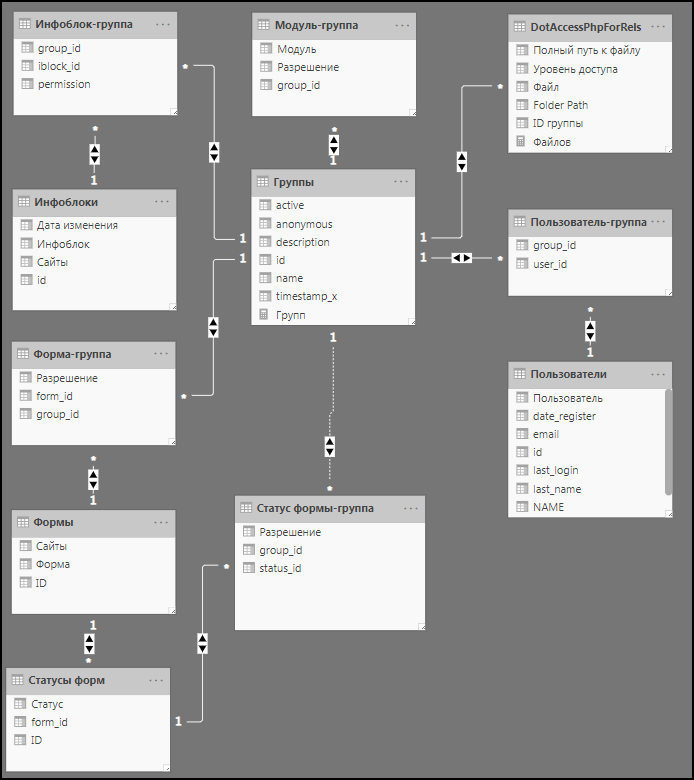
Configuring the relationship between requests
In order for Power BI to interactively filter data in different views, you must define the relationships between queries. In our case, we need to link the fields:
- “User-Group” [group_id] → “Groups” [id]
- “User-group” [user_id] → “Users” [id]
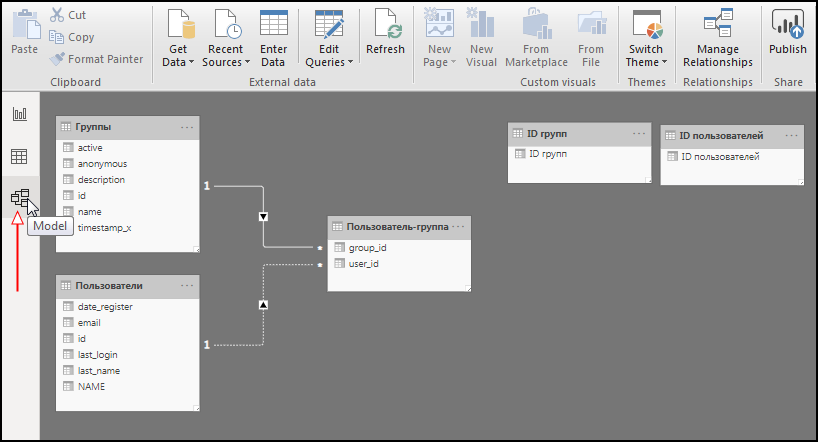
Similarly, we will link other queries.
Report on users and user groups
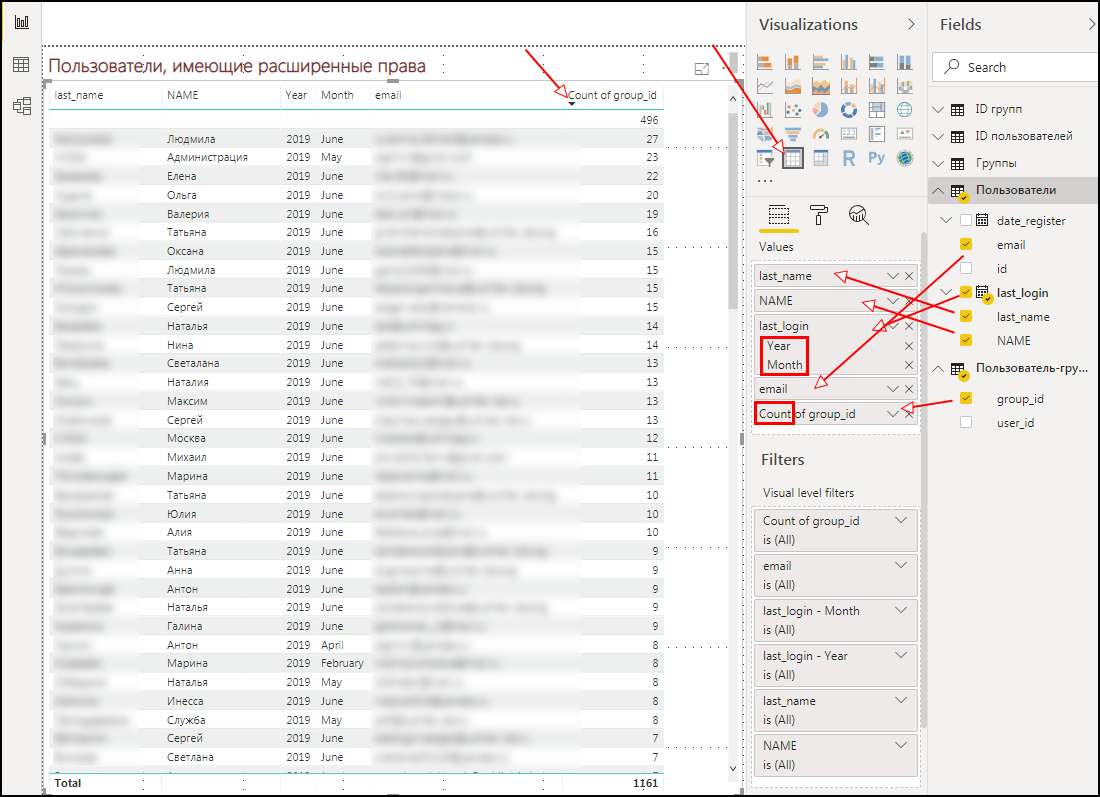
On the Reports tab, we will display a list of users and groups using the Table as the visualization element.
From the query “Users” select the fields: last_name, name, last_login, email.
From the query “User-group” select the field group_id.
Because we assigned links between queries, then Power BI will be able to correctly use the aggregate Count function to count the number of groups that each individual user belongs to.
Add another Table next to it and select the name field from the “Group” request, and from the “User-group” request the user_id field - set the “Count (Distinct)” aggregation for it to see the number of users in the group.
Because “Group” and “User” queries are connected through the “User-group” associative query, then when you click on a user in the table, only those groups that include the selected user are displayed in the table with a list of groups. And vice versa.
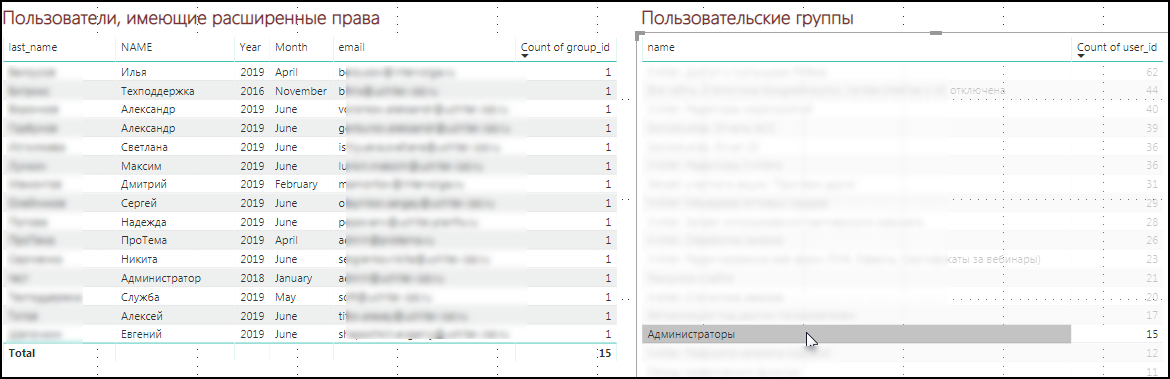
In this way, you can either click each user and see which groups he belongs to, or click on the groups and see which users belong to the group. Well, and then make decisions regarding changes in access for the user.
The following describes how to place the remaining tables in the overall Power BI report, since this is done in a similar way.
.access.php
In Bitrix, it is possible to set access to folders and files by specifying group numbers and the required access level in the .access.php files.
Our task is to bring the data from all .access.php files scattered across the project server into a tabular view.
For this:
- We search and archive all .access.php files from the server, saving paths to these files.
I used terminalku to search, copy and archive files found. Command example:find “BITRIX_PROJECT_DIR” -name '.access.php' -type f > “OUTPUT_DIR/.access.php.files.txt”&&tar cvfpz “OUTPUT_DIR/.access.php.files.tar” -T “OUTPUT_DIR/.access.php.files.txt”&&find “OUTPUT_DIR” -type d -exec chmod 775 {} \; && find “OUTPUT_DIR” -type f -exec chmod 775 {} \;&&find “OUTPUT_DIR” -type d -exec chown bitrix:bitrix {} \; && find “OUTPUT_DIR”/ -type f -exec chown bitrix:bitrix {} \;
Here:- BITRIX_PROJECT_DIR - folder with the project on Bitrix.
- OUTPUT_DIR - path to the folder where the .access.php.files.txt file will be placed with the list of found .access.php files, as well as the .access.php.files.tar archive containing copies of all found .access.php files.
Naturally, if there are a lot of projects (multisite is used), then we select a folder containing all the projects. - Download and unpack the archive with .access.php somewhere near the Power BI project.
I wrote a batch file that does this automatically: download is implemented via wget; through 7zip - unzipping.
Sample batch file: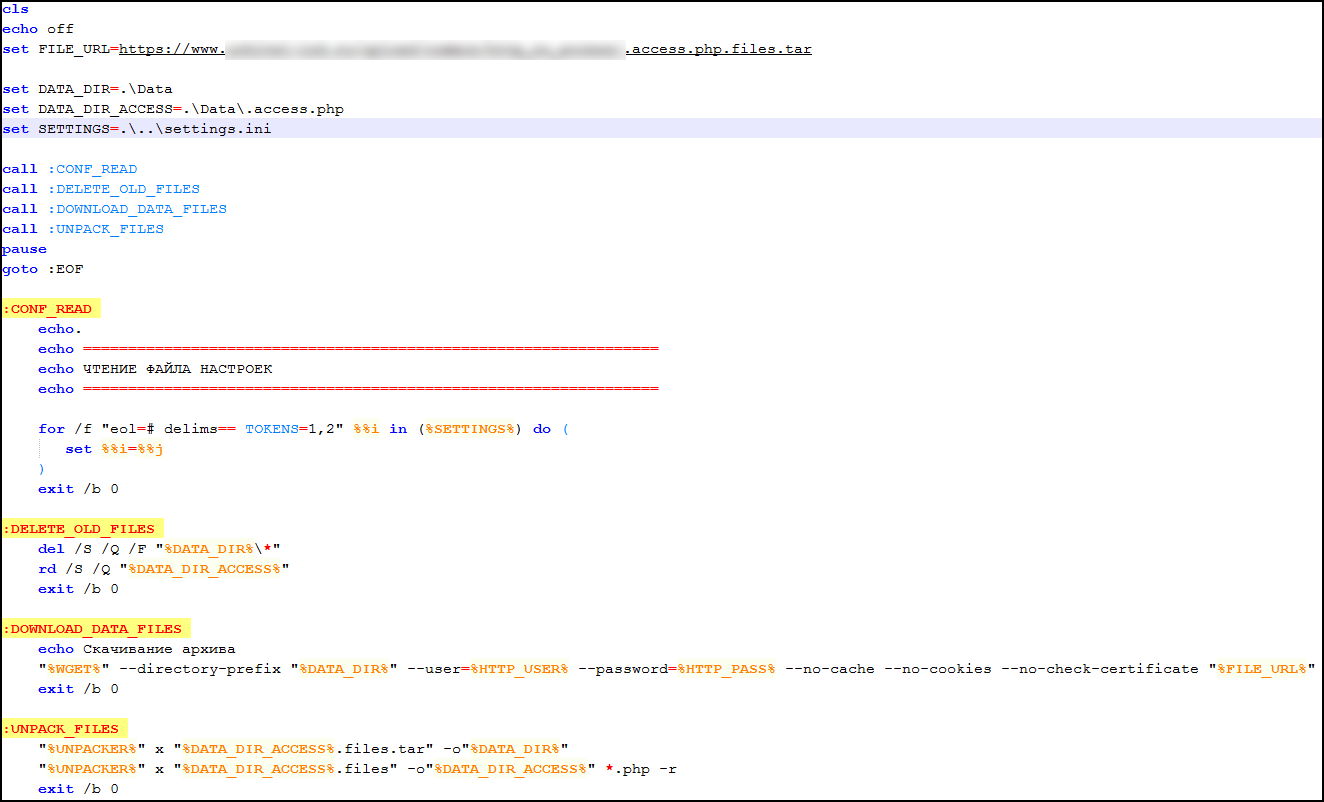
File containing settings for batch file: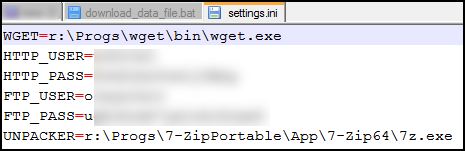
Now create a request that will reduce the contents of all .access.php in a table form.
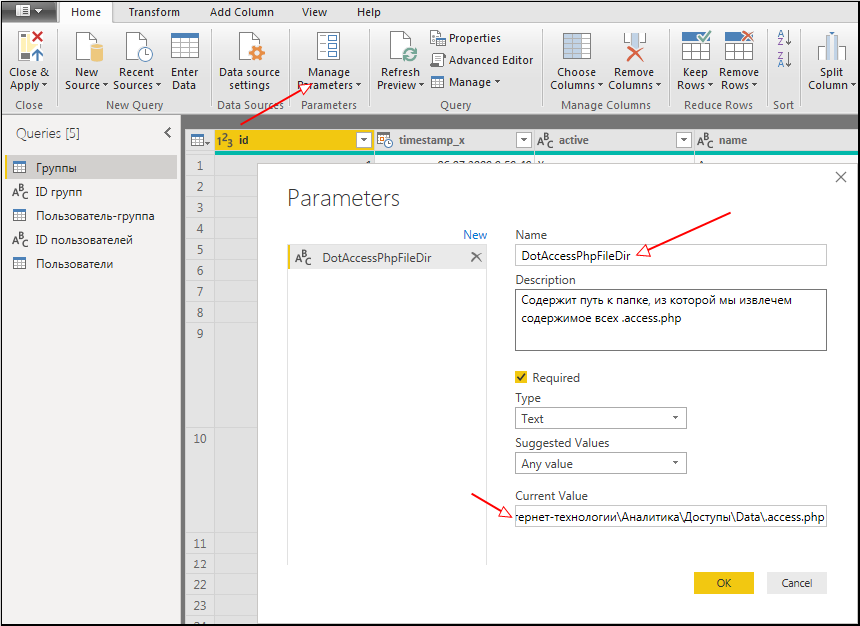
- For convenience, create a parameter that will contain the path to the folder from which we will extract the contents of all .access.php
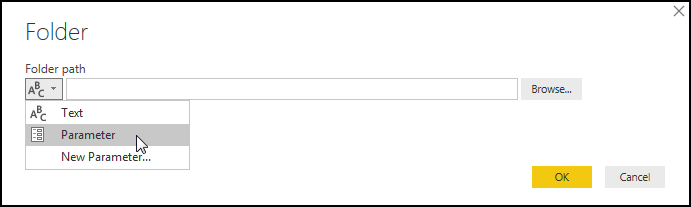
- Select a query of the “Folder” type and select our parameter as the path:
- Expand the Content field:
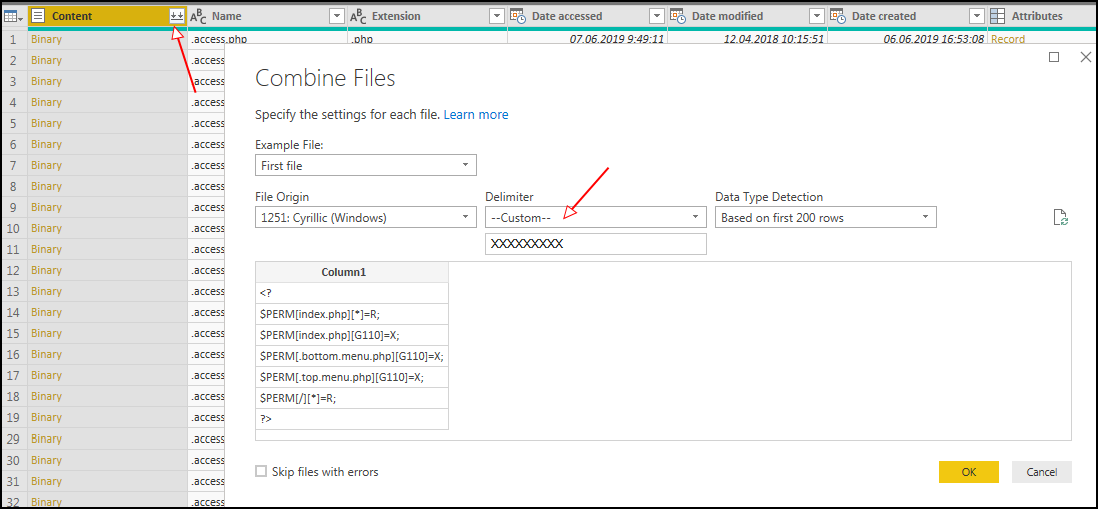
- this is a column delimiter, you need to have one column after importing data from all files. - After that, Power BI will remove the column we need containing the path to .access.php. Therefore, we need to edit the “Remove other columns1” step by selecting the “Folder Path” in it:
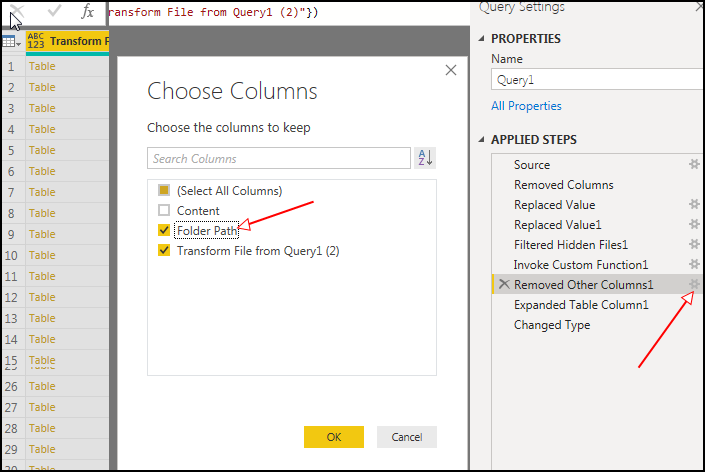
- We leave the column: Folder Path and Column1.
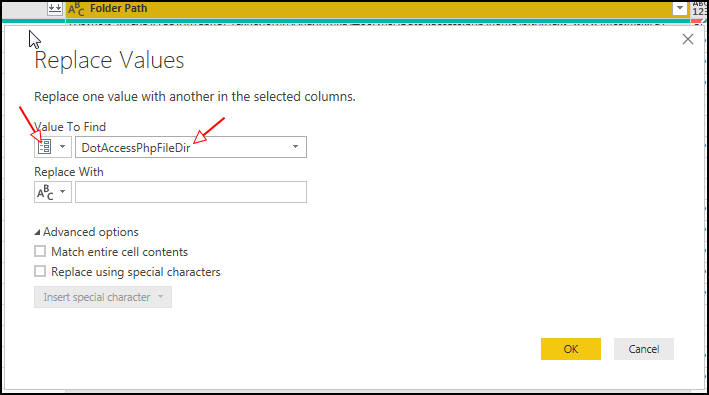
- To remove the absolute path to the local file from the Folder Path, use the replacement:
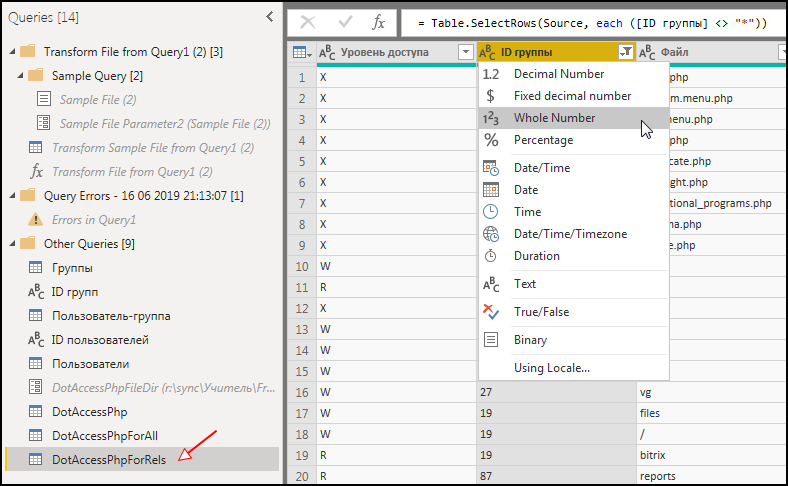
- The .access.php files contain access settings in the format:
$PERM[""]["ID "] = "< >";
Our task is to scatter the columns: Path, group ID, Access level. This is done with the help of filters, Split Column and Custom column. - The result should be the following table:
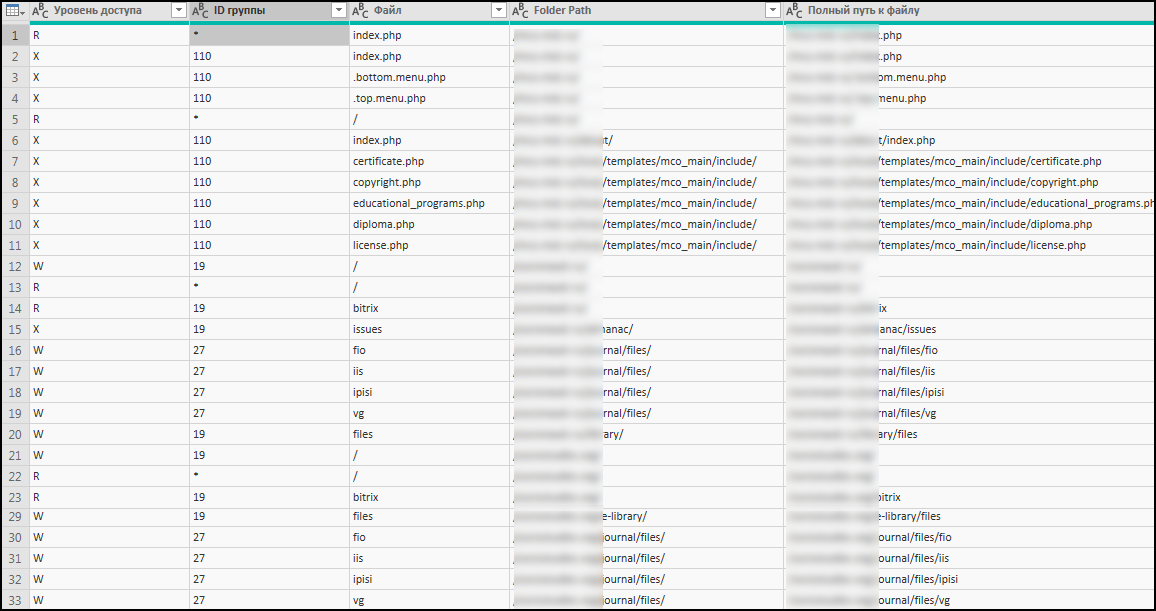
As you can see in the group ID field there is a “*” (access for all). In order to be able to specify a connection with other queries, we need to make this field integer, while not losing information about “*” (which means for all groups). We make two requests, such as a “link” to the original DotAccessPhp request:- The first DotAccessPhpForRels will contain only integer group IDs (using a filter, removing * in the group ID column) - we will link it with the other requests:
- The second is DotAccessPhpForAll - only * (we use a filter).
- The first DotAccessPhpForRels will contain only integer group IDs (using a filter, removing * in the group ID column) - we will link it with the other requests:
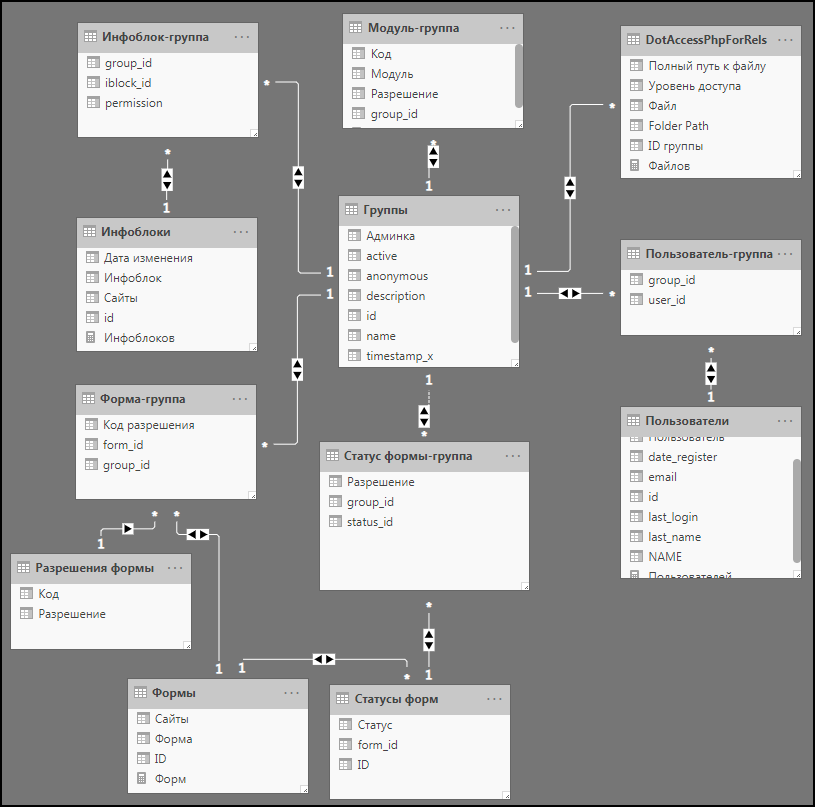
Relationship scheme:
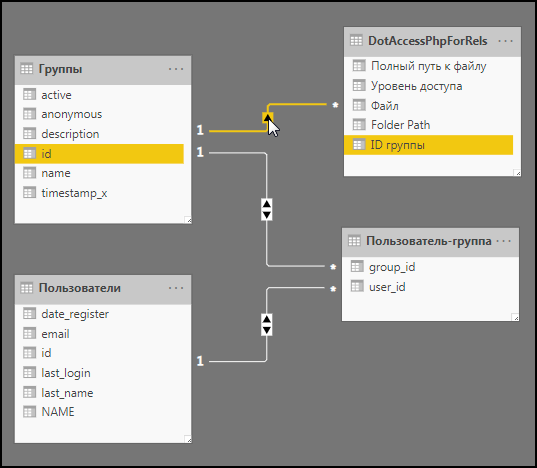
To select only the related data in other views when selecting a file from DotAccessForRels, you need to change the “Cross filter direction” parameter to Both:
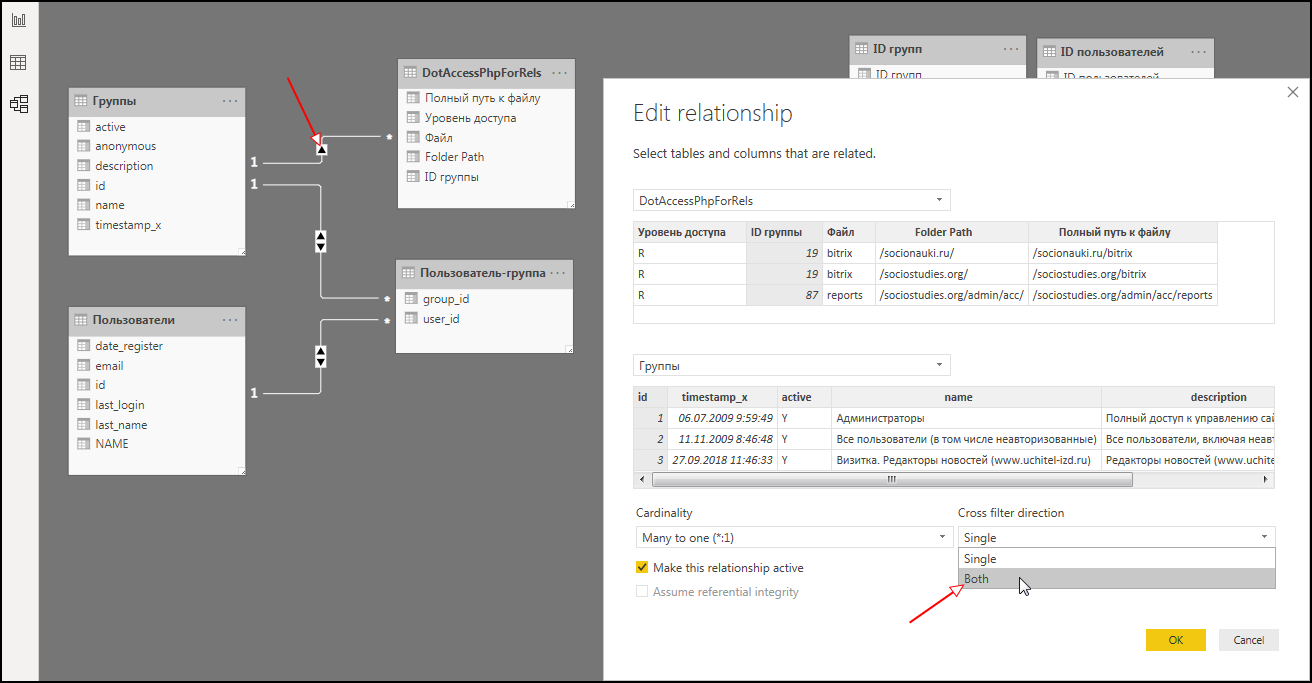
For other requests that will be added below, this also needs to be done.
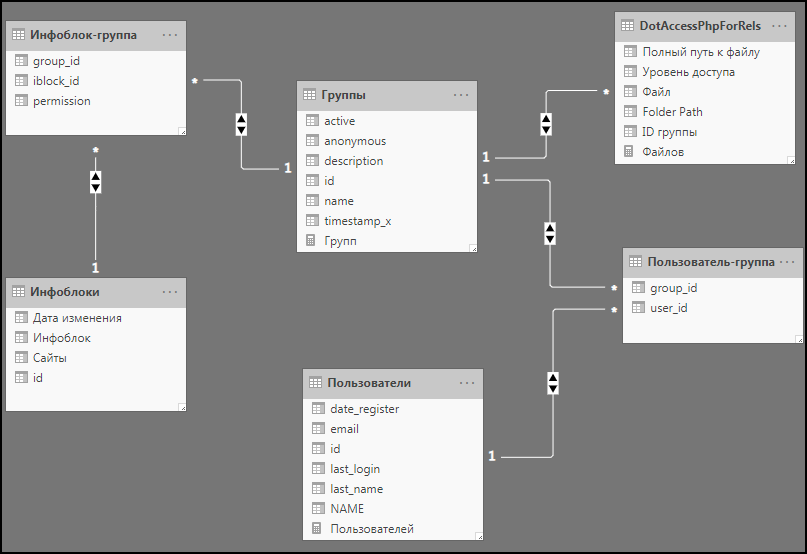
Info blocks
It is necessary to upload the list of info-blocks and the table of links between info-blocks and groups.
We will upload information only about active info-blocks.
- Create a query “Info Blocks”. SQL query:
SELECT i.id, i.NAME '', i.TIMESTAMP_X ' ', GROUP_CONCAT(ist.SITE_ID SEPARATOR ', ') '' FROM b_iblock i JOIN b_iblock_site ist ON ist.IBLOCK_ID = i.id GROUP BY 1,2,3; “-”: SELECT ig.iblock_id, ig.group_id, ig.permission FROM b_iblock_group ig JOIN b_group g ON g.id = ig.group_id JOIN b_iblock i ON i.ID = ig.IBLOCK_ID WHERE g.ACTIVE = 'Y' AND i.ACTIVE = 'Y'; - We update the linking scheme, not forgetting to change the “Cross filter direction” parameter on Both:
Forms
In the case of forms, rights for user groups are issued both on the forms themselves and on the statuses in which the result of filling in the form resides.
- Create a form request:
SELECT f.ID, f.name '', GROUP_CONCAT(f2s.SITE_ID SEPARATOR ', ') '' FROM b_form f JOIN b_form_2_site f2s ON f2s.FORM_ID = f.ID GROUP BY 1, 2 ORDER BY 2; - Create a query “Form-group”:
SELECT DISTINCT f2g.group_id, f2g.form_id, f2g.PERMISSION ' ' FROM b_form_2_site f2s JOIN b_form_2_group f2g ON f2g.FORM_ID = f2s.FORM_ID JOIN b_group g ON g.ID = f2g.group_ID WHERE g.ACTIVE = 'Y' ORDER BY 1, 2, 3; - Create a query “Status Forms”.
SELECT fs.ID, fs.TITLE '', fs.form_id FROM b_form_status fs JOIN b_form f ON f.ID = fs.FORM_ID WHERE fs.ACTIVE = 'Y' AND EXISTS (SELECT f2s.FORM_ID FROM b_form_2_site f2s WHERE f2s.FORM_ID = f.ID LIMIT 1) ORDER BY 3, 2; - Create a request “Statuses form group”
SELECT fs2g.status_id, fs2g.group_id, fs2g.PERMISSION '' FROM b_form_status_2_group fs2g JOIN b_form_status fs ON fs.ID = fs2g.STATUS_ID JOIN b_group g ON g.ID = fs2g.group_ID JOIN b_form f ON f.ID = fs2g.GROUP_ID JOIN b_form_2_site f2s ON f2s.FORM_ID = f.ID WHERE fs.ACTIVE = 'Y' AND (g.ACTIVE = 'Y') ORDER BY 1, 2, 3; - We update the link scheme:
Modules
- Create a query “Module-group”.
SELECT mg.MODULE_ID '', mg.group_id, mg.G_ACCESS '', t.LETTER, t.NAME FROM b_module_group mg JOIN b_group g ON g.id = mg.GROUP_ID LEFT JOIN b_task t ON t.MODULE_ID = mg.MODULE_ID AND t.BINDING = 'module' WHERE g.active = 'Y' AND mg.G_ACCESS = t.LETTER; - Updating links:
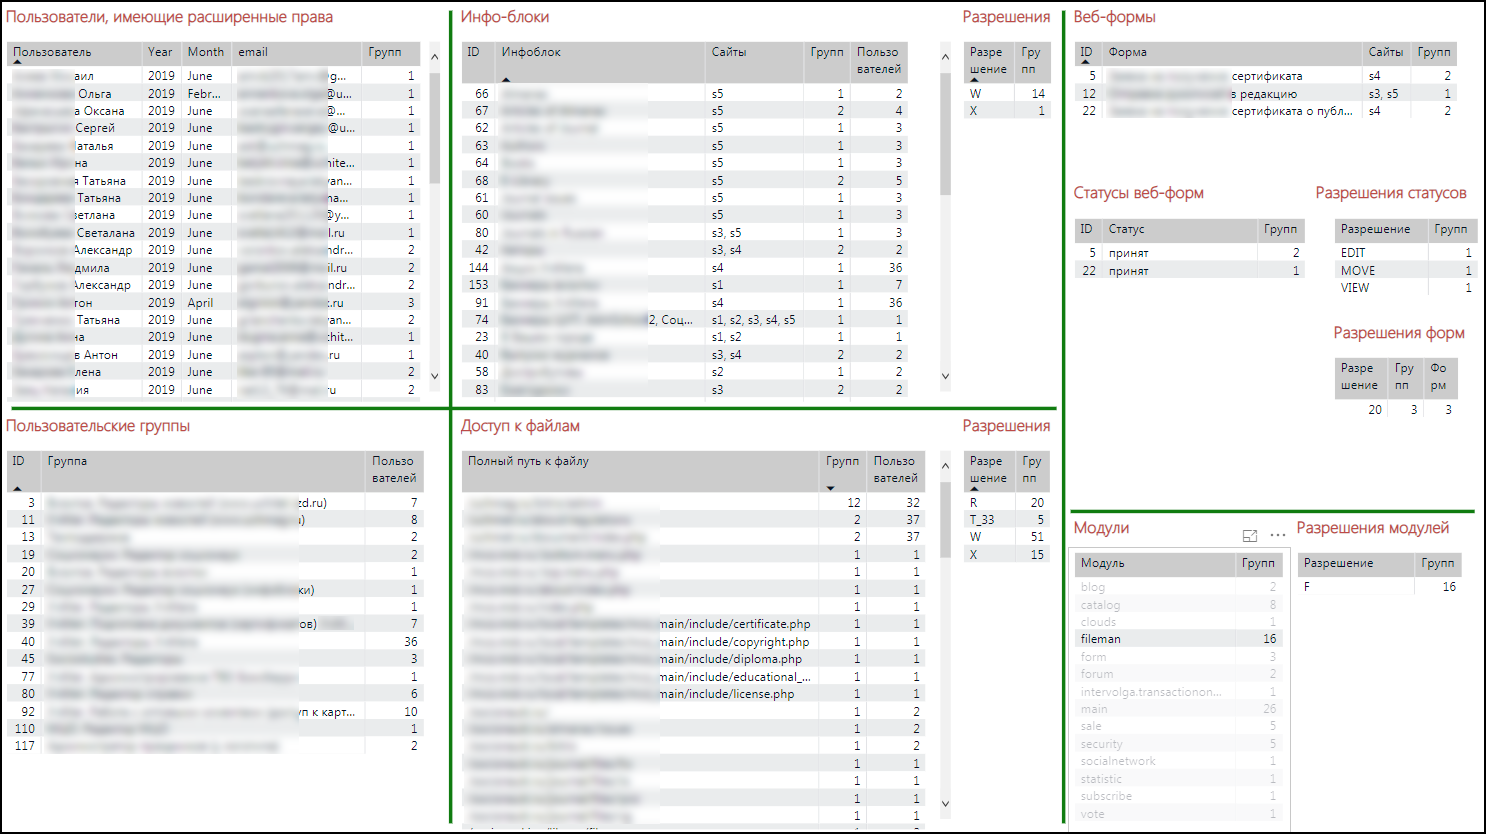
Scoreboard
Customize table styles, use the usable space to the maximum.
The result should be something similar to the following:
Slightly modified board (number of elements in the tables):
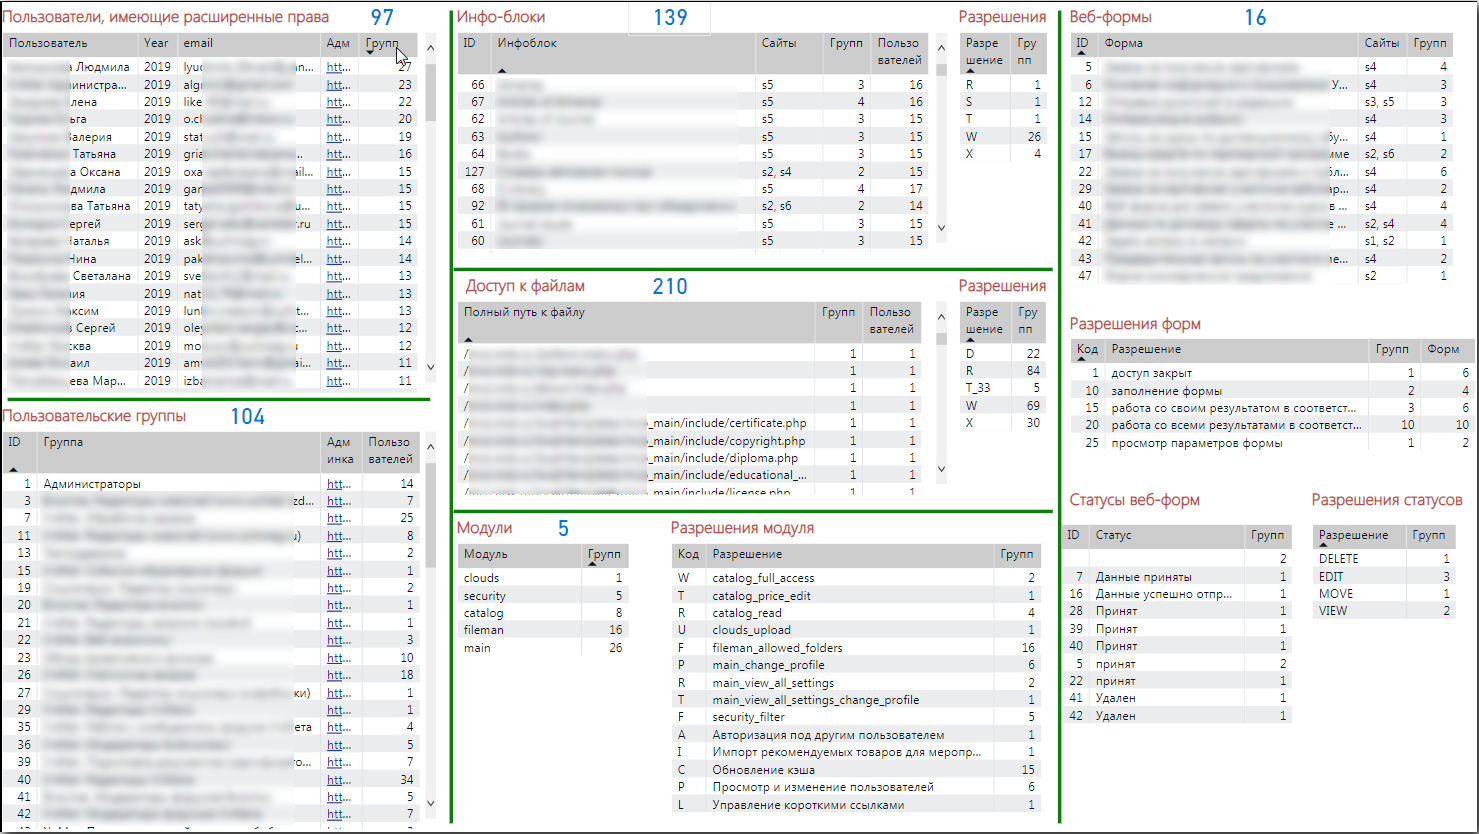
By the way, it is convenient to first set up the appearance of one table, and then simply apply its view to other tables using Home → Format Painter. This function works the same way as in Word and Excel (Format on a sample).
Links to admin panel
So that you can quickly go to the site and make settings in the admin panel, you can add a custom column in the DAX language and make it “Web URL” type. To do this, select the created column and assign the appropriate type (Modeling → Properties → Data Category → Web URL).
Example for group request:
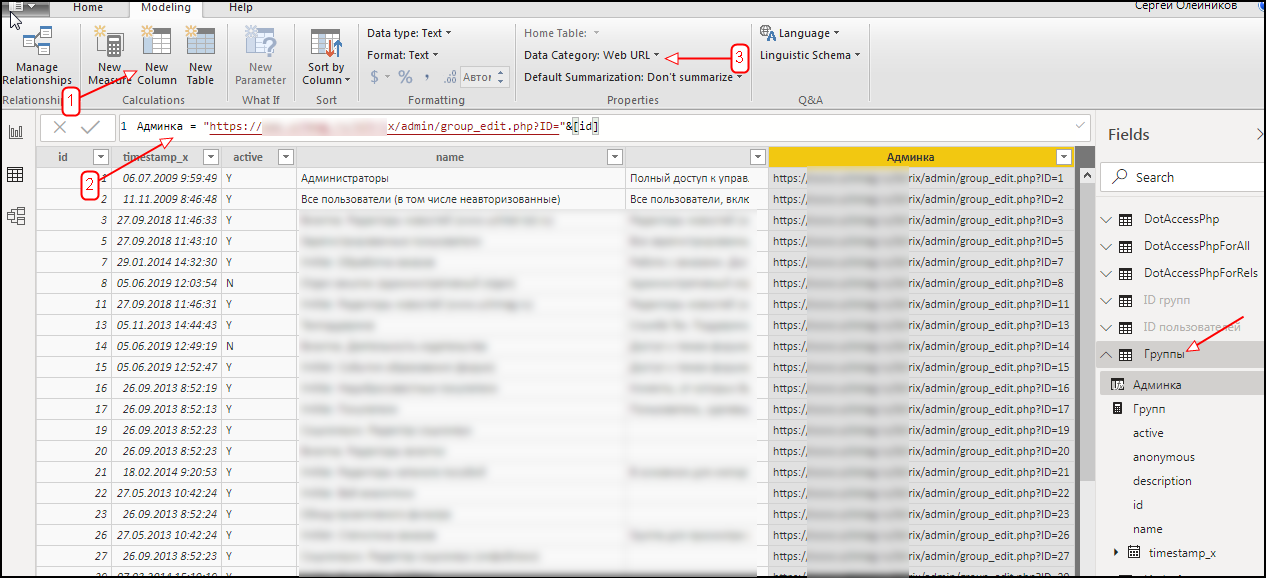
Add a column to the view:
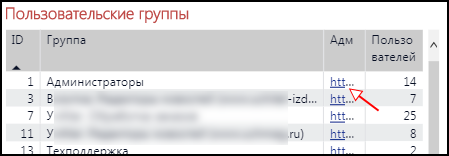
Now you can simply click on the table cell and go to the group card in the Bitrix admin panel.
Report “Files”
For convenience, you can make a separate report by placing on it tables relating to access to files and sections of an Internet resource:
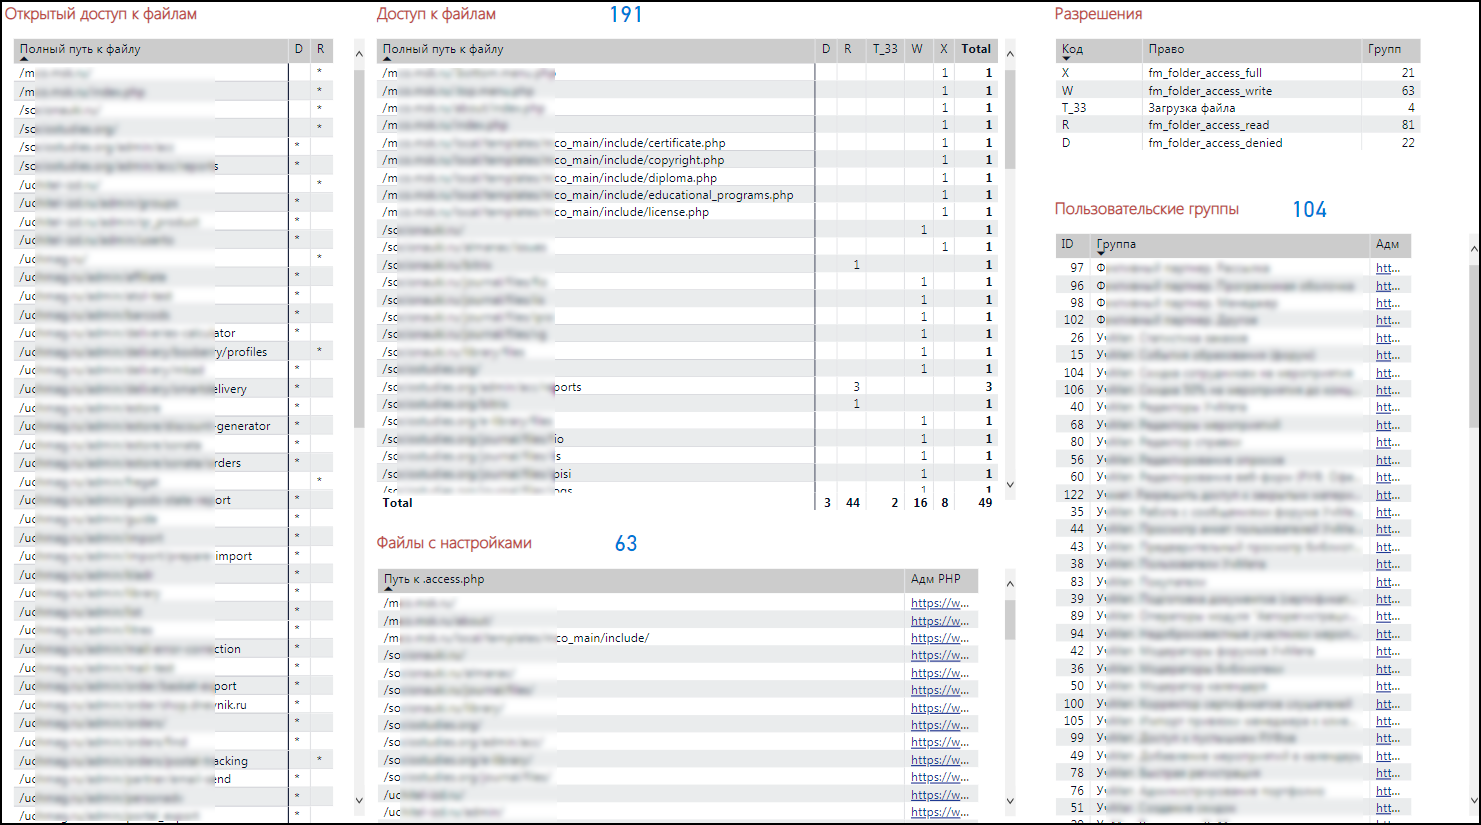
This report also added links to edit all .access.php directly through the Bitrix admin panel.
Results
Bitrix is a champion among cms monsters with obvious pros and cons, beautiful on the outside and terrible on the inside. It does not have convenient access administration tools. But this problem has been solved with the help of free tools, without involving valuable programmers in this process.
The advantages of this approach also include the ability to quickly supplement the model in Power BI with additional information from Bitrix, for example, someone wants to know when .access.php and others were created or modified.
Now, after building the model of access rights and its visualization in Power BI, it is enough:
- sequentially click on users, groups, forms, files, and in real time to see all connections related to access;
- go quickly to the necessary admin pages to make edits;
- Update your data model with actual data from Bitrix directly into Power BI.
As a result, an audit was conducted and an adjustment was made in user access.
PS In the marketplace there is a free module “Access Control Center”, but it is very limited, and the last commentary is more than 5 years old. Maybe someone will like the idea of building such a dashboard right in Bitrix and it implements it as a module ...
PS2. If anyone is interested in the topic of using Power BI to solve problems of finding hidden dependencies in different accounting systems, please write in the comments. I will then write a few more articles on this topic.
PS3. Thanks to my colleagues for help in preparing this article: Alexander Voronkov, Yevgeny Shapochkin, Alexei Titov.
Source: https://habr.com/ru/post/457626/
All Articles