Sweat, tears and time keeping - as we increased the company's profitability
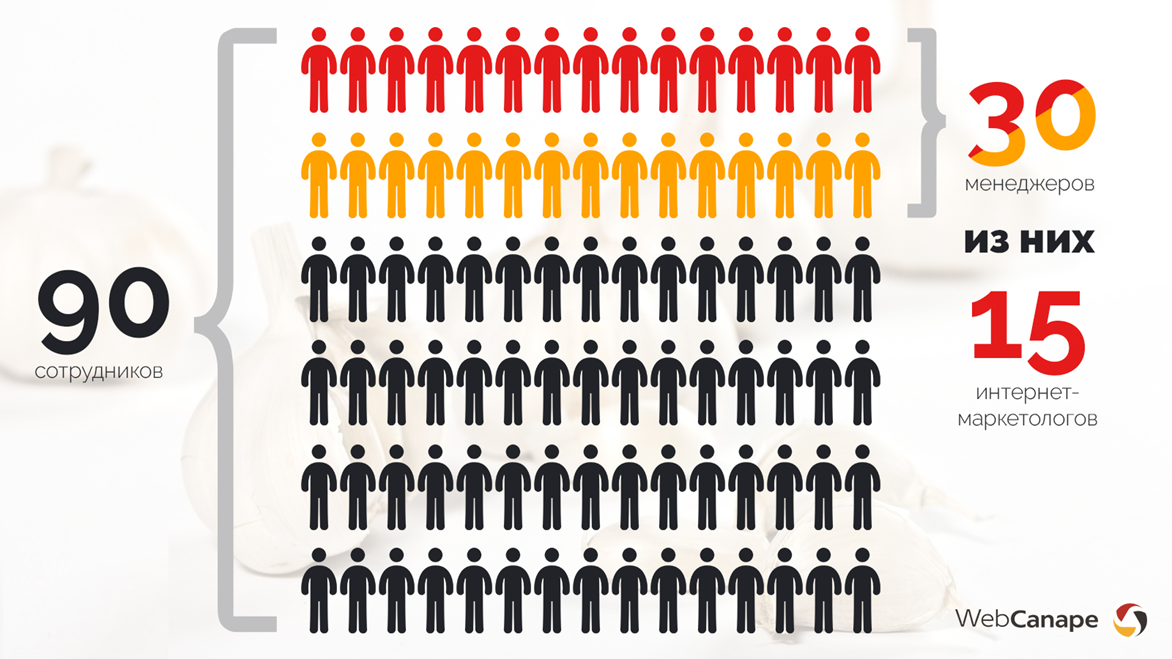
The company employs 90 people. Managing such a large number of employees and controlling them does not all work well. Due to poor management, the quality of the company's services may decline, the profitability of projects may decline, and the overall office climate will deteriorate. To avoid this, we have implemented employee performance monitoring.
This is a complex system that involves not only taking into account the time that employees spend on completing project tasks, but also controlling other important aspects of their work. In an environment where everyone is switching to flexible development methodologies (and we are also in the process of transition), it is important to monitor the quality and profitability of projects, and time keeping is the basis of all work.
')
This system has enabled us to:
- increase the speed of completing tasks and shorten the deadlines for project delivery
- build real production load forecasts for the month ahead;
- predict the need for new employees and plan recruitment
- implement a management reporting tool;
- to bring more than 90% of projects in the profitability zone
Now I will tell you how we came to this.
Performance Monitoring System Architecture
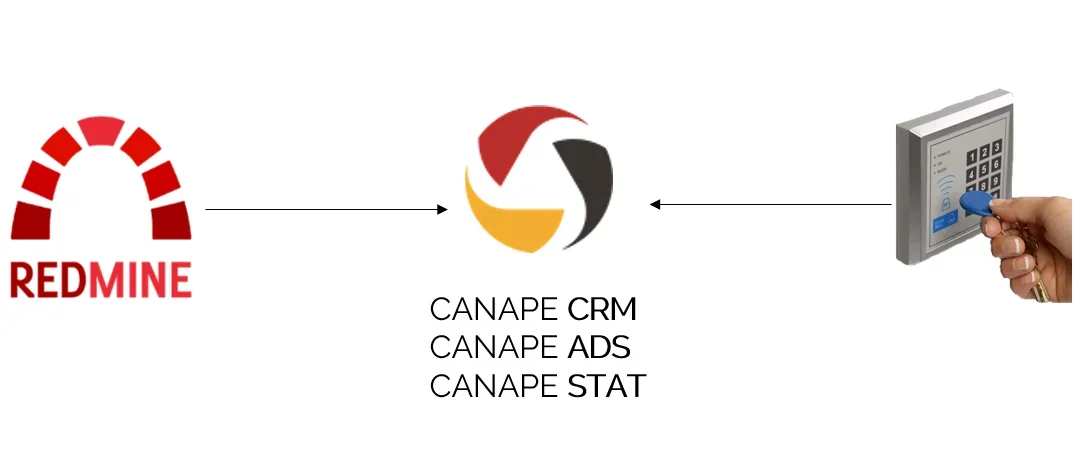
Work control is built on four pillars: labor accounting, time accounting at the workplace, production load monitoring and profitability monitoring. For each of these tasks, a separate tool is used - a total of four, and two of them are our own developments.
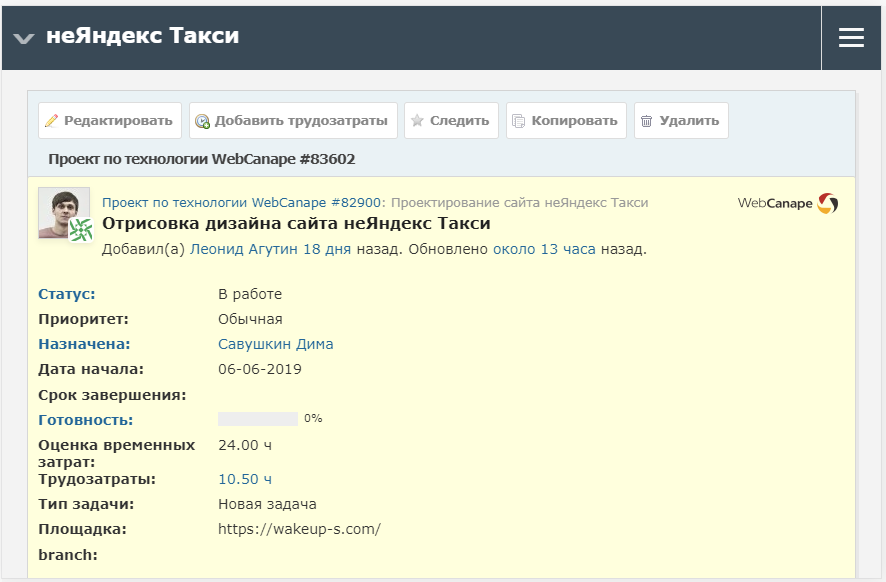
- Accounting labor. For this purpose we use Redmine. Here we set tasks for each other and beat off the time spent on each.
- Accounting for time spent in the workplace. Each employee has an individual electronic key with which he opens the door to get to the office. We have installed the Bolid access control system, which collects all data on entry and exit of employees. So we know how much time each person is in the office.
- Monitoring production at Canape STAT is a proprietary development. It collects all data on labor costs from Redmine and information on time in the workplace from ACS. So we have a complete picture of all employees, as well as the workload of departments (the number of hours / tasks on the department and on each employee).
- Control of profitability in Canape CRM (also developed by themselves). The system receives data on all labor costs from Redmine, and we can track when a project is in a risk zone, that is, the number of hours worked is about to exceed the estimated time.
Details on each instrument and their work further.
The structure of the state: whose time and how we consider
Of the 90+ studio staff members, about 30% are managers. The rest are production and administrative staff.
Now the production department is working on a cascade model, but we are gradually introducing Agile on large projects. Employed in the production of employees - developers, designers, web designers and others - there are three categories of labor costs:
- Doing the task.
- Communication on the task.
- Self-education.
Our employees can spend 20% of their time on learning new technologies, services and tools, taking courses and reading professional literature. The only requirement is that this self-development be within the framework of the company's development vector and current tasks.
The work of the administrative staff is accounted for by the time spent in the office.
The nature of the work of a manager is very different from the nature and composition of the tasks of other employees. Therefore, we do not consider the time it takes to perform work as managers and account managers. We refused to take into account their labor costs, because if the manager leads more than 10 projects (and in WebCanape it turns out something like this), then with manual time tracking, the time for switching between systems grows. We have not yet begun to automate this process, because it turned out to be difficult to count the time of telephone conversations, communication in the mail, and setting tasks automatically in our infrastructure. And now it is not a priority for us - the internal development department is loaded with releases of new versions of Canape CMS.
Experimentally, we found that it takes an average of 10% of the hours embedded in it to maintain the project, therefore we immediately include this figure in the assessment. If a manager performs a project task on his own (for example, he develops a strategy or uploads photos), that is, he spends time, which is taken into account when evaluating a project, he indicates the hours spent in the corresponding task.
How we have integrated accounting systems in the company's business processes
We did not arrive at the current system immediately. At first they solved the problems pointwise, and then combined all the solutions into a complex.
Problem | Decision | |
one | Delaying the projectIt seems everyone worked as usual, but more and more often the deadlines for the delivery of the project failed. It was necessary to understand which segment of the chain the problem was. Staff: up to 20 people | Developer time accountingTo understand where the holes are formed, we began to take into account the time spent by developers, analyze it and adjust the structure of tasks and work regulations. |
2 | Exceeding estimated project timeWhen they began to clearly control the time of the developers, the hours that were laid in the project during the sale became not enough, and the projects turned out to be unprofitable. Staff: 35 people | Calculation of profitability of projectsAnalysis of the profitability of projects allowed us to adjust the estimate of labor costs for projects and bring more than 90% to the profitability zone. |
3 | Lack of consolidated data on production loadThere were more and more projects, the deadlines had to be kept, production began to “choke”. Some departments were loaded for several weeks in advance, others passed most of the projects and turned out to be underutilized. There was a lack of summary data on the loads for each department so that it would be possible to correctly distribute the work among the projects. Staff: 40 people | Visualization of data on labor costs and loadsTo visualize all the data on the load of employees, we have developed our own service, which received data from Redmine. The display of all information is in the form of a heat map, where the color code indicates the underload / overload of a specific employee / department. |
four | Expansion -> difficult to controlWith an increase in profitability, we began to develop more quickly, invest more in marketing, which resulted in an increase in the flow of applications and, as a result, an expansion of the team so that these applications can be processed and developed. There was a need to automate the control of employees. Staff: 60 people | Integration with access control systemA large team is difficult to manage. To maintain labor discipline at the level, we began to take into account the time of people in the office. All our employees are officially employed in the company staff. Data on labor costs, the number of tasks and time at the workplace were combined into one system and got a clear picture of the departments. |
five | Increased order volume -> need for job optimizationWith the increase in the volume of orders, it became not enough just to consider the profitability and time of people at work. I wanted to optimize the processes so as to process a larger volume of orders without expanding staff. Staff: 90 people | Problem solving and work optimizationIt became interesting to us how to make orders more profitable and to shorten the deadlines. At this stage, we began to look for “thin spots” in production and think over ways to optimize in order to earn more in the future. |
Let us consider in more detail what kind of work we carried out at each of these stages.
Step 1. Consider the labor costs
We started small - introduced task tracker. We did not introduce any additional timers, everything was done in Redmine and our own CRM. This gave an understanding of how much time is spent on a specific task. All this was normalized - standards appeared for the types of tasks.
After that set the hourly wage for developers. Thanks to these measures, our labor discipline has improved and an understanding of how profitable projects are.
Step 2. Keep track of profitability and timing
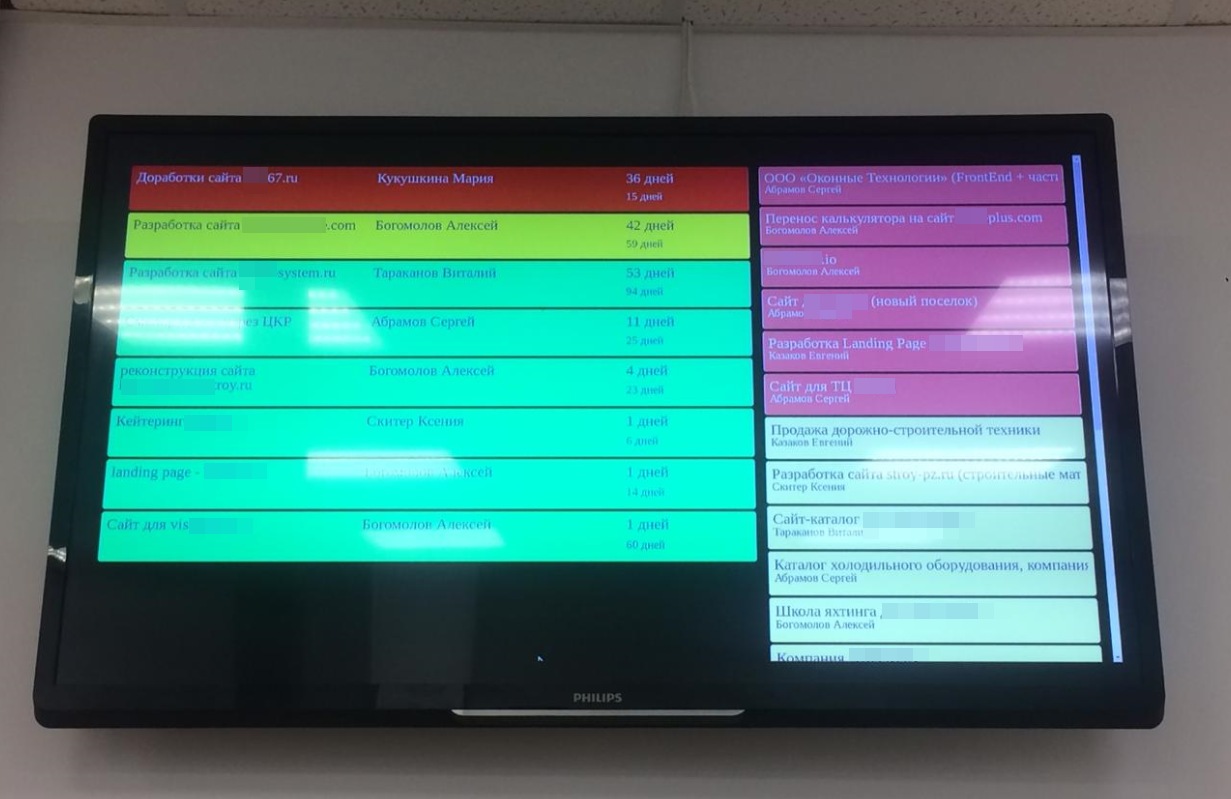
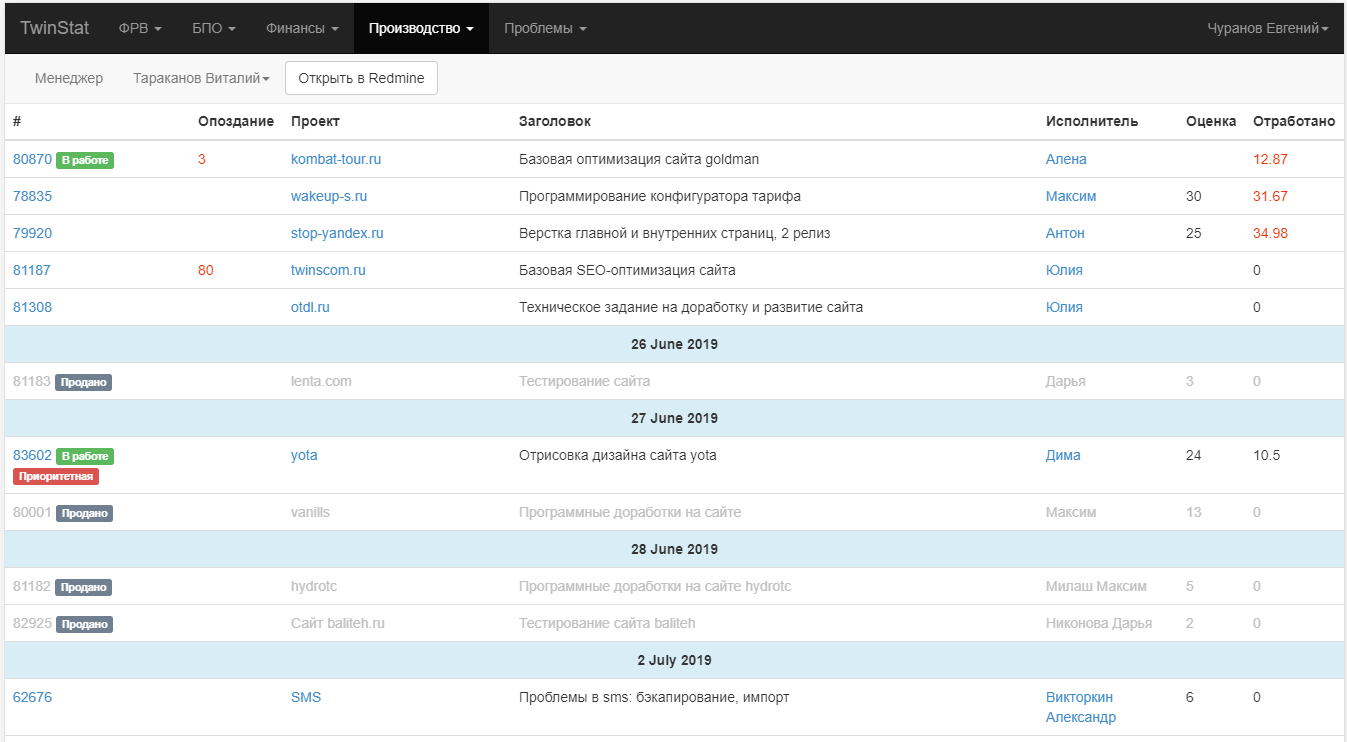
To account for profitability and control of the timing of projects, we have long developed our own project management system, Canape CRM, in which we conduct all the services of the company: from development to promotion of websites. These terms we visually presented in CRM.
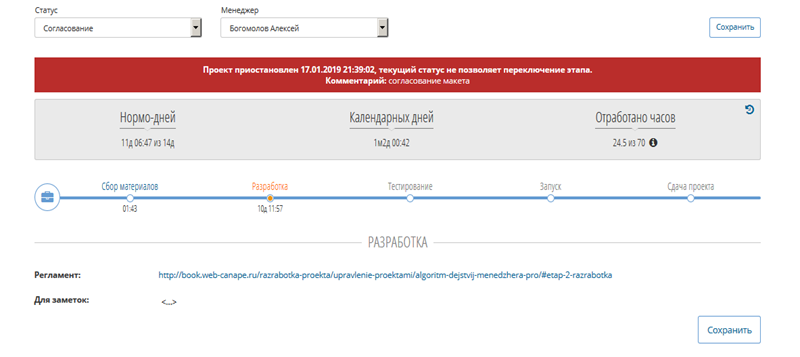
The manager clearly sees in what time his project should be submitted, how many days left, can suspend work during the approval period. It also allowed us to display all the data on the dates on a large monitor that hangs in the center of the office. Such visualization stimulates healthy competition between managers, spurs developers, managers also pay attention to these reports and may be interested in the course of the project.
In addition to the timeliness of delivery of projects, we also see their profitability in CRM. The report displays a summary of the pledged and spent hours for each contract.
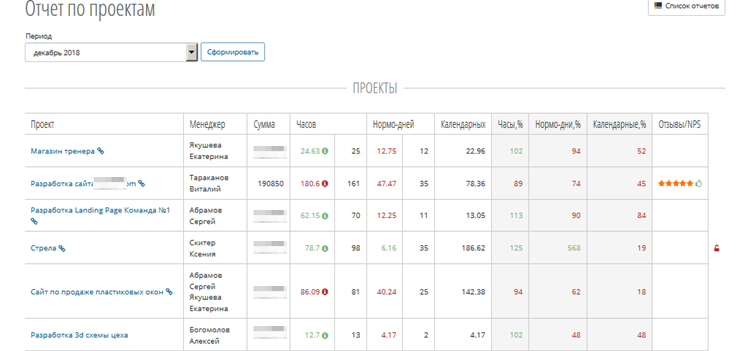
On the basis of these data it is easy to conclude about the effectiveness of each manager. You can see how many projects each passed, how many of them - on time, how much it earned for the company.
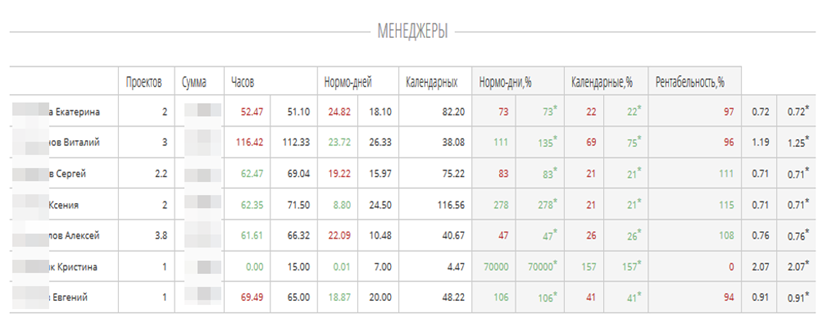
These are open statistics - employees can see who is doing better and who is worse. The CRM-system automatically ranks rating.
It is no secret that the main office confrontation is the confrontation between the manager and the developer. What if the developer is delaying the project? We came out of this situation, having sewed up the number of projects and the deadlines for their delivery to the manager and developer in KPI. So the manager does his best to control the developers so that they do not exceed their deadlines for the tasks and deliver them on time. The timeliness of the delivery of projects, we began to take into account when transferring developers to the next grade.
As a result, we began to track the load on managers and executors, their effectiveness and the profitability of their projects. On the basis of these data, we formulate plans for growth and development, apply the data obtained with financial incentives. All this translates into an increase in the level of customer service.
We see feedback from customers. If we don’t meet deadlines, we warn and explain the reasons. Now it is supervised by the production manager.
Step 3. Visualize the load
After the previous step, there were some problems, one of which was that we did not have data on the load of departments. We didn’t know and couldn’t predict when, for example, layout designers would rake up the queues and be able to pick up projects again. That is, all of these data we actually had, but in a fragmented form. Interpret them correctly did not work.
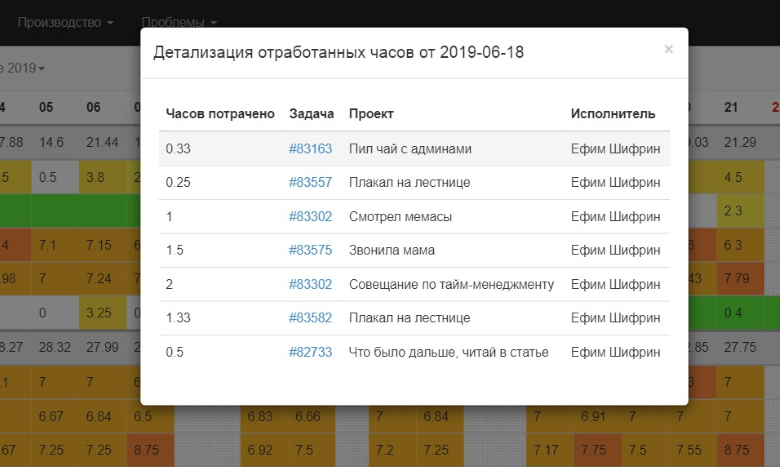
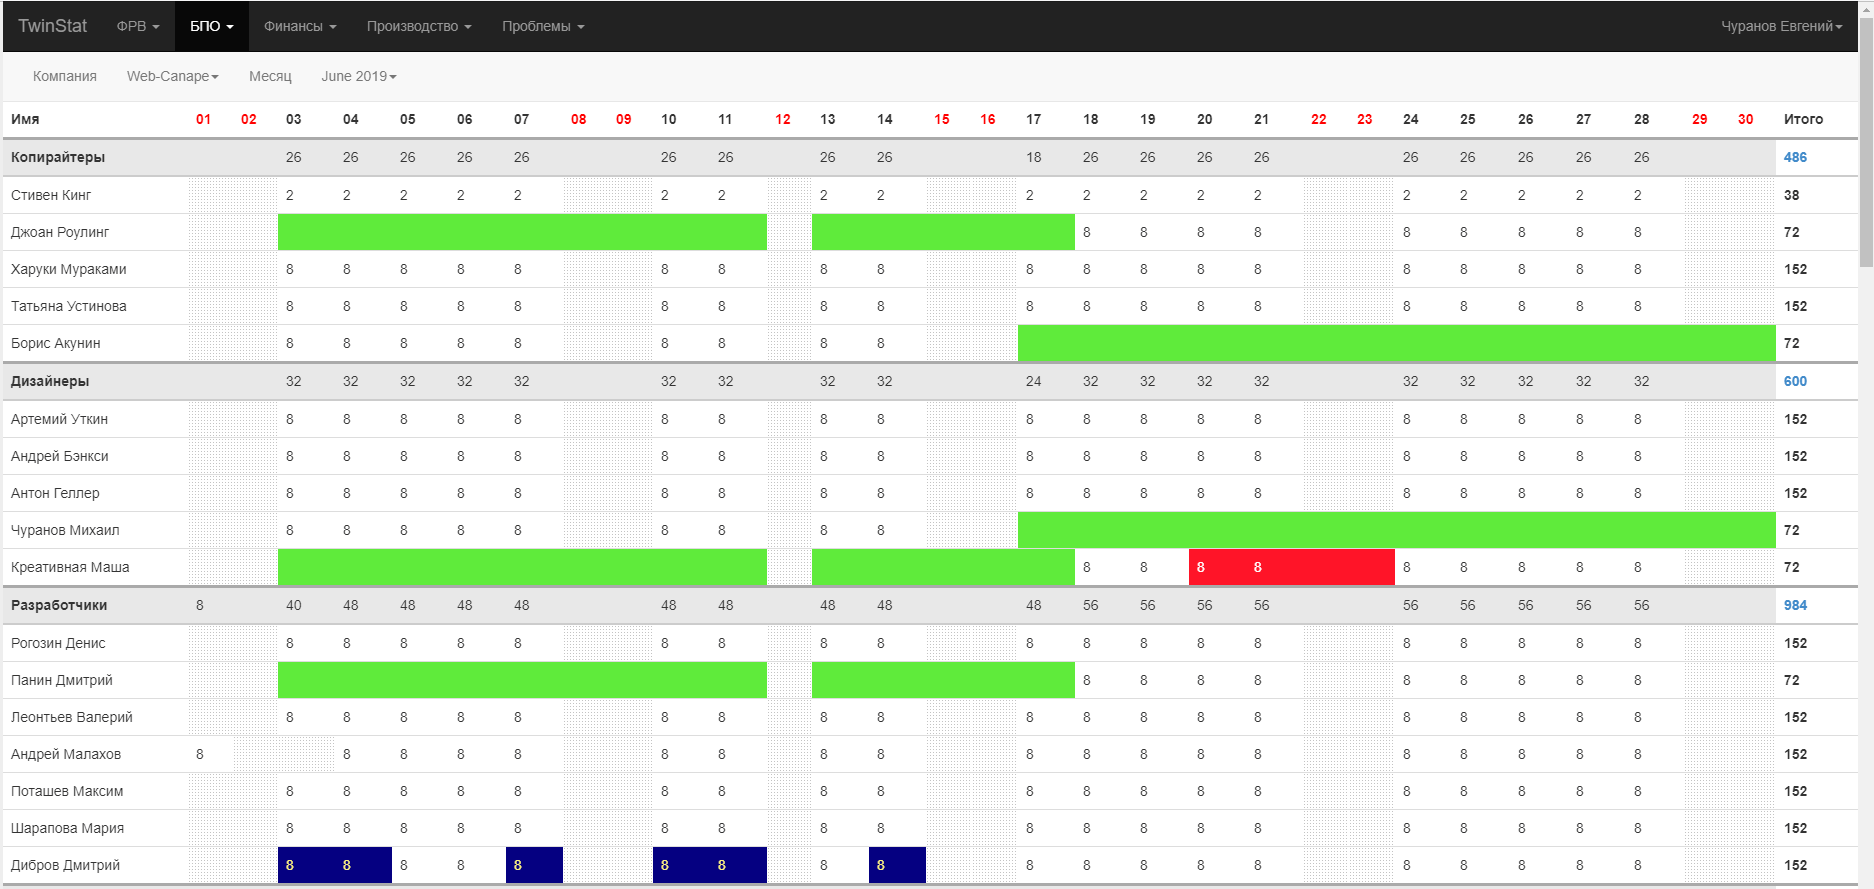
To solve the problem, we have developed another own internal service - Canape STAT. The Redmine system gives all the data on labor costs, tasks and projects to this service, where in the format of a heat map the labor costs and the load for each developer are displayed. These are real labor costs that the employee assigned to the tasks in Redmine.
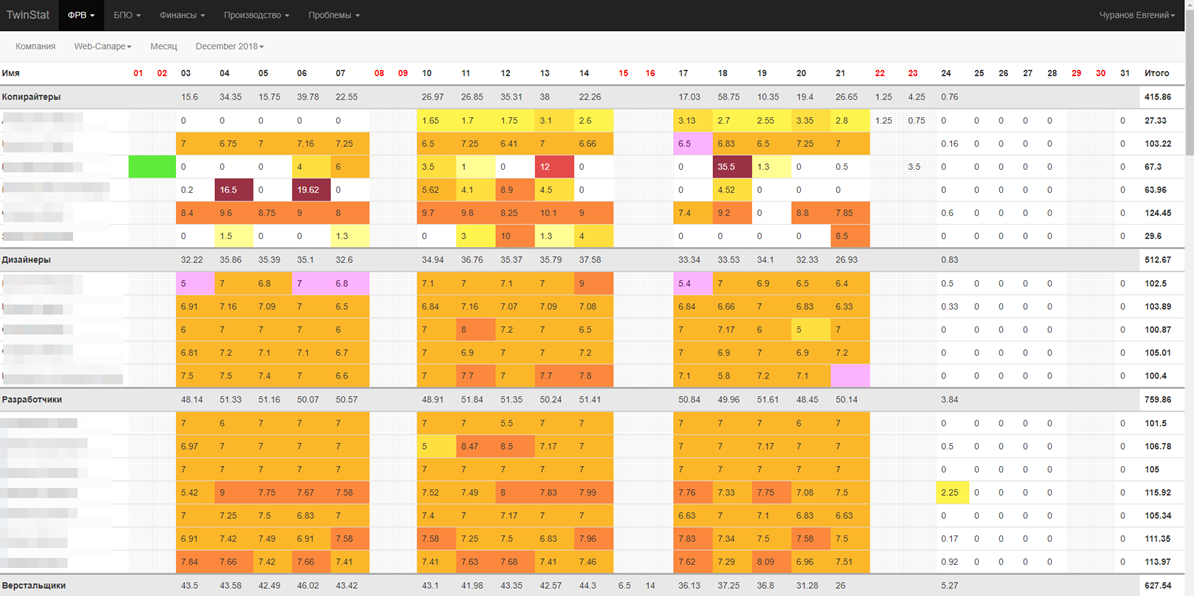
At the same time, we immediately see if somewhere there is an excess, a clear deviation from the required amount of hours, flaws and other problem areas. In our company, the specialist must beat tasks 7 hours a day. Thus, managers and specialists see how many hours each employee has worked, there are noticeable flaws and processing.
In the system, you can choose a specialist and see what tasks he worked on a particular day, how many hours he spent on them, what comments he left. So you can identify the cause of deviations from the norm.
Step 4 - integrate with ACS
After we brought this data into our system, it was still necessary to supplement it with some information that we lacked - data about the time spent in the office. So we combined the labor accounting system by the hour with the access control system.
Now we see how much time a person spent on tasks and how much he was in the office at the same time. This allows you to eliminate the manipulation of labor costs. If the employee was in the workplace for 6 hours and put 10 hours in the tasks, the manager or supervisor will have questions. The system also helps maintain labor discipline. We see who is constantly late, and who comes on time. When the office has more than 50 people and they are seated on two floors and a different office, it’s hard to keep track of such things.
In the same system, our HR specialists record data on holidays, time off, sick leave, fill in the production calendar.
Managers and colleagues see when someone goes on vacation or on sick leave. It simplifies communication in a team. All statistics are open to employees.
It also reflects the planned number of hours for each department and for each employee, as well as how many of them actually worked out this month. Thanks to this personnel department, it has become easier to compile reports. We were able to plan time for self-development, when we estimated the standard number of hours per month and compared it with labor costs by commercial tasks.
Step 5 - optimize processes
Everything looked quite good, and it became easier to control the processes, but one problem could not be solved - it was impossible to prioritize the tasks correctly. The standard principle “what is burning - we do first of all” did not work, because with this approach, all tasks sooner or later turned into burning due to the fact that they were constantly postponed for more urgent ones. Accordingly, it was necessary to somehow understand what to do faster, and who should make decisions.
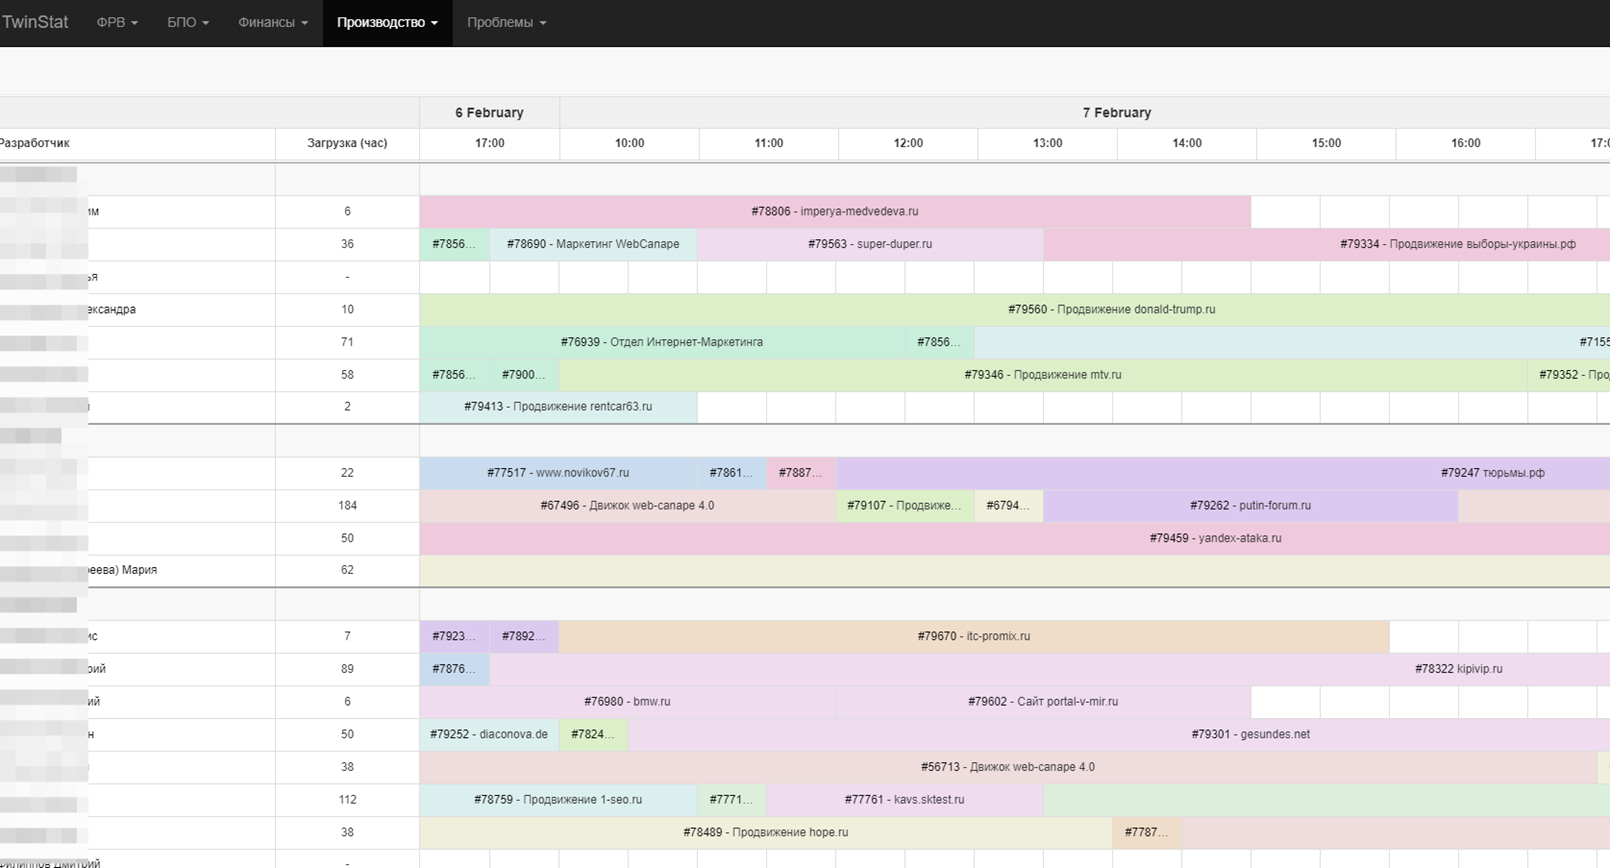
To solve this problem and give the employee an understanding of its loading, we again finalized Canape STAT. Now the specialists see their tasks distributed about a week and a half ahead and can systematically carry them out, taking into account the time remaining on the task and the executors within this task.
The manager and the developer do not need to clarify from each other who will do what, when and what task. Everything is in the system. Tasks with the “Assessment” status (you need to give an answer to a new client) and “To display” (when you need to put something on a live site) go by default first. There are tasks with the status “Not Sold”. This means that the project will definitely be launched, you need to take time, but you cannot start the task yet, because some data on it is still being specified. The tasks also include the label “Priority” - these are the most urgent tasks, and only the head of the department can put up such a label.
What we came to
This is a long journey that we have not yet completed. As in any company, we still have “bottlenecks” over which we work. The subtotals are:
- Increase the speed of performing tasks and delivering projects.
- Production load forecast for the month ahead.
- Forecasting human resource requirements.
- Management reporting tool.
- More than 90% of projects in the profitability zone.
- Another internal service: (
The last point doesn’t make us very happy, but when we started this process, neither Bitrix nor AmoCRM existed. We wrote our own tool for ourselves without relying on external services. If such problems were before us now, we would, of course, look for a solution on the side, and today this is our “narrow” place. To maintain and improve the system requires a lot of resources, the strength of the developers. However, there is a positive point - this is a serious challenge for new employees. They pump their skills on our domestic products.
The logic of the time tracking system
- Does not interfere with the work process.
The most difficult thing for employees in our system is to notice their work time on tasks and to apply a pass in the system of passes. It is difficult to imagine that someone could not cope with it.
- Covers all employees.
Director, department heads, team leaders, line employees, administrative staff - the rules are absolutely for everyone. All keep records of labor costs and report on time spent in the workplace. This allows us to accurately track the profitability of projects and the cost of internal tasks.
- Open to all.
Everyone can go to Canape STAT and see how much time he or his colleague worked on the project, when they come and go, compare themselves with the team.
- Responsible for department heads.
We trust employees, but we control them. The head checks labor discipline about once a month and, if there are systematic violations, conducts a conversation with an employee. He is responsible for overloading the department, flaws in subordinates and their poor performance, as he has all the tools to intervene before the problem has become critical.
- Built around profitability.
Achieving and increasing profitability is the main goal of implementing this system. All tools within the framework of this system are focused on getting the maximum economic effect from the company's activities.
- Implemented in stages.
Global changes can not be entered together. This can cause dissatisfaction of employees, confusion when accounting. We have integrated new accounting tools gradually, so that everyone has time to restructure and adapt to new conditions.
We constantly rethink our internal processes to make time management more complete and less tedious for employees. Tell us how it is organized with you? What metrics do you use to assess project profitability?
Now we are preparing another material about how and why we developed our own CRM. Subscribe to the channel in the Telegram , so as not to miss.
Source: https://habr.com/ru/post/457582/
All Articles