10 features to speed up data analysis in Python

Tips and tricks, especially in programming, can be very helpful. A small shortcut, addon or hack can save a lot of time and seriously increase productivity. I collected my favorite ones and made this article out of them. Some of the tips below are already known to many, and some have appeared quite recently. One way or another, I’m sure they will definitely not be superfluous when you once again embark on a data analysis project.
1. Profiling Pandas Dataframe
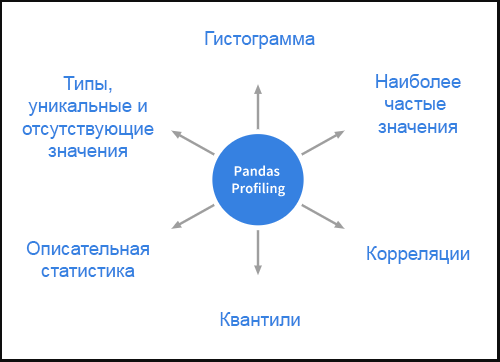
Profiling helps us better understand our data, and the Pandas Profiling package was created just for this. The library will provide an opportunity to quickly and easily perform an exploratory analysis of the Pandas Dataframe. Usually in such cases, the functions df.describe () and df.info () are used as the first step, but they report little and do not do well with large data sets. One line of code using Pandas Profiling , in contrast, will display a lot of information in an interactive HTML report.
Here is what is calculated for a given data set:
Installation
pip install pandas-profiling conda install -c anaconda pandas-profiling Using
Let's use the Titanic passenger data set to demonstrate the profiler capabilities.
# import pandas as pd import pandas_profiling df = pd.read_csv('titanic/train.csv') pandas_profiling.ProfileReport(df) This is all you need to display the results of profiling. The report is replete with details, including, where necessary, charts.

The report can be exported to an interactive HTML file :
profile = pandas_profiling.ProfileReport(df) profile.to_file(outputfile="Titanic data profiling.html") 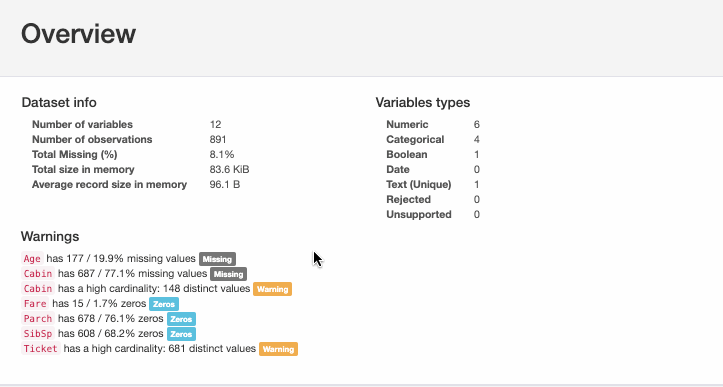
Click here to view live.
( folder with examples - approx. transl.)
2. Making Pandas graphics interactive
The DataFrame class in Pandas has a built-in .plot () function. However, the visualization created with its help is not interactive, which I would like to improve. On the other hand, I also do not want to abandon the ease of use of the function. What if we could make Pandas graphics interactive without making any changes to the code? This is what is possible with the library Cufflinks .
Cufflinks binds plotly to the power of Pandas for building interactive graphs. Let's see how to install the library and make it work with Pandas .
Installation
pip install plotly # Plotly Cufflinks pip install cufflinks Using
# Pandas import pandas as pd # plotly cufflinks import cufflinks as cf import plotly.offline cf.go_offline() cf.set_config_file(offline=False, world_readable=True) Time to see the full power of the tool on the passenger data on the Titanic.
df.iplot() 

The bottom visualization shows a static diagram, while the top diagram is interactive and more detailed, and all this without any significant syntax changes.
Here you can see more examples.
3. A bit of magic
Magic commands are a set of convenient functions in Jupyter laptops designed to solve common standard data analysis tasks. You can view all available functions with % lsmagic .
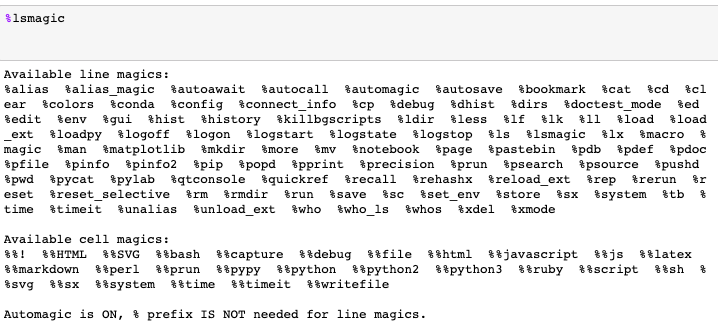
Magic commands come in two forms: line magics , which start with a single % character and work on the same line; and cell magics , which are associated with double %% and work on multiple lines.
Let's look at those that are useful in common data mining tasks:
- % pastebin
% pastebin loads the code into Pastebin and returns the URL. Pastebin is a website where we can save plain text, such as a source code snippet, to then pass the link to it to others. In fact, GitHub Gist is akin to Pastebin, albeit with version control.
Consider this script:
# file.py def foo(x): return x Using % pastebin in Jupyter Notebook will create a URL on Pastebin.

- % matplotlib notebook
The % matplotlib inline command is used to render matplotlib static graphs in Jupyter Notebook. Replace inline with notebook to get scalable and resizable charts. Just make sure the command is added before importing matplotlib .

- % run
The % run command runs the script inside Jupyter Notebook.
%run file.py - %% writefile
%% writefile writes the contents of the cell to a file. The code below will be written to a file named foo.py and saved in the current directory.

- %% latex
The %% latex function displays the contents of the cell as LaTeX. This is useful for writing mathematical formulas and equations in a cell.

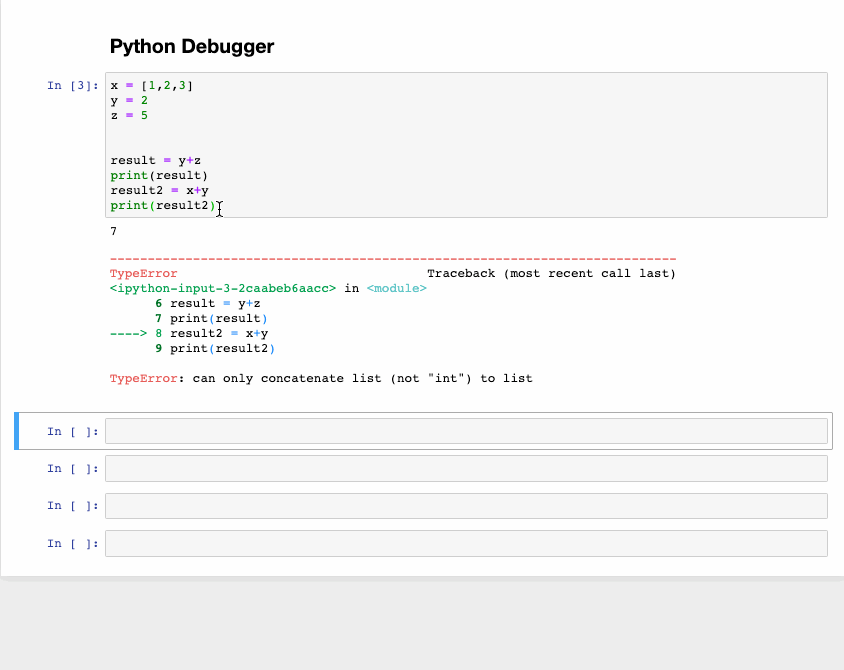
4. Troubleshooting
The interactive debugger is also a magic command, but I gave it my own category. If an exception is raised when you start a cell with a code, enter the % debug command on a new line and execute it. An interactive debugging environment opens, showing the location where the exception occurred. You can check the values of variables and perform various operations. To exit the debugger, press q .
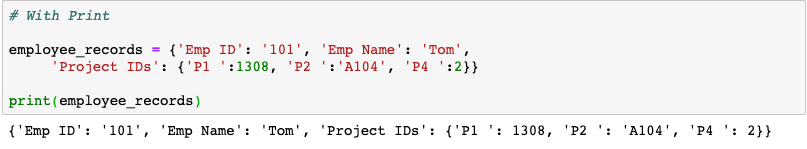
5. The conclusion can be beautiful
If you want your data structures to be rendered beautifully, then pprint is your choice. This is especially useful when printing dictionaries or JSON data. Let's look at code that uses both print and pprint for output.

6. Highlighting notes
We can use alerts in our Jupyter Notebooks to highlight something important. The color will depend on the type of alert. Simply add any or all of the following codes to the cell you want to select.
- Blue alert: information
<div class="alert alert-block alert-info"> <b>Tip:</b> Use blue boxes (alert-info) for tips and notes. If it's a note, you don't have to include the word “Note”. </div> 
- Yellow Alert: Warning
<div class="alert alert-block alert-warning"> <b>Example:</b> Yellow Boxes are generally used to include additional examples or mathematical formulas. </div> 
- Green Alert: Success
<div class="alert alert-block alert-success"> Use green box only when necessary like to display links to related content. </div> 
- Red Alert: Danger
<div class="alert alert-block alert-danger"> It is good to avoid red boxes but can be used to alert users to not delete some important part of code etc. </div> 
7. Printing each output in a cell.
Consider a Jupyter Notebook cell containing such code:
In [1]: 10+5 11+6 Out [1]: 17 This is a normal property of the cell that only the last output is printed, and for others we need to add the function print () . Well, it turns out that we can print out all the conclusions by adding the following fragment from above:
from IPython.core.interactiveshell import InteractiveShell InteractiveShell.ast_node_interactivity = "all" Now all the conclusions are printed one by one.
In [1]: 10+5 11+6 12+7 Out [1]: 15 Out [1]: 17 Out [1]: 19 To return to the original setting:
InteractiveShell.ast_node_interactivity = "last_expr" 8. Run Python scripts with the '-i' option.
A typical way to run a Python script from the command line is: python hello.py . However, if you add the parameter - i, i.e. call python -i hello.py then you will get much more. Let's see what exactly.
- First, as soon as the end of the program is reached, Python no longer leaves the interpreter. Thus, we can check the values of variables and the correctness of the functions defined in our program.

- Secondly, since we are still in the interpreter, we can easily invoke the python debugger:
import pdb pdb.pm() This will lead us to the place where the exception occurred, and we can continue to work on the code.
Original source feature.
9. Automatic (rask) commenting code
Ctrl / Cmd + / automatically comments on selected lines in the cell. Pressing the combination again will uncomment the same lines.
(This, incidentally, is true for other editors such as Pycharm or Sublime Text - approx. Transl.)
10. Cancel random actions
Have you ever accidentally deleted a Jupyter Notebook cell? If so, then here are the shots that will undo this action.
- In case you deleted the contents inside the cell, you can easily restore it by pressing CTRL / CMD + Z
- If you need to restore the deleted cell itself - ESC + Z or EDIT> Undo Delete Cells

Conclusion
In this article, I listed the main tips that help me when working with Python and Jupyter Notebooks. I hope they will help you. Happy coding!
')
Source: https://habr.com/ru/post/457302/
All Articles