Grafana panels for Kubernetes administration
Hello! Today, we continue to share material that has been translated specifically for the students of the course “Infrastructure platform based on Kubernetes” . Enjoy your reading.


For some time I have been experimenting with the creation of Grafana dashboards for administering Kubernetes. As the owner and administrator of several Kubernetes clusters, I wanted to get a visual representation of some of the indicators. First, I need the normal Grafana dashboards for the Kubernetes Control Plane and Node components: kube-api, kube-scheduler, kube-controller-manager, as well as kubelet and kube-proxy . Secondly, I would like to lay out the resulting panels on GitHub so that the rest can post suggestions and error reports (issues), send requests for change (pull requests), update panels (git pull) and help me with working on them.
')
Now Grafana panels are mainly published on the grafana.com/dashboards page. To get the right panel, you need to find it on the page, copy the identifier and import it into the local instance of Grafana. Although importing dashboards is relatively simple, experience shows that most users are not comfortable working with them. There are several reasons for this.
First, people use different tag selectors to specify the monitoring goals in Prometheus. Secondly, in new versions of Prometheus exporters and applications for accessing metrics, the names of metrics are constantly changing and deleting. Thirdly, it is extremely difficult to find really high-quality information panels - you never know what you will end up with after import. Selecting the panel, you have to comb through all the graphs and edit the metrics along with the selector tags - and this is a large amount of manual work.
I found a very cool project called Monitoring Mixins. In fact, this is a peculiar ecosystem designed to overcome all the sore problems of the panels. The idea occurred to Frederic Branczyk, and it was he who wrote the original design document , which I strongly recommend to read. Moreover, he thought out a real mechanism for updating dashboards and retrieving them from various GitHub repositories. This mechanism is very similar to
If you have read this far, you can take a break and enjoy the beautiful pictures.

API Server Dashboard
Kubernetes Controller Manager Dashboard

Kubernetes Scheduler Dashboard

Kubernetes Cubelet Information Panel

Kubernetes Cubelet Information Panel

Kube Proxy Information Panel
First you need to install
If you are running macOS, you can use the
Create a new directory for the project and enter it with the
Install mixin :
Now create a new
After that, the dashboard is imported and task selectors are overwritten.
You will see the following list:
Display the contents of the catalog of information panels.
I have already said that I strongly recommend placing panels through configuration files. You can learn more about how this is done in the Grafana documentation .
On the other hand, nothing prevents you from opening the Grafana interface and adding panels through it.
Over time, the panels will change. To update them, the following command is enough:
That's all for today.
I hope you enjoy my dashboards. In a separate article I will talk about how I created them and why I made them like this, so be sure to subscribe to updates. Subscribers see my work first, even before publication.
I am also very interested in your feedback. If you used my panels, estimate how useful they were to you, or share if they helped you out in a real working situation. Just leave a comment!
By the way, if you want to thank me for your efforts, you can look at my open wish list and buy me, for example, a good book.
I really appreciate the quality open source projects. The kubernetes-grafana-mixin package is available under the
Introduction
For some time I have been experimenting with the creation of Grafana dashboards for administering Kubernetes. As the owner and administrator of several Kubernetes clusters, I wanted to get a visual representation of some of the indicators. First, I need the normal Grafana dashboards for the Kubernetes Control Plane and Node components: kube-api, kube-scheduler, kube-controller-manager, as well as kubelet and kube-proxy . Secondly, I would like to lay out the resulting panels on GitHub so that the rest can post suggestions and error reports (issues), send requests for change (pull requests), update panels (git pull) and help me with working on them.
')
Grafana dashboard publishing
Now Grafana panels are mainly published on the grafana.com/dashboards page. To get the right panel, you need to find it on the page, copy the identifier and import it into the local instance of Grafana. Although importing dashboards is relatively simple, experience shows that most users are not comfortable working with them. There are several reasons for this.
First, people use different tag selectors to specify the monitoring goals in Prometheus. Secondly, in new versions of Prometheus exporters and applications for accessing metrics, the names of metrics are constantly changing and deleting. Thirdly, it is extremely difficult to find really high-quality information panels - you never know what you will end up with after import. Selecting the panel, you have to comb through all the graphs and edit the metrics along with the selector tags - and this is a large amount of manual work.
Monitoring Mixins Project
I found a very cool project called Monitoring Mixins. In fact, this is a peculiar ecosystem designed to overcome all the sore problems of the panels. The idea occurred to Frederic Branczyk, and it was he who wrote the original design document , which I strongly recommend to read. Moreover, he thought out a real mechanism for updating dashboards and retrieving them from various GitHub repositories. This mechanism is very similar to
go get , and I really liked it. Here you can read a brief description of the jsonnet-bundler package manager using this mechanism. Thank you so much to Frederick for useful developments!Kubernetes Grafana Mixin Package
If you have read this far, you can take a break and enjoy the beautiful pictures.
API server
API Server Dashboard
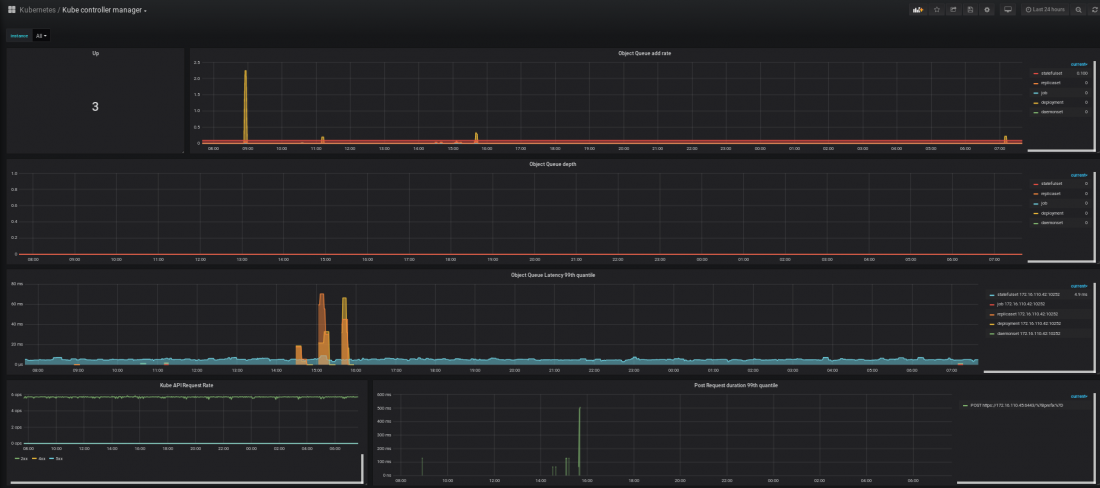
Controller manager
Kubernetes Controller Manager Dashboard
Scheduler
Kubernetes Scheduler Dashboard
A cublet (node agent)
Kubernetes Cubelet Information Panel
Kubernetes Cubelet Information Panel
Kube proxy
Kube Proxy Information Panel
Using the Kubernetes Grafana Mixin Package
First you need to install
jsonnet and jsonnet-bundler .Jsonnet
If you are running macOS, you can use the
brew install jsonnet . Otherwise, it is better to compile this component yourself. git clone https://github.com/google/jsonnet.git jsonnet_git cd jsonnet_git make sudo mv jsonnet /usr/local/bin/ Jsonnet bundler
go get -u github.com/jsonnet-bundler/jsonnet-bundler/cmd/jb Import panels
Create a new directory for the project and enter it with the
cd .Install mixin :
jb init jb install https://github.com/povilasv/kubernetes-grafana-mixin Now create a new
config.libsonnet file. local kubedashboards = import 'kubernetes-grafana-mixin/mixin.libsonnet'; kubedashboards { _config+:: { kubeletSelector: 'job="kubernetes-nodes2"', kubeSchedulerSelector: 'job="kube-scheduler2"', kubeControllerManagerSelector: 'job="kube-controller-manager2"', kubeApiserverSelector: 'job="kube-apiserver2"', kubeProxySelector: 'job="kube-proxy2"', }, } After that, the dashboard is imported and task selectors are overwritten.
Fix the Prometheus tag selectors to suit your environment.Now create the
dashboards directory. Finally, run jsonnet to compile config.libsonnet : jsonnet -J vendor -m dashboards -e '(import "config.libsonnet").grafanaDashboards' You will see the following list:
dashboards/kube-apiserver.json dashboards/kube-controller-manager.json dashboards/kube-proxy.json dashboards/kube-scheduler.json dashboards/kubelet.json Result
Display the contents of the catalog of information panels.
ls -l dashboards -rw-r--r-- 1 povilasv povilasv 35746 Apr 26 08:29 kube-apiserver.json -rw-r--r-- 1 povilasv povilasv 34790 Apr 26 08:29 kube-controller-manager.json -rw-r--r-- 1 povilasv povilasv 62845 Apr 26 08:29 kubelet.json -rw-r--r-- 1 povilasv povilasv 27673 Apr 26 08:29 kube-proxy.json -rw-r--r-- 1 povilasv povilasv 25650 Apr 26 08:29 kube-scheduler.json Adding dashboards to Grafana
I have already said that I strongly recommend placing panels through configuration files. You can learn more about how this is done in the Grafana documentation .
On the other hand, nothing prevents you from opening the Grafana interface and adding panels through it.
Update dashboards
Over time, the panels will change. To update them, the following command is enough:
jb update That's all for today.
I hope you enjoy my dashboards. In a separate article I will talk about how I created them and why I made them like this, so be sure to subscribe to updates. Subscribers see my work first, even before publication.
I am also very interested in your feedback. If you used my panels, estimate how useful they were to you, or share if they helped you out in a real working situation. Just leave a comment!
By the way, if you want to thank me for your efforts, you can look at my open wish list and buy me, for example, a good book.
I really appreciate the quality open source projects. The kubernetes-grafana-mixin package is available under the
Apache 2 authorization license. If you like the project, rate it on Github!Source: https://habr.com/ru/post/456946/
All Articles