How to choose the best place to open a branch and visualize the results on maps
Choosing a place for a new branch is a responsible decision. Mistake can be expensive, especially in capital-intensive industries. Most often, such decisions are made by management experts: based on knowledge of the city, industry, previous experience.
In the article I will talk about how analytics can help in making such decisions. How to collect information about the population, real estate prices and make interactive visualizations. Does the number of clients depend on the distance to the branch, the year the house was built, the value of the property?

To assess the population at home, we used the data of housing and communal services reform . On this portal you can get information on each house: year of construction, living area, number of residential premises. The estimate of the population of each house was based on the number of apartments and the total living space: an average of about 3 people per apartment with slight differences for some houses and municipal districts.
')
Above is a heat map with population density in St. Petersburg. Our map for internal use also contains a separate layer with the density of customers. So it is more convenient to look for white spots - places with low coverage.
Due to the specifics of the business, we have addresses in almost all of our clients in the database. It was only necessary to find the geographical coordinates for each address: geocoding or geocoding. To get the coordinates, I used the geocoder package for python. During the geocoding process, the following problems arose:
As a result, we got the exact coordinates of the house for 93% of clients. Now you can build such a map:
Random data is plotted on the map for part of St. Petersburg.
Such a map turned out to be a convenient tool for testing hypotheses. For example, the business had a hypothesis that in some types of houses (the Soviet mass building: ships, 504 series, Khrushchev, etc.) will not have our customers. It turned out to be not so. Yes, the share of clients from the population in such houses is low. But they need to be taken into account as there are a lot of such houses in the city and as a result they provide up to 20% of the client flow.
You can regroup data on population and customers from the previous section by municipalities and put on the map. If you add the info window and customized coloring, it turns out very informative. On Habré already have a great article , where the steps show how to build such maps.

Determining property prices has proven to be a daunting task. At the first stage, it was possible to get all the ads for the sale of real estate from the beginning of 2018, which is about 700 thousand records.
For each house, the cost per square meter was calculated as the median of the ads. For 20% of houses without ads, we estimated the cost of square meters. m. using a model. The main factor is the price per square meter. m 15 nearest homes. In this case, more weight received at home with similar characteristics: year of construction, number of residents, type of project. The average error of the model on the test set was 9.5%, which is quite acceptable for our study. Especially when you consider that even in one house the cost of square meters. m. can vary greatly: floor, renovation, area, and other factors.
The graph for 4 offices shows the dependence of the share of clients in the house on the distance to the office. Some branches have strong jumps, which suggests the influence of other factors (age of the house, price of real estate).

Interesting is the relationship between the year of construction of the house and the proportion of customers.

For further modeling, the age of the house was divided into 5 meaningful categories:
Price correlates with the share of customers. But dependence is weaker than between the share of clients and the age of the house. Perhaps the reason is that the age of the house correlates with the age of the tenants. And a person's age greatly affects the frequency of seeking medical services.
In the future, this analysis has developed into a full-fledged model, where coordinates are fed at the entrance, and the output is the number of visits from new customers. The article turned out to be voluminous, so I will tell you briefly about the model.
For ease of interpretation of the results, linear regression was chosen as a model. The target variable is the share of clients in the house, factors: the logarithm of the distance to the nearest branch, the cost of housing, the year the house was built. All three factors were significant and entered into the model.
Substituting in such a model new coordinates (that is, changing the factor distance to the nearest branch), at the output we get a new number of clients for the entire network. If we subtract from this number the number of clients that existed before, we get the net effect.
This formulation of the problem is convenient because the new locations are selected based on the location of the current branches. That is, there is no need to additionally take into account the “cannibalization” factor between different departments.
The search for optimal points for the whole city was carried out by a simple search of coordinates every 500 m. To calculate the effect of opening several branches, the points were set sequentially.
We managed to replace the wall map, on which we manually painted the borders of the districts and counted something on convenient interactive maps. Rid employees of manual correction and comparison of thousands of addresses with municipal districts. Enrich data and go from the level of the municipality to each house.
It turned out to identify some very promising and unobvious locations for placement. Build a model that automatically and impartially compares different points.
Interesting results were obtained when business areas were divided into “geo-dependent” and “non-independent”. The first must be part of the new branches, the second can be developed in the framework of the current locations. (not presented in the article) .
In the article I will talk about how analytics can help in making such decisions. How to collect information about the population, real estate prices and make interactive visualizations. Does the number of clients depend on the distance to the branch, the year the house was built, the value of the property?
The population of the city with the accuracy of the house
Code to create a map
# import pandas as pd from folium.plugins import HeatMap import folium # df = pd.read_csv('people_spb.csv') filial = pd.read_csv('filial.csv') competitor = pd.read_csv('competitors.csv') # hmap = folium.Map(location=[59.95, 30.15], zoom_start=11) # people = folium.FeatureGroup(name = ' ') hm = HeatMap( list(zip(df.lat.values, df.lng.values, df['People'])), min_opacity = .1, max_val = df['People'].max(), radius = 15, blur = 25, max_zoom = 1 ) people.add_child(hm) # filial_markers = folium.FeatureGroup(name = ' ') for index, row in filial.iterrows(): folium.Marker( location = [row['lat'], row['lng']], popup = row['Name'], icon = folium.Icon(color='blue', icon='cloud') ).add_to(filial_markers) # competitor_markers = folium.FeatureGroup(name = ' ') for index, row in competitor.iterrows(): folium.Marker( location = [row['lat'], row['lng']], popup = row['Name'], icon = folium.Icon(color='red') ).add_to(competitor_markers) # hmap.add_child(people) hmap.add_child(filial_markers) hmap.add_child(competitor_markers) # folium.LayerControl(collapsed=False).add_to(hmap) # html hmap.save('people_spb.html') To assess the population at home, we used the data of housing and communal services reform . On this portal you can get information on each house: year of construction, living area, number of residential premises. The estimate of the population of each house was based on the number of apartments and the total living space: an average of about 3 people per apartment with slight differences for some houses and municipal districts.
')
Above is a heat map with population density in St. Petersburg. Our map for internal use also contains a separate layer with the density of customers. So it is more convenient to look for white spots - places with low coverage.
Customer addresses
Due to the specifics of the business, we have addresses in almost all of our clients in the database. It was only necessary to find the geographical coordinates for each address: geocoding or geocoding. To get the coordinates, I used the geocoder package for python. During the geocoding process, the following problems arose:
- Some addresses are incorrect, for example, the case or the letter is confused. In this situation, geocoding can “lodge” a client in a kindergarten or administrative building. For such cases, I had to write a process that changed the coordinates to the nearest residential building within 200 meters.
- Points with an abnormally high number of customers: the city center, the middle of a big street, the middle of the district. Such coordinates were obtained with an incorrectly filled address and could distort the overall picture, therefore, they were deleted before modeling.
As a result, we got the exact coordinates of the house for 93% of clients. Now you can build such a map:
Random data is plotted on the map for part of St. Petersburg.
Code to create a map
import pandas as pd import folium from folium.plugins import MarkerCluster # df = pd.read_csv('data.csv') cmap = folium.Map(location=[59.95525, 30.2923], zoom_start=13) m = MarkerCluster() for i, row in df.iterrows(): mc.add_child(folium.Marker(location=[row.lat,row.lng])) cmap.add_child(mc) cmap.save(folder+"marker_map.html") Such a map turned out to be a convenient tool for testing hypotheses. For example, the business had a hypothesis that in some types of houses (the Soviet mass building: ships, 504 series, Khrushchev, etc.) will not have our customers. It turned out to be not so. Yes, the share of clients from the population in such houses is low. But they need to be taken into account as there are a lot of such houses in the city and as a result they provide up to 20% of the client flow.
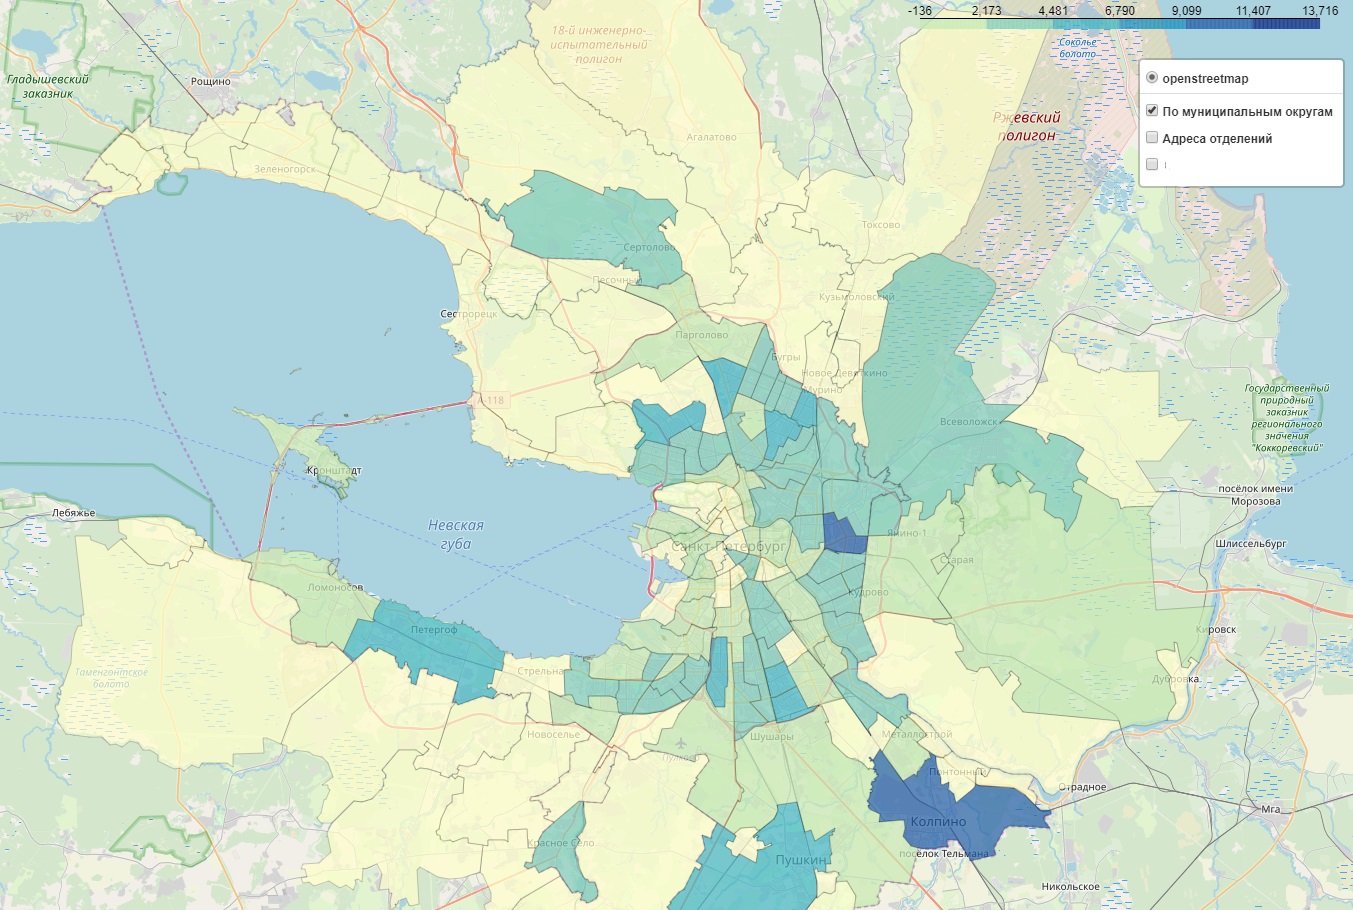
Borders of municipalities
You can regroup data on population and customers from the previous section by municipalities and put on the map. If you add the info window and customized coloring, it turns out very informative. On Habré already have a great article , where the steps show how to build such maps.
Property Value
Determining property prices has proven to be a daunting task. At the first stage, it was possible to get all the ads for the sale of real estate from the beginning of 2018, which is about 700 thousand records.
For each house, the cost per square meter was calculated as the median of the ads. For 20% of houses without ads, we estimated the cost of square meters. m. using a model. The main factor is the price per square meter. m 15 nearest homes. In this case, more weight received at home with similar characteristics: year of construction, number of residents, type of project. The average error of the model on the test set was 9.5%, which is quite acceptable for our study. Especially when you consider that even in one house the cost of square meters. m. can vary greatly: floor, renovation, area, and other factors.
Distance from home to branch
The graph for 4 offices shows the dependence of the share of clients in the house on the distance to the office. Some branches have strong jumps, which suggests the influence of other factors (age of the house, price of real estate).
House age
Interesting is the relationship between the year of construction of the house and the proportion of customers.
For further modeling, the age of the house was divided into 5 meaningful categories:
| Period | Description |
|---|---|
| 1700-1960 | Old Fund and Stalin |
| 1960-1990 | The period of mass Soviet building |
| 1990-2000 | Spot building in old quarters, a lot of brick houses |
| 2000-2010 | The period of economic recovery. Build a lot of housing in good locations |
| 2010-2018 | massive development in less well-located and remote areas |
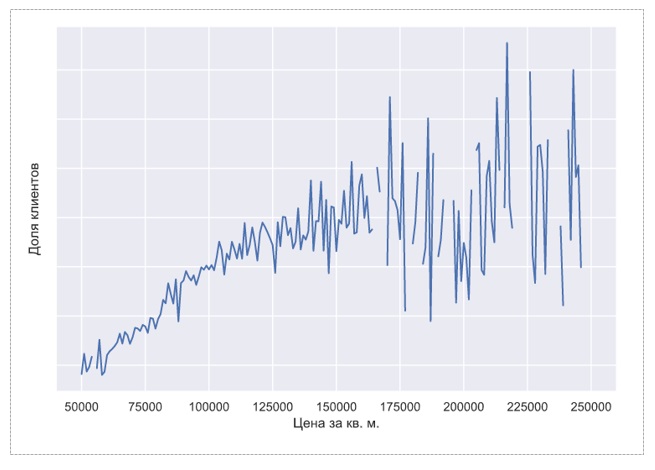
Price per square. m
Price correlates with the share of customers. But dependence is weaker than between the share of clients and the age of the house. Perhaps the reason is that the age of the house correlates with the age of the tenants. And a person's age greatly affects the frequency of seeking medical services.
Model Description
In the future, this analysis has developed into a full-fledged model, where coordinates are fed at the entrance, and the output is the number of visits from new customers. The article turned out to be voluminous, so I will tell you briefly about the model.
For ease of interpretation of the results, linear regression was chosen as a model. The target variable is the share of clients in the house, factors: the logarithm of the distance to the nearest branch, the cost of housing, the year the house was built. All three factors were significant and entered into the model.
Substituting in such a model new coordinates (that is, changing the factor distance to the nearest branch), at the output we get a new number of clients for the entire network. If we subtract from this number the number of clients that existed before, we get the net effect.
This formulation of the problem is convenient because the new locations are selected based on the location of the current branches. That is, there is no need to additionally take into account the “cannibalization” factor between different departments.
The search for optimal points for the whole city was carried out by a simple search of coordinates every 500 m. To calculate the effect of opening several branches, the points were set sequentially.
results
We managed to replace the wall map, on which we manually painted the borders of the districts and counted something on convenient interactive maps. Rid employees of manual correction and comparison of thousands of addresses with municipal districts. Enrich data and go from the level of the municipality to each house.
It turned out to identify some very promising and unobvious locations for placement. Build a model that automatically and impartially compares different points.
Interesting results were obtained when business areas were divided into “geo-dependent” and “non-independent”. The first must be part of the new branches, the second can be developed in the framework of the current locations. (not presented in the article) .
Source: https://habr.com/ru/post/456856/
All Articles