Eight named laws in UX design (part 2)
This article is a continuation of the previously published first part . If you have not had time to get acquainted with it, I recommend to start with it.
Miller's Law
“The magic number seven plus or minus two” (“Miller’s wallet”, “Miller’s law”) is a pattern discovered by the American psychologist George Miller, according to which short-term human memory, as a rule, cannot remember and repeat more than 7 ± 2 elements .In 1956, George Miller, an American psychologist, published an article entitled “The Magic Number Seven Plus or Minus Two: Some Limits in Our Information Processing Capabilities.”
After conducting a series of experiments in which people needed to distinguish between audible signals with different frequencies, the psychologist revealed that if the number of signals was 2 or 3, then the subjects did not have difficulty in determining them. Starting with the 4th signal, minor problems appear. And on the 5th and more sounds, the subjects make mistakes more often. In addition to experiments with sound, experiments with taste, with visual perception and others were also conducted.
')
Miller summarized the performance of all experiments and got the very number 7 ± 2. It is this number of elements that is able to store the short-term memory of an average person.
Despite the fact that Miller's law is one of the most popular and cited in the UX design environment, it has almost no relation to user experience and interfaces.This law is a myth, like many other convictions arising from it that the number of menu items or the number of items in the list should not exceed seven units.
To begin with, the user simply does not need to memorize information, it is already presented in full on his screen, so he can easily operate with a large number of elements. And there is no need to artificially limit this number to a family.
Human Factors International (HFI), one of the largest companies specializing in user experience design, conducted research, which revealed that voluminous but shallow menus can work better than those that have a large number of nestings.

Sections on the Amazon site
Even George Miller himself was shocked by how misunderstood his article was, stating that research was conducted for one-dimensional stimuli (sound, brightness, etc.), and had nothing to do with a person’s ability to understand printed text.
Nevertheless, the main conclusion of Miller's research for UX specialists should be the following: human short-term memory is limited, so if you want your users to work with a large amount of information and remember it, divide the information into chunks. Do not ask users to simultaneously store many pieces of information in their short-term memory at once. And do not dwell on the number seven.
Tesler's Law
Tesler's law, or the law of conservation of complexity, argues that for any system there is a certain level of complexity that cannot be reduced.Larry Tesler is a computer scientist, a specialist in the field of human-computer interaction. He has worked for companies such as Xerox PARC, Apple, Amazon, and Yahoo. In fact, it was he who introduced the key combination Ctrl + C, Ctrl + V.
He argued that each application has a certain degree of complexity. The only question is: who will deal with this? User, application developer or platform developer?
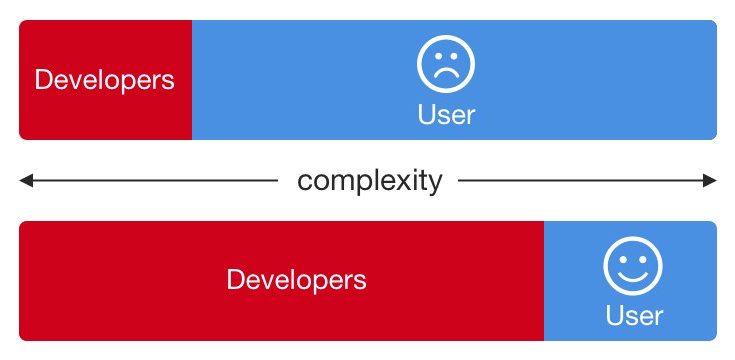
System complexity distribution
It takes quite a lot of work to do something “simple.” Reducing complexity for the user, we transfer complexity to designers, developers.
Let's analyze a simple example - the choice of the type of payment system.
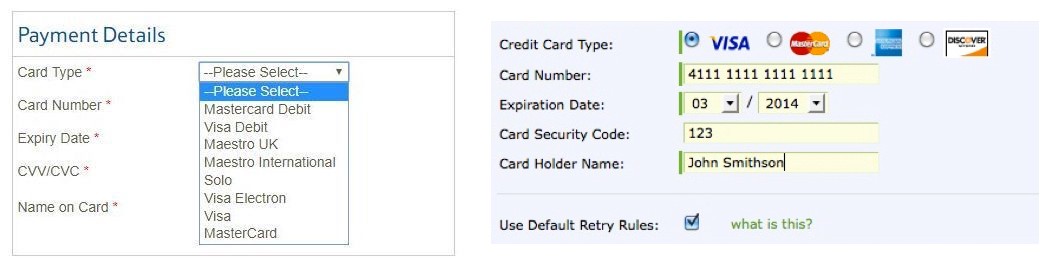
The type of payment system is chosen by the user.
The type of payment system is automatically substituted.
In the first case, the choice falls on the shoulders of the user, thereby complicating the system for him, but simplifying development. In the second, the type of payment system is automatically substituted when the user begins to enter a card number. This simplifies the work for the user, as the complexity of the task is reduced by one step. But the development becomes more difficult.
A common mistake of many product teams is to give as many controls to the user as possible, as if he knows better what to do with it. The designer draws another pack of checkboxes, telling the user in plain text: "Boy, now this is your problem."
Instead, the team should collect more information about users, analyze it and make this choice for the user.
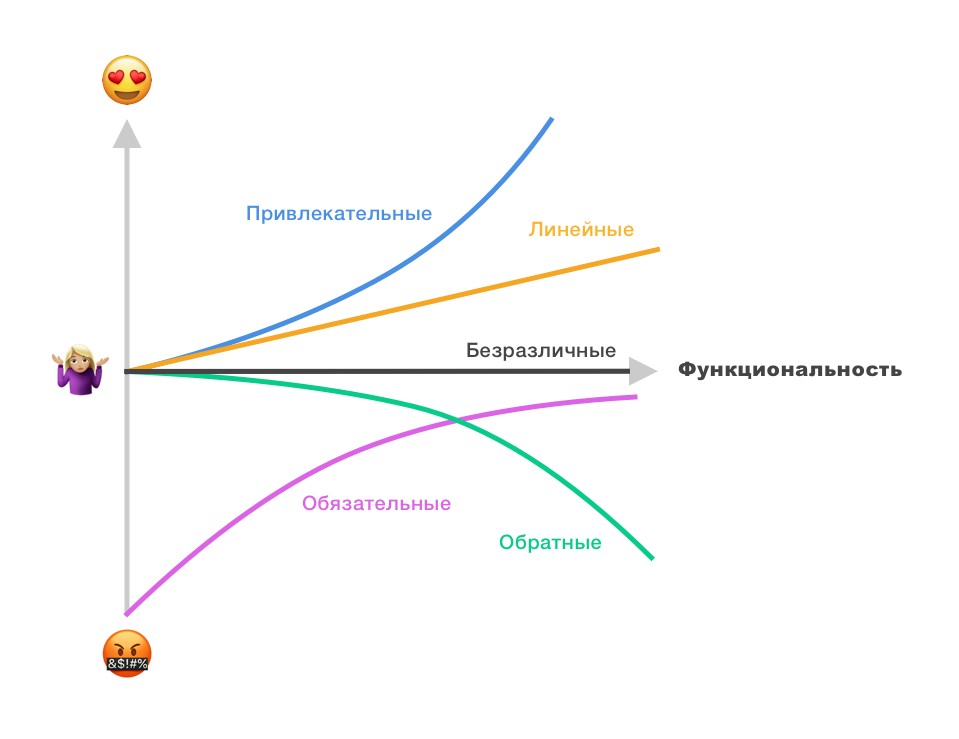
Kano's model
The “Kano Model” is a technique that is used to assess the consumer’s emotional response to individual product characteristics. It allows you to manage customer satisfaction and loyalty, simplifies and optimizes the process of consumption.The Kano model was developed in 1984 by Dr. Noriaki Kano.
The Kano model allows designers to better understand the desires of consumers and get rid of unnecessary features in the product. With it, companies develop strategies and solve problems to ensure user satisfaction and loyalty.
Kano's model
Kano divides all the properties of products into 5 categories:
- Required characteristics
- Linear characteristics
- Attractive features
- Indifferent characteristics
- Inverse characteristics
Let's look at each of them in more detail:
Required characteristics
As the name implies, the mandatory characteristics of the product include those without which the product will not work properly. For example, a car without a rudder, a smartphone without the ability to make calls, and so on.
Required attributes must be present, because without them the product will not have value for the consumer.
However, as follows from the graph below, the level of fulfillment of mandatory product characteristics does not directly affect customer satisfaction.
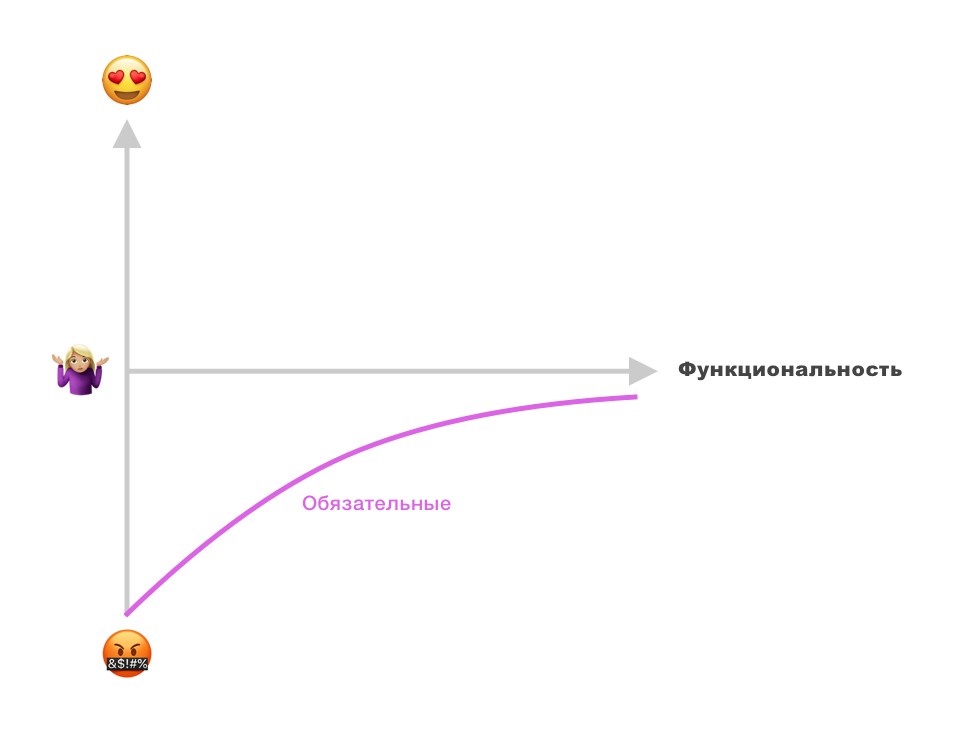
Required characteristics
The mere presence of such attributes in the product does not cause them great emotions, since they believe that these attributes should be present in the product by default. But if you omit any basic property, then no other properties of the product will save the consumer from disappointment.
Linear Characteristics
To linear or one-dimensional characteristics include characteristics from the category of "the more the better." For example, the amount of memory, fuel consumption, battery capacity and other. The better the values of these indicators, the higher the customer satisfaction.
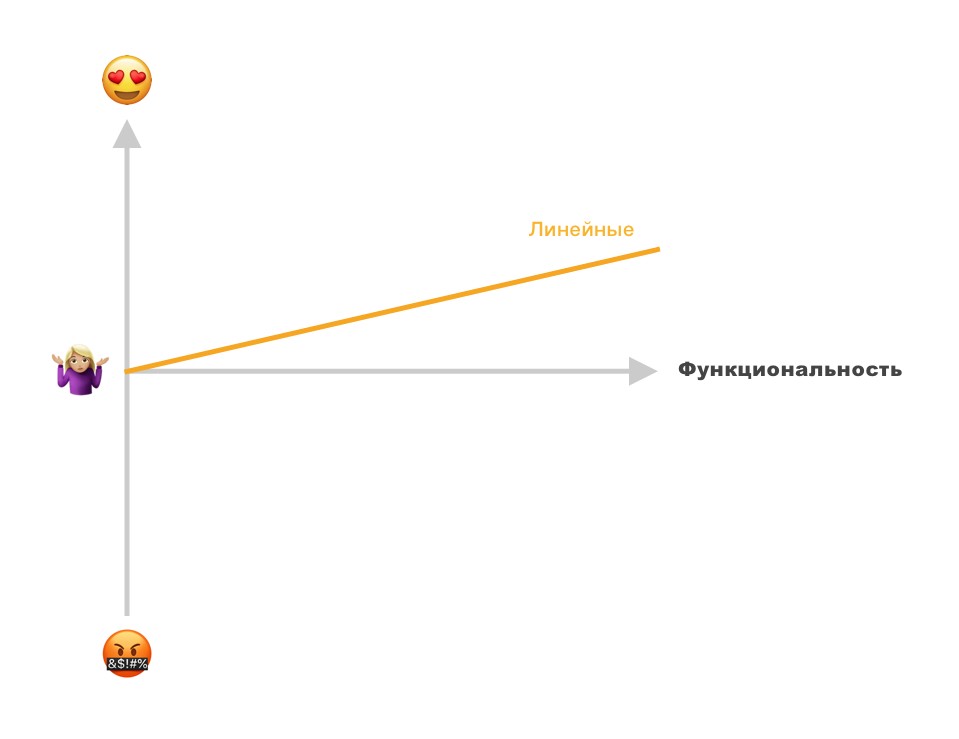
Linear characteristics
As the graph shows, the level of satisfaction with linear characteristics is directly related to the level of functionality of the specified attribute.
Attractive features
Attractive or admiring product features are the killer features of your product. These features at one time included the function of the iPhone Touch ID, and now the Face ID. Automatic MacBook unlock with Apple Watch, wireless charging of smartphones and many others.
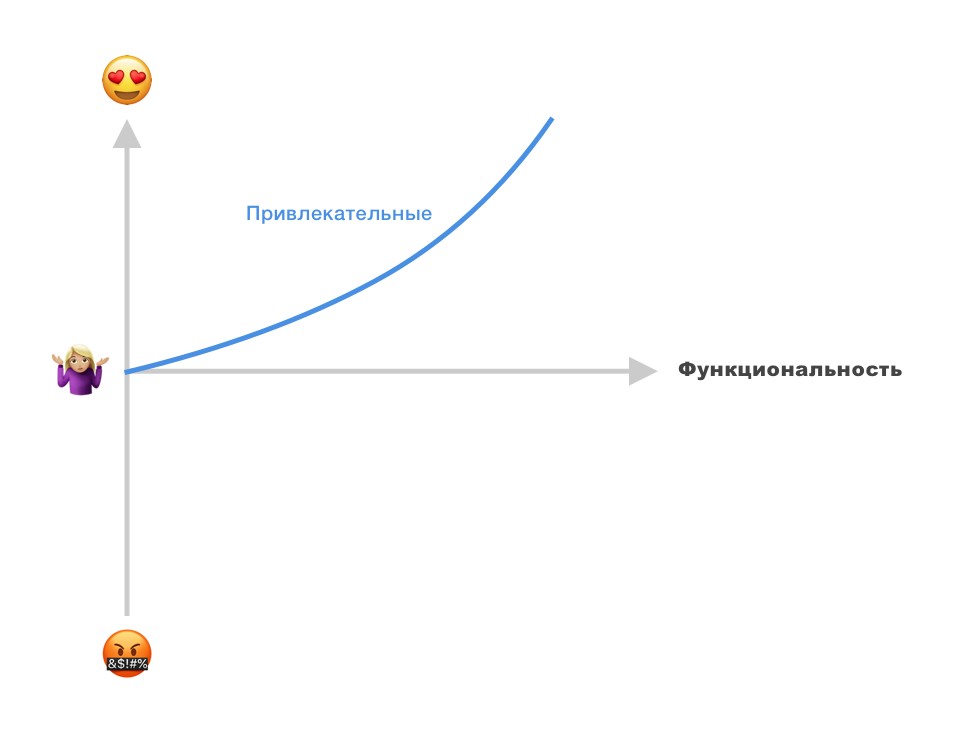
Attractive features
The level of performance of attractive properties does not directly affect customer satisfaction. If the admiring property is missing, consumers will not be disappointed, since they had no expectations regarding this property. But if the admiring property is found by consumers, then thanks to the effect of surprise, they will be so impressed that they simply cannot resist and not share their discovery with others.
Over time, many of the attractive characteristics become obligatory.
Indifferent characteristics
These are the functions and attributes of the product that the consumer has little or no interest at all; functionality that does not affect the level of customer satisfaction with the product.
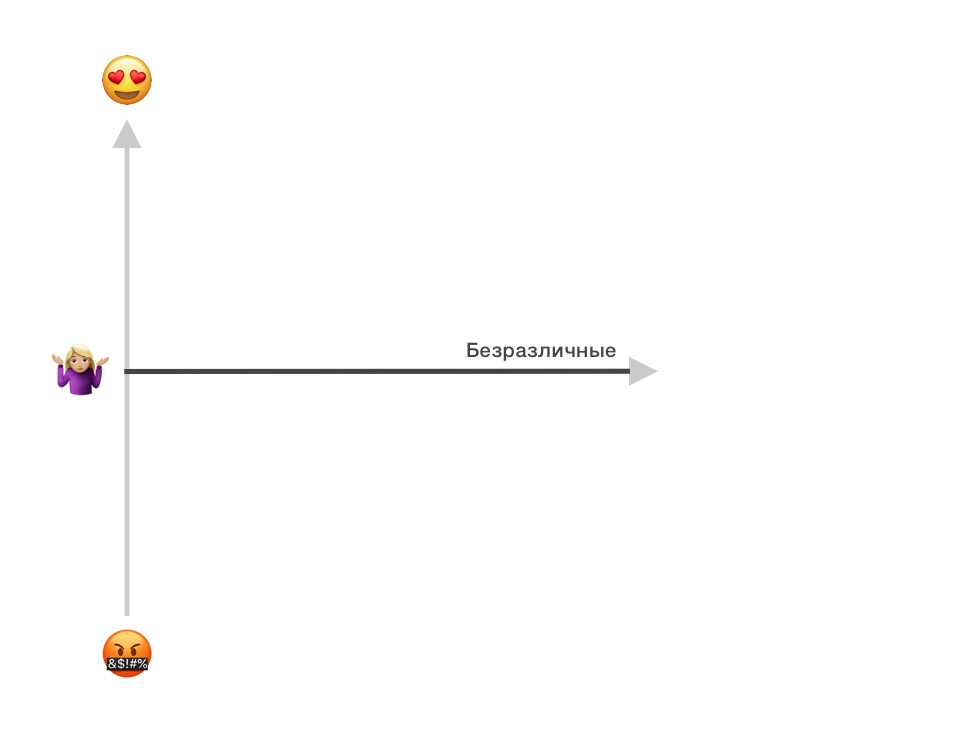
Indifferent characteristics
An example of such properties is the encryption of photos in Google Photos, the side of the location of the gas tank on the car and others.
Inverse characteristics
Inverse or undesirable characteristics are those properties of the product that, as their quantity grows, decrease the user satisfaction with the product.
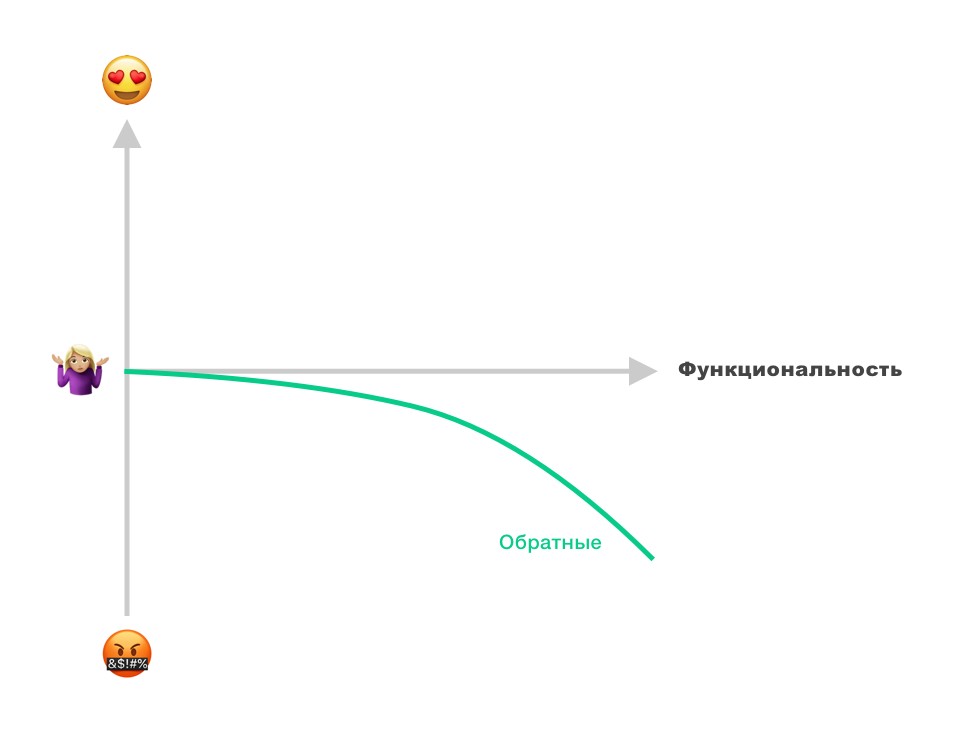
Inverse characteristics
As an example of such characteristics, you can bring a huge number of buttons on the steering wheel of a car that distract the driver, or car parking with a large number of places, but the places in which are so narrow that it is difficult to open the car door.
How to use the Kano Model?
In order to use the Kano Model, you will need to conduct a study of the target audience, to identify their vision of the characteristics of your product.
Make a list of features of your product for each type of person. After all, one segment of your customers will see the dominant value of the product in some characteristics, and others in others. Consider this fact in the survey.
Next, we proceed to the survey itself. It consists of only two questions, each of which is asked once for each attribute:
- How would you feel if the product had the following characteristic?
- How would you feel if the product did not have the following characteristic?
As a response, respondents must choose one of several response options:
- I would have liked
- I expect it
- I do not care
- I can live with it
- I would not use the product because of this.
Pay attention to the table below:
 Source: https://uxdesign.cc
It consists of several categories, marked with letters:
A - Attractive - Attractive
O - One dimensional - Linear
M - Must-be - Mandatory
I - Indifferent - Indifferent
R - Reverse - Reverse
Q - Questionable - Subject (Reflects unclear results that cannot be evaluated)
Thus, each pair of responses at the intersection of rows and columns indicates the type of category for this function.
For example, if the user answers “1. I would have liked "the functional (positive) question and" 2. I expect this "to a non-functional (negative) question, then the tested function falls into category" A ", i.e. attractive
Note also that where you got R - people are not interested in your product, this is not your target audience, and where you received Q, people most likely did not understand the question.
Thus, the Kano Model can help clarify customer requirements for a given product and helps in creating products that lead to high customer satisfaction.
Pareto's Law
The Pareto law (Pareto principle, 80/20 principle) is a rule of thumb in the most general form that is formulated as “20% of efforts give 80% of the result, and the remaining 80% of efforts only 20% of the result”
 Pareto principle
This principle was proposed by the management consultant Joseph Juran in 1951, who referred to a private pattern revealed by the Italian economist and sociologist Wilfredo Pareto in 1897.
Pareto's law is useful because it allows us to focus our efforts on the areas that are most useful. It is used in almost every business discipline.
It doesn't matter if you are developing a small website or a large and complex application, as soon as you delve into user analytics, you will see that most of the time users only work with a limited part of the functionality. Of course, this does not mean that the rest of the functionality or content has no value, but it means that some functionality and content are more important for your users than for others.
This is important because it allows you to focus your research on the most important things and ensure the safety of these things when you begin to review the user experience. If you do not take this into account, you will lose users. Conversely, if you can improve the user interaction of these key attributes of your product, you are more likely to win new users and encourage current loyalty.
But not everything is so simple, suppose that you received 300 calls to the support service, 200 of which relate to problem A , 80 relate to problem B , and only 20 refer to C. At this stage, it is not difficult to focus on solving problem A. But if all requests related to B or C come from users with a paid or premium subscription, and calls related to function A are not, then you can still focus your efforts on correcting B or C.
The Pareto Act offers a way to focus your energy and efforts on creating a user experience. It will help you get a clear idea of what is related to your users and business, so you can set priorities and solve the right design problems.
Everything written above is not an axiom, rather it is a set of simple principles and recommendations, using which you can significantly improve user experience and avoid typical problems of product usability.
Thank you for taking the time to read this article, I hope it was useful for you.
Source: https://habr.com/ru/post/456680/
All Articles