Logging in a distributed php application
The article will talk about the benefits of logging. I will tell about logs on PSR. I’ll add some personal recommendations for working with the level, message, and context of the logged event. An example will be given of how to organize logging and monitoring using ELK in an application written in Laravel and launched via Docker in several instances. Sign for an important rule of the alert system. I will give an example of a script that raises the whole monitoring stack with one team.
The benefits of logging
Well-organized logging allows at least the following:
- Know that something is not going as planned (there are errors)
- Know the details of the error, which will help to say with whom and where the error occurred, and to prevent a repeat
- Know that everything goes as planned (access.log, debug-, info-levels)
By itself, writing to the log will not tell you all this, but with the help of logs you will be able to find out the details of events on your own, or set up a log monitoring system that will be able to report problems. If the messages in the logs are accompanied by a sufficient amount of context, this greatly simplifies debugging, because you will have more data available about the situation in which the event occurred.
What to write and what to write
Part of the php community developed recommendations for some of the tasks of writing code. One such recommendation is the PSR-3 Logger Interface . She just describes what you need to log. For this, the Psr\Log\LoggerInterface of the "psr / log" package has been developed. When using it, you need to know about the three components of the event:
- Level - event importance
- Message - text describing the event
- Context - an array of additional information about the event
PSR-3 Event Levels
The levels are borrowed from RFC 5424 - The Syslog Protocol, a rough description of their following:
- debug - Detailed debugging information.
- info - Interesting events
- notice - Significant events, but not errors
- warning - Exceptional cases, but not errors
- error - Execution errors that do not require short-term intervention.
- critical - critical states (system component unavailable, unexpected exception)
- alert - Action requires immediate intervention.
- emergency - The system does not work
There is a description, but it is not always easy to follow them, due to the difficulty of determining the importance of certain events. For example, in the context of a single request, it was not possible to access the connected resource. When recording this event, we do not know whether one such request failed, and maybe only one user has such requests fail. It depends on it, it requires immediate intervention, or it is a rare case, it can wait, or even it can be ignored. Such issues are resolved in the framework of monitoring logs. But the level is still necessary to determine. Therefore, the levels of logging in the team can be negotiated. Example:
- emergency is a level for external systems that can look at your system and accurately determine that it does not fully work, or its self-diagnosis does not work.
- alert - the system itself can diagnose its state, for example, with a scheduled task, and as a result, record an event with this level. These can be checks of connected resources or something specific, for example, a balance in the account of an external resource used.
- critical - an event when a component of the system fails, which is very important and should always work. This is highly dependent on what the system does. Suitable for events that are important to quickly find out, even if it happened only once.
- error - an event has occurred, which should be reported when soon repeating. Could not perform an action that must be performed, but at the same time such an action does not fall under the description of critical. For example, it was not possible to save the user's avatar by his request, but the system is not a service of avatars, but a chat system.
- warning - events for immediate notification of which you need to dial a significant number of them over a period of time. Failed to perform an action, the failure of which does not break anything serious. These are still errors, but the correction of which may await the work schedule. For example, it was not possible to save the user's avatar, and the system was an online store. Notification is needed (at high frequency) to find out about sudden anomalies, because they can be symptoms of more serious problems.
- notice are events that report system deviations that are part of the normal operation of the system. For example, the user specified the wrong password at the entrance, the user did not fill in the middle name, but it is not necessary, the user bought the order for 0 rubles, but you have this provided in rare cases. Notification of them at high frequency is also necessary, since a sharp increase in the number of deviations may be the result of an error that must be urgently corrected.
- info - events, the occurrence of which reports the normal functioning of the system. For example, a user has registered, a user has purchased a product, a user has left a review. Notification of such events should be set up in the opposite way: if an insufficient number of such events occurred during a period of time, then they should be notified, because their decrease could be caused by an error.
- debug - events for debugging any process in the system. If you add enough data to the event context, you can diagnose the problem, or you can conclude that the process is functioning properly in the system. For example, a user opened a product page and received a list of recommendations. Significantly increases the number of events sent, so it is permissible to remove logging of such events after some time. As a result, the number of such events in the normal operation will be variable, then monitoring to notify them can be omitted.
Event message
For PSR-3, the message must be either a string or an object with the __toString() method. In addition, according to PSR-3, the message string may contain placeholders of the type ”User {username} created” , which can be replaced with values from the context array. When using Elasticsearch and Kibana for monitoring, I recommend not using placeholders, but writing fixed lines, because this will simplify event filtering, and the context will always be near. In addition, I propose to pay attention to the additional requirements for the message:
- The text should be short but meaningful. This is what will come in alerts, and that will be in the lists of events.
- Text is better to be unique for different parts of the program. This will make it possible to understand from an alert, without looking into the context, in which part the event occurred.
Event context
The event context for PSR-3 is an array (can be nested) of variable values, for example, entity IDs. The context can be left blank if the message says everything about the event. If an exception is logged, the entire exception should be passed, not just getMessage() . When using Monolog via NormalizerFormatter, useful data will be automatically extracted from the exclusion and added to the context of the event, including the glasstrack. That is, instead of
[ 'exception' => $exception->getMessage(), ] use
[ 'exception' => $exception, ] In Laravel, you can automatically enter data into the context for events. This can be done through the Global Log Context (only for uncaught exceptions or through report() ), or through the LogFormatter (for all events). Usually, information is added with the current user id, the request URI, IP, request UUID, and the like.
When using Elasticsearch as a log repository, remember that it uses fixed data types. That is, if you passed in the context of customer_id number, then when you try to save an event with a different type, for example, a string (uuid), then such a message will not be recorded. Types in the index are fixed when they first receive the value. If indexes are created every day, then the new type will be recorded only on the next day. But even this will not get rid of all the problems, because for Kibana the types will be mixed and some of the operations associated with the type will be unavailable until there are mixed indexes.
To prevent this problem, I recommend sticking to the rules:
- Do not use too general key names, which may be of different types.
- Make an explicit cast to a value type if there is no certainty about its type.
Example: instead of
[ 'response' => $response->all(), 'customer_id' => $id, 'value' => $someValue, ] use
[ 'smsc_response_data' => json_encode($response->all()), 'customer_id' => (string) $customer_id, 'smsc_request_some_value' => (string) $someValue, ] Call logger from code
To quickly record events in the log, you can think of several options. Consider some of them.
- Declare a global
log()function and call it from different parts of the program. This approach has many drawbacks. For example, in classes where we refer to this function, an implicit dependency is formed. This should be avoided. In addition, such a logger is difficult to configure when the system needs to have several different ones. Another disadvantage, if we are talking about working with Laravel, is that we do not use the opportunities provided by the framework to solve this problem. - Use Laravel facade \ Log. With this approach, the parts of the system that access this facade begin to depend on the framework. In parts of the system that we are not going to take out from under the framework, such a solution is quite suitable. For example, writing from some instances of the console command, background task, controller. Or when there is already an intricate structure of services, and it is not so easy to throw an instance of the logger into them.
- Resolve the logger dependency through the
app()andresolve()helpers. The approach has the same drawbacks as the use of the facade, but you need to write a little more code. - Specify a dependency on the logger in the class constructor that this logger will use. In this case, the same
LoggerInterfaceshould be specified as the type in order to comply with the DIP . Thanks to autowiring frameworks, dependencies are automatically resolved to implement according to their declared abstractions. In Laravel, in some classes, dependencies can be specified in a separate method, instead of being specified in the constructor of the entire class.
Where in the code to call the logger
When organizing code in a project, a question may arise in which class should I write to the log. Should it be a service? Or it needs to be done where the service is called from: controller, background task, console command? Or should each exception itself decide what to write to the log using its report (Laravel) method? There is no simple answer to all questions at once.
Consider the ability , given by Laravel, to delegate to the exception class the task of logging itself. An exception cannot know how critical it is for the system to determine the level of an event. In addition, an exception does not have access to the context, unless it is specifically added when this exception is raised. To call the render method on an exception, you must either not catch the exception (the global ErrorHandler will be used), or catch and use the global helper report() . This method allows not to call the PSR-3 logger every time we can catch this exception. But I do not think that for the sake of this it is worth giving the exception such responsibility.
It may seem that we can always log only in services. Indeed, in some services you can make logging. But consider a service that does not depend on the project and, in general, we plan to bring it into a separate package. Then this service is not aware of its importance in the project, and, therefore, will not be able to determine the level of logging. For example, an integration service with a specific SMS gateway. If we get a network error, it does not mean that it is serious enough. Perhaps the system has an integration service with another SMS gateway, through which there will be a second attempt to send, then the error from the first can be reported as warning, and the error of the second as error. Only all these integrations should be called from another service, which will be logged. It turns out that the error is in one service, and log in the other. But sometimes we do not have a wrapper service over another service — we call it directly from the controller. In this case, I consider it permissible to write to the log in the controller instead of writing a service decorator for logging.
Example showing dependency usage and context passing:
<?php namespace App\Console\Commands; use App\Services\ExampleService; use Illuminate\Console\Command; use Psr\Log\LoggerInterface; class Example extends Command { protected $signature = 'example'; public function handle(ExampleService $service, LoggerInterface $logger) { try { $service->example(); } catch (\Exception $exception) { $logger->critical('Example error', [ 'exception' => $exception, ]); } } } Where should i write
According to the 12 factorial application , you need to write to the stdout, stderr of the application runtime. It would be possible to specify php://stdout in the logger config, but due to the peculiarity of php-fpm 7.2 in the official docker image we get to docker logs
[21-Mar-2016 14:10:02] WARNING: [pool www] child 12 said into stdout: "2016-03-21 14:10:02 [xxxx] [-] [-] [info] Session started"
And the length of such a message is limited (cropped).
UPD: This problem is not in php-fpm 7.3, but this does not mean that all the options below have become useless.
Consider solutions to the problem.
- Ignore 12-factor, docker-way and write to files. Laravel (Monolog) can even customize the rotation of the logs. Further, messages from files can be collected using Filebeat and sent to Logstash for analysis.
- Write to the fifo file by redirecting its contents to the stderr docker container. Read more about this solution here .
- We can combine both solutions. Write to files that will be collected with Filebeat and sent to Logstash. Write to the stderr container in order to be able to use
docker logscommands and be ready for conveniently collecting logs from the container orchestration environment. - Send logs from the application directly further, for example, via UDP to increase performance.
Record format options:
- Human-readable (line breaks, indents, etc.)
- Machine readable (usually json)
- Both formats are simultaneously: machine-readable in stdout for further routing, human-readable in case of sudden problems with routing and fast debug
Any of the options assumes that the logs are routed — at least, sent to a single log processing (storage) system for the following reasons:
- Long-term storage and archiving
- Building large-scale trend plots
- Flexible event notification system
The docker has the ability to specify a log manager. The default is json-file , that is, the docker adds the output from the container to the json-file on the host. If we choose a log manager that will send records somewhere over the network, then we will no longer be able to use the docker logs . If the container's stdout / stderr was chosen as the only place to record application logs, then in case of network problems or problems at the single storage, it may not be possible to quickly retrieve the records for debug.
We can use json-file docker and filebeat. We will receive both local logs and further routing. It is worth noting here another feature of the docker. When recording an event longer than 16KB, the docker breaks the entry with the \n character, which confuses many log collectors. This is an issue . The problem with the side of the docker was not resolved, so it was decided by the collectors. From some versions, Filebeat supports this docker behavior and correctly merges events.
You can decide for yourself what your project will be the combination of all the possibilities of destinations and recording formats.
Using Filebeat + ELK + Elastalert
Briefly, the role of each service can be described as:
- Filebeat - collects events from files and sends
- Logstash - parses the event and sends
- Elasticsearch - stores structured events
- Kibana - displays events (graphs, aggregations, etc.)
- Elastalert - sends alerts based on requests
Additionally, you can: zabbix, metricbeat, grafana, and more.
Now more about each.
Filebeat
It can be run as a separate service on the host, it can be a separate docker container. To work with the stream of events from docker it uses the host path /var/lib/docker/containers/*/*.log . Filebeat has a wide range of options that can be used to set behavior in various situations (the file is renamed, the file is deleted, and so on). Filebeat can parse json itself inside an event, but not json can get into the events, which will lead to an error. All event processing is best done in one place.
filebeat.inputs: - type: docker containers: ids: - "*" processors: - add_docker_metadata: ~ Logstash
Able to receive events from many sources, but here we are considering Filebeat.
In each event, except for the event itself from stdout / stderr, there is metadata (host, container, etc.). There are many built-in processing filters: parsing according to regulars, parsing json, changing, adding, deleting fields, etc. Suitable for parsing both application logs and nginx access.log in an arbitrary format. It can transfer data to different storages, but here we consider Elasticsearch.
if [status] { date { match => ["timestamp_nginx_access", "dd/MMM/yyyy:HH:mm:ss Z"] target => "timestamp_nginx" remove_field => ["timestamp_nginx_access"] } mutate { convert => { "bytes_sent" => "integer" "body_bytes_sent" => "integer" "request_length" => "integer" "request_time" => "float" "upstream_response_time" => "float" "upstream_connect_time" => "float" "upstream_header_time" => "float" "status" => "integer" "upstream_status" => "integer" } remove_field => [ "message" ] rename => { "@timestamp" => "event_timestamp" "timestamp_nginx" => "@timestamp" } } } Elasticsearch
Elasticsearch is a very powerful tool for a wide range of tasks, but for the purpose of monitoring logs, you can use it knowing only a certain minimum.
Saved events are documents, documents are stored in indexes.
Each index is a scheme in which a type is defined for each field of a document. You cannot save an event in the index if at least one field has an unsuitable type.
Different types allow you to do different operations on a group of documents (for numbers - sum, min, max, avg, etc., for strings - fuzzy search, and so on).
For management logs, it is usually recommended to use daily indices - every day a new index.
Ensuring the stable operation of Elasticsearch with the growth of data is a task that requires deeper knowledge of this tool. But a quick solution to the stability problem is to automatically delete obsolete data. For this, I propose to break the event levels in different indexes in logstash. This will allow longer to store rare, but more important events.
output { if [fields][log_type] == "app_log" { if [level] in ["DEBUG", "INFO", "NOTICE"] { elasticsearch { hosts => "${ES_HOST}" index => "logstash-app-log-debug-%{+YYYY.MM.dd}" } } else { elasticsearch { hosts => "${ES_HOST}" index => "logstash-app-log-error-%{+YYYY.MM.dd}" } } } } To automatically delete outdated indexes, I suggest using a program from Elastic Curator . The launch of the program is added to the Cron schedule, the configuration itself can be stored in a separate file.
action: delete_indices description: logstash-app-log-error options: ignore_empty_list: True filters: - filtertype: pattern kind: prefix value: logstash-app-log-error- - filtertype: age source: name direction: older timestring: '%Y.%m.%d' unit: months unit_count: 6 For durable event storage, I suggest using alternative storage systems that can be connected as reception services from Filebeat or Logstash, or completely separately. In recent versions, Elasticsearch introduced partitioning into hot-warm-cold indices , perhaps you should consider them.
Kibana
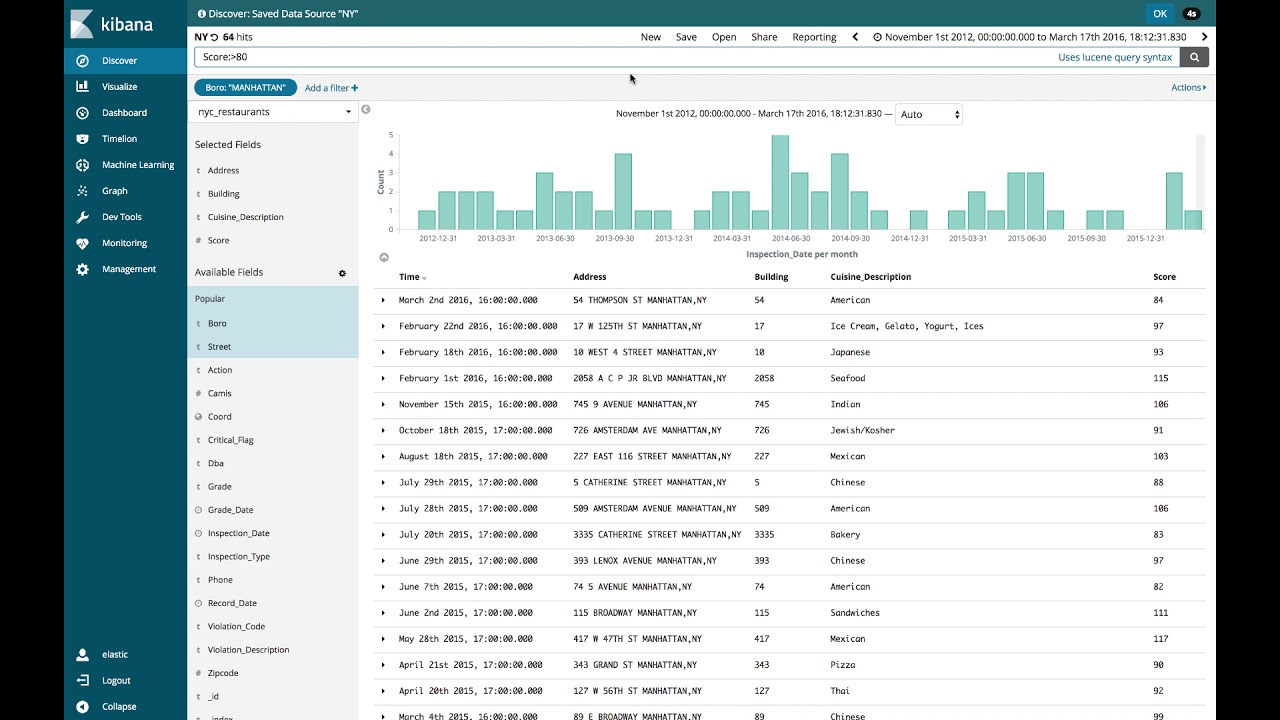
Kibana is used here as a tool to read the event log. This is a web application that makes requests to Elasticsearch. Allows you to build dashboards with different visualizations of indicators.
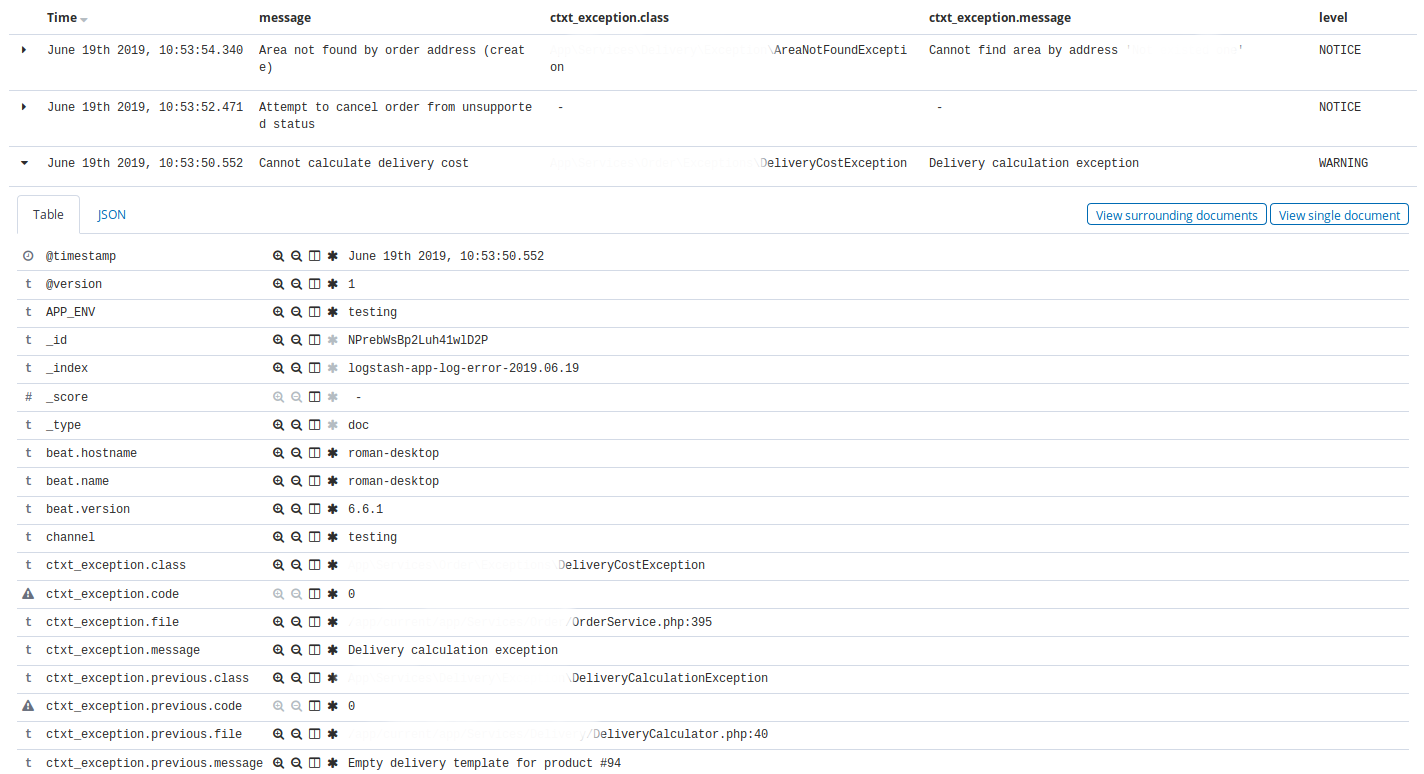
Kibana — Discovery . , Discovery app warning , time, message, exception class, host, client_id.
, Discovery nginx, 404 time, message, request, status.
Kibana , : , , . , ( ).
Elastalert
Elastalert Elasticsearch . , . , .
, (), .
:
- ALERT, EMERGENCY. — 10
- CRITICAL. — 30
- , N X M
- 10 INFO 3
- nginx 200, 201, 304 75% , 50
name: Blacklist ALERT, EMERGENCY type: blacklist index: logstash-app-* compare_key: "level" blacklist: - "ALERT" - "EMERGENCY" realert: minutes: 5 alert: - "slack" — . , , . Kibana.
, , http- 75% , , , , . - , , , .
, , , , Kibana, .
5 . , , , , , .
, . .
Kibana . .
docker-. , , staging- production-, .
, Elastalert, . Elastalert ,envsubst < /opt/elastalert/config.dist.yaml > /opt/elastalert/config.yaml entrypoint- , .
, , , .
build: docker build -t some-registry/elasticsearch elasticsearch docker build -t some-registry/logstash logstash docker build -t some-registry/kibana kibana docker build -t some-registry/nginx nginx docker build -t some-registry/curator curator docker build -t some-registry/elastalert elastalert push: docker push some-registry/elasticsearch docker push some-registry/logstash docker push some-registry/kibana docker push some-registry/nginx docker push some-registry/curator docker push some-registry/elastalert pull: docker pull some-registry/elasticsearch docker pull some-registry/logstash docker pull some-registry/kibana docker pull some-registry/nginx docker pull some-registry/curator docker pull some-registry/elastalert prepare: docker network create -d bridge elk-network || echo "ok" stop: docker rm -f kibana || true docker rm -f logstash || true docker rm -f elasticsearch || true docker rm -f nginx || true docker rm -f elastalert || true run-logstash: docker rm -f logstash || echo "ok" docker run -d --restart=always --network=elk-network --name=logstash -p 127.0.0.1:5001:5001 -e "LS_JAVA_OPTS=-Xms256m -Xmx256m" -e "ES_HOST=elasticsearch:9200" some-registry/logstash run-kibana: docker rm -f kibana || echo "ok" docker run -d --restart=always --network=elk-network --name=kibana -p 127.0.0.1:5601:5601 --mount source=elk-kibana,target=/usr/share/kibana/optimize some-registry/kibana run-elasticsearch: docker rm -f elasticsearch || echo "ok" docker run -d --restart=always --network=elk-network --name=elasticsearch -e "ES_JAVA_OPTS=-Xms1g -Xmx1g" --mount source=elk-esdata,target=/usr/share/elasticsearch/data some-registry/elasticsearch run-nginx: docker rm -f nginx || echo "ok" docker run -d --restart=always --network=elk-network --name=nginx -p 80:80 -v /root/elk/.htpasswd:/etc/nginx/.htpasswd some-registry/nginx run-elastalert: docker rm -f elastalert || echo "ok" docker run -d --restart=always --network=elk-network --name=elastalert --env-file=./elastalert/.env some-registry/elastalert run: prepare run-elasticsearch run-kibana run-logstash run-elastalert delete-old-indices: docker run --rm --network=elk-network -e "ES_HOST=elasticsearch:9200" some-registry/curator curator --config /curator/curator.yml /curator/actions.yml :
- 80 nginx, basic auth Kibana
- Logstash . ssh-
- nginx
- , docker-
- , .env- nginx-
- *_JAVA_OPTS , 4GB RAM ( ES).
, xpack-.
docker-compose. , , Dockerfile-, Filebeat, Logstash, , , , , VCS.
. . , ( Laravel scheduler), , 5 . ALERT. , . , , .
Conclusion
, , , . . , - . . , , .
')
Source: https://habr.com/ru/post/456676/
All Articles