Where was your home millions of years ago?
A virtual geochronological globe where you can see how the surface of our planet looked in different eras (Neo-Proterozoic, Paleozoic, Mesozoic, Cenozoic), starting from a time interval of 750 million years ago.
This project (visualization and support) was created by Jan Webster (computer science specialist from Mountain View, California, USA).
')
His decision uses data:
- project PALEOMAP (tectonic and paleogeographic maps). Link to the project and the globalgeology database .
- project LocationIQ (tool for address search).
Some visualization elements are not adjusted in time (for example, the position of clouds and stars). The coloring of cartographic materials used in the project is based on data on heights and surface relief (darker - lower, lighter - higher than height above sea level), the accuracy of determining the location of the desired locality ~ 100 km.
With the help of this virtual globe, it is proposed to visually trace changes in tectonic, climatic and evolutionary activity on Earth in different years of its life, to see the vector of the formation of the main contours of modern continents and mountain building.
The red bar on the right - these frames are implemented in the project:
Link to the online globe "Ancient Earth" .
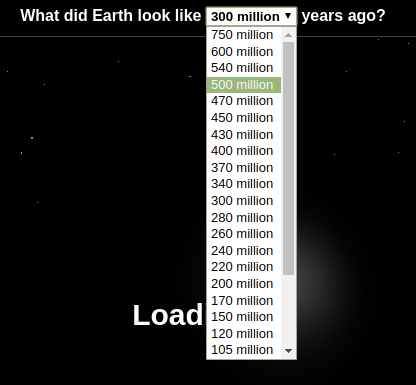
The project currently has two scales:
- temporary with the 26th choice (from 0 to 750 million years ago);
- event-based with the 20th choice of global phenomena of nature (the emergence of the first cereals, the first insects, the first crustaceans).

The highlight of this visual solution is the ability to ... find out exactly where on the planet millions of years ago would be your hometown.
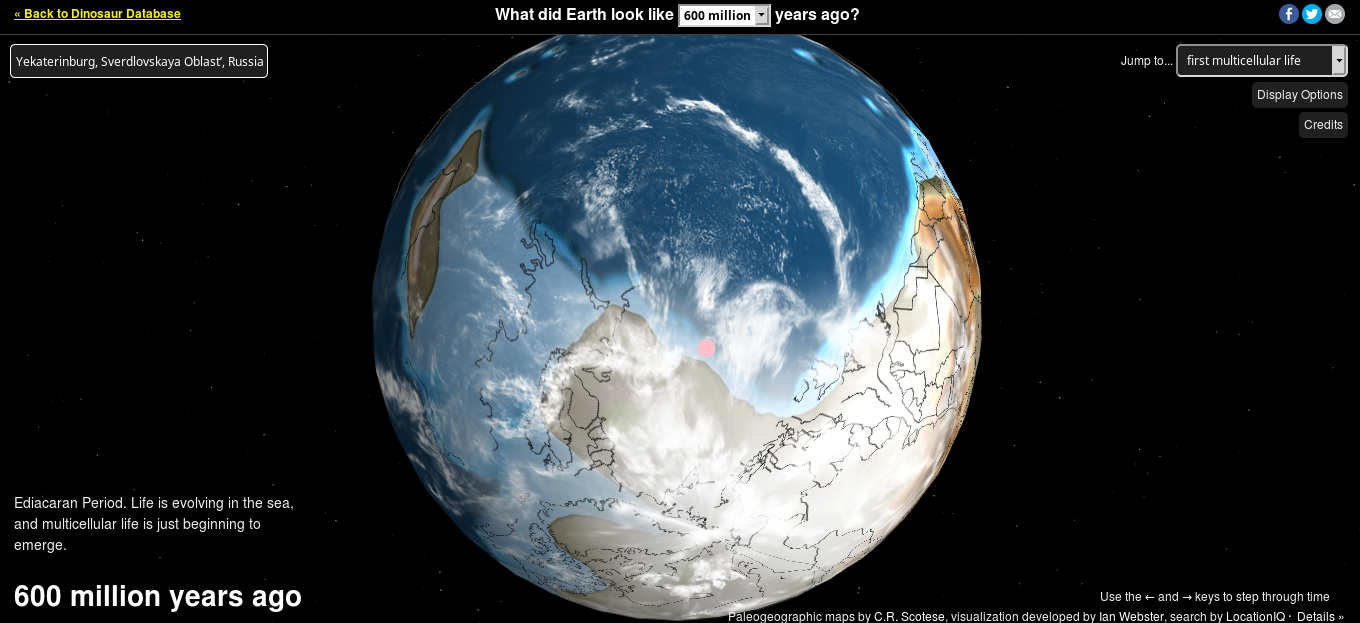
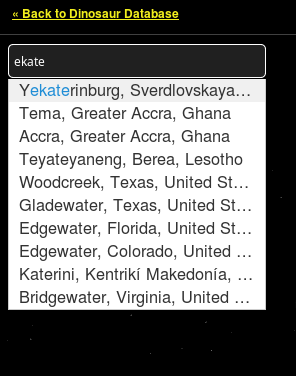
It is necessary in the upper left corner of the page to fill in the line in a special field - in Latin write the name of the settlement and choose from the options.
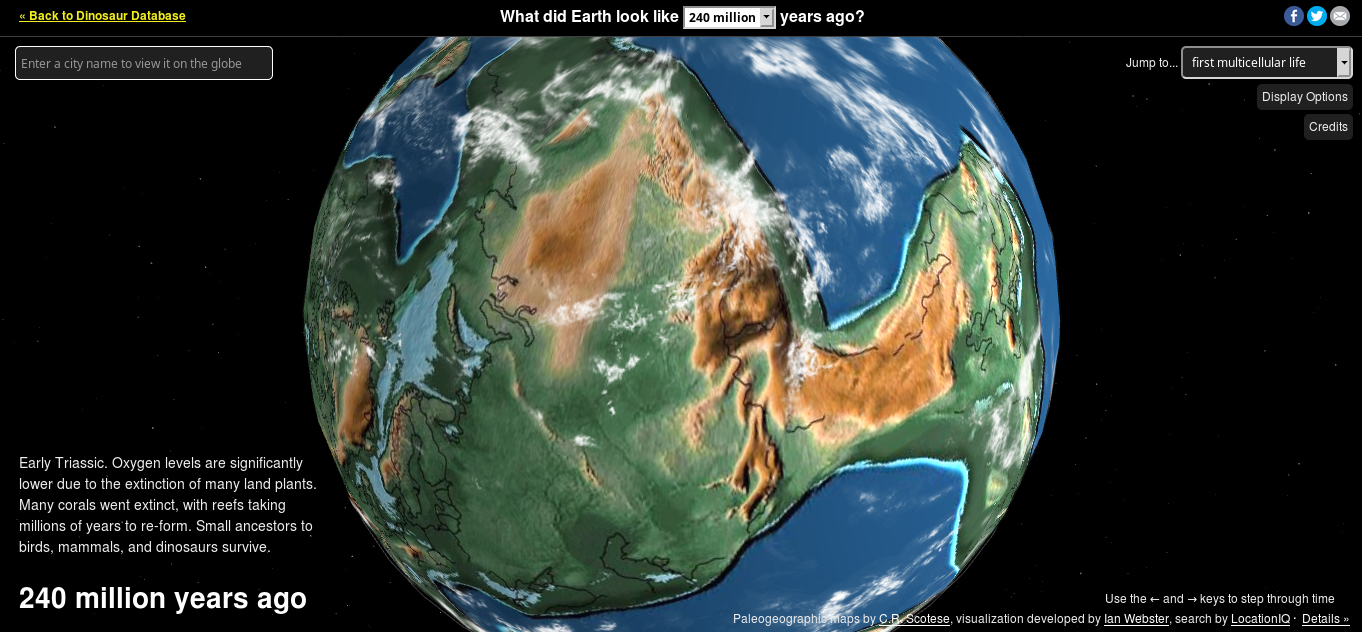
And now you can see how the surface of the Earth looked and its part in the place where your hometown would be, and even during the appearance of the first flowers, for example.
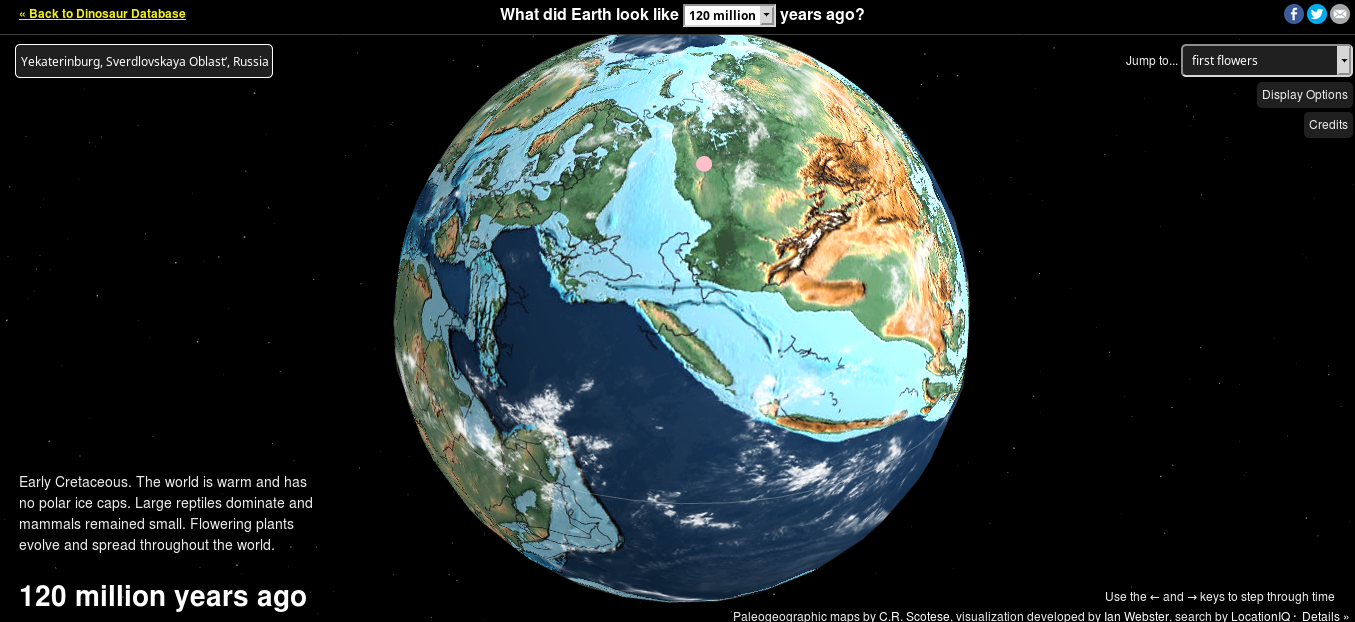
By pressing the buttons (arrows) left and right on the keyboard, you can see how the relief of the planet has changed with this place at different times.
By the way, I found an interesting bug: if after selecting a city and the appearance of a point, the choice of the second and so on cities begins, then the number of points will increase, an example with 4 cities (Moscow, Rostov-on-Don, Yekaterinburg and Novosibirsk):

Source: https://habr.com/ru/post/456168/
All Articles