The architecture of the service of distributed message queues in Yandex. Oblak
Hi, my name is Vasily Bogonatov. I am one of those who had a hand and a head and invested their soul in the service of distributed persistent message queues Yandex Message Queue. The service was publicly available at the end of May, but inside Yandex it has long been actively used in various products.
Today I want to tell Habr's readers about message queues in general and about Yandex Message Queue in particular. First, I want to explain what a “distributed persistent message queue” is and why it is needed. Show its practical value, the mechanics of working with messages, talk about the API and usability. In the second half of the material, we will look at the technical side: how Yandex Database is used in our queues (this is a solid foundation of our service), what a naive and improved approach to building architecture looks like, what distributional problems cause and how they can be solved.
Wikipedia defines the message queue as a “software engineering component used for inter-process or inter-thread communication within a single process”. In fact, this concept is somewhat broader: processes interacting with the help of a queue can be located on different servers and even in different data centers.
')
We will clarify terms a bit.
A message queue is a repository that stores and reads data in a specific order.
Two types of entities usually interact with the queue:
When using the queue, readers and writers are independent of each other. They can work with different performance, reliability, availability, and can even be written in different programming languages.
The main scenario for the queue: reliably and quickly transfer messages from the writer to the reader. Unlike the database, the queue is not intended for long-term storage of messages. In many popular implementations, there is a corresponding parameter - “Message retention period”. It determines how long the message is stored until it is permanently deleted.
We figured out the concept of the queue, go to the "distribution" and "persistence."
Distribution and persistence do not affect the main functionality of the queue, they provide fault tolerance and reliability of data storage. What types of failures can happen in our system, we will look at a little later. However, I can not deny myself the pleasure and slightly reveal the cards: in the entire history of the service, we have not lost a single saved client message.
The queue allows you to separate the logically independent parts of the services from each other, that is, provides decoupling , which is so in demand in the currently popular microservices. This increases scalability and reliability: you can always increase the flow of writing to the queue and add more readers - message handlers, while the refusal of readers does not affect the work of writers.
Queues smooth load peaks: they serve as a buffer for readers. If there are not enough readers for instant processing of all incoming messages of the current capacity, the messages placed in the queue will be processed later when the load decreases. Buffering is useful for services with unstable load, where instant processing of incoming events is not needed.
Let's take a look at how this works, using the example of a search robot (after all, Yandex began with a search!), Which downloads, processes, and puts web pages into a database. Take just such an architecture.
The message queue solves the following problems here:
The queue provides reliable data storage with scaling, allows you to postpone the processing of links. If one worker fails, the raw link will be returned to the queue after a certain period of time for processing by another worker. The queue has its own interface, which has been tested and described in the documentation, so that the systems of the search robot and the workers can develop different commands in different programming languages. This will not affect overall performance.
Here there are three main stages:
Record is considered successful if the message has been reliably saved and will soon be available to readers. It is possible to record with deduplication: when a repeated attempt to write the sent message is ignored.
At the time of reading the message is hidden from the queue for a period of time, which is called Visibility Timeout, and becomes inaccessible to other readers. If the visibility timeout expires, the message returns to the queue and becomes available again for processing. The order in which messages are read is determined by the queue, not by the reader.
The reader itself and the network connection to it are potentially unreliable. A visibility timeout is needed to be able to return a message to the queue when the reader crashes or the connection is broken. Otherwise, there is a chance that a single message will never be processed correctly.
After successful reading, the message is sent to the client along with the ReceiptHandle identifier. The identifier indicates specific data that should be removed from the message queue.
The first and most frequently used type is the Standard Queue. It is characterized by high throughput (thousands of messages per second), excellent performance and low execution time of basic operations. Standard queues consist of logical shards and support almost linear bandwidth scaling.
Standard queues do not support message deduplication when writing to a queue and do not guarantee the order of reading. Due to the use of sharding, a read request may not return a single message, even if they are in the queue. Most often this happens in short polling mode, when reading comes from one randomly selected shard.
The second type - FIFO - the opposite of the standard queue. Provides a strict reading order, supports deduplication when writing and retrying reading messages. Performance and scalability are lower than the standard. FIFO queue performance is limited to 30 requests per second. FIFO is recommended when trying to ensure the delivery semantics is “exactly once”. Usually, the word "queue" means exactly FIFO.
API is a very important part of any product. A good software interface should be simple and straightforward, requiring minimal familiarity with the documentation for effective use. Should not allow doing strange or unnecessary actions and protect against stupid mistakes, in time reporting a violation of the "contract".
If the system has such an API, it quickly gains loyal users and becomes cluttered with convenient “wrappers” for different platforms and programming languages.
Amazon Simple Queue Service API (AWS SQS API) is an example of such an interface, proven by time and a huge number of clients. Therefore, we decided not to invent a unique interface for Yandex Message Queue, but implemented support for the AWS SQS API, and very carefully.
In most cases, the SQS user only needs to change the endpoint (service address), the region (at the moment we only use “ru-central1”) and get new access details (credentials) within Yandex.Lamp. Everything else, for example, a script using the AWS command line , code using the AWS SDK or a ready service on Celery or boto , most likely, will not have to be touched. The logic and functionality of the queue service will remain the same.
Detailed description of Yandex Message Queue API methods is in the service documentation .
Yandex Message Queue is a managed service, that is, Yandex.Oblaco is responsible for the performance of servers and software. The service team monitors the health of the queues, promptly replaces the failed drives, eliminates network breaks and rolls updates. Updating occurs without stopping the service: as long as we install the new version of YMQ on one server group, the load balancer diligently redirects traffic to others. So users do not notice anything.
To make it easier for you to control the work of the queues, we added a large number of visual graphs to the YMQ, here only a small part of them is shown. Charts are located in the console Yandex. Oblaka, in the "Statistics".

We will tell you about the four most useful graphics in our opinion:
Charts help to instantly assess the dynamics of the queue and the presence of failures without the need to view the logs.
We discussed more or less general points, now let's get to the details.
The Yandex Message Queue service is built on top of the Yandex Database (YDB) geo-distributed, fault-tolerant database, which provides strict consistency and support for ACID transactions. We will not now disassemble its device and characteristics, we restrict ourselves to the general scheme.
A queue in YMQ consists of logical shards, represented by some fixed set of tables YDB. Each table stores its own piece of information. For example, there is a common state table called State, which stores the offset and the actual number of messages. There is a table with data and message metadata. There is a table with related attributes.
All the main operations with the queue - working with messages, changing attributes, creating and deleting - this is working with a hierarchy of tables and directories YDB, or transactional requests to one or more tables in the queue. The data inside the queue tables is the source of absolute truth. Therefore, in addition to the correct and stable operation of the database, it is necessary to ensure reliable storage and high availability of data.
Our information is stored in several replicas: one copy in each of the three Yandex data centers. In case of unavailability of one of the data centers, the number of replicas in the remaining doubles. Thus, the required level of reliability is restored. Even if the whole data center fails and one service counter in the other, the data will be fully accessible.
The first version of the YMQ architecture, which we ourselves called naive, looked like this.
The diagram shows the path of the HTTPS request from the YMQ client to the YDB repository. Let's look at the main components:
This architecture has a flaw: all servers in the cluster work independently with tables in the same queue. This adversely affects performance and makes it difficult to organize reliable caches of hidden and readable messages. It is difficult to limit the flow of requests, and this is very important for any high-load service.
Load firing showed that the first version of the architecture withstands about 450 messages per second per queue with one shard. It was very small.
The main problem was contention requests. A large number of logically conflicting transactions quickly brought hidden message caches to an inconsistent state. To solve the problem, we introduced a special entity - the queue master.

A queue master is an actor that normally exists in a cluster in a single copy and passes all requests related to a specific queue through itself. If the request to the queue comes to the server where the required master is missing, a special proxy actor redirects the request and then transmits the response received from the master back.
When using the queue wizard, the correct cache of unblocked messages reduces contention when working with tables. The implementation of restricting the flow of requests is simplified, for example, through the Leaky bucket . Fast and accurate queue metrics are available: number of messages, total traffic, and the like. You can group similar requests.
In theory, such an architecture has certain disadvantages associated with centralization:
Distributed transactions with database tables lead to certain additional costs, so the idea of reducing the number of queries seemed logical to us. One hundred transactions to write messages one by one is better to turn into one transaction to write one hundred messages at once. With queue masters, it is much easier to implement such batch processing (batching, batching).

Butching increases latency somewhat when performing operations. In exchange, throughput is greatly increased. With a batching, a single-queue queue can handle up to 30,000 requests per second.
In general, the loading of queues is very different: and thousands of messages per second, and several messages per day. We needed to optimize work with queues using a flexible algorithm. Frontal options with the accumulation of messages in the buffer to a threshold number or reset by timer did not suit us. Therefore, we developed an adaptive batching algorithm for YMQ that works well in both cases. His work is shown in a timeline format.
Here, when a new message arrives, one of three scenarios is possible:
The idea of adaptive batching resembles Nagle ’s TCP / IP algorithm . And what is interesting: according to the results of load tests, we found out that adaptive batching reduces the latency of operations a little. The number of simultaneous transactions decreases, and with it the load on the tables. By the sum of factors, the solution with adaptive batching surpassed the first naive solution in all variants of scenarios.
In Yandex Message Queue, as in any distributed system, emergencies may arise. Servers are denied, disks are inhibited, the network inside and between data centers is torn.
In such cases, YDB automatically transfers the affected tablets to a more suitable server within the cluster within a few seconds. YMQ queuing wizards are carried along with their pills.
Not in all cases it is possible to reliably determine the status of the server over the network, so there are situations when a new master is already running and the old one has not yet stopped working.
For YMQ, this is not a problem. Requests to the database do not make assumptions about the accuracy of the cache of visible messages and check each of them again during the process of hiding. Therefore, the existence of "extra" wizards only leads to a small temporary decrease in performance.
In YDB, it is impossible to create multiple tables and modify data in a single transaction. For us, this meant that a queue, which is physically a set of tables, cannot be created “transactionally”. When racing in parallel requests or in case of machine failures, you can get an inconsistent state from which it is impossible to get out without outside intervention. We thought and developed just such a scheme for solving the problem.
The basic idea is this: for each request for creating a queue, the necessary queue data structures are created in parallel and independently. Thus, versions are created that at the end are “committed” as a string to a special table. The winner version is chosen, and all the “losers” requests understand which version has “won” and return the correct link.
Such an algorithm in the “all or nothing” paradigm is resistant to failures due to the independence of the created structures and the presence of the final transaction with the commit version. If the commit is completed successfully, we can assume that the requested queue was created correctly.
Yandex Message Queue is a complex software and hardware complex. He has many possible points of failure. We must be confident in the quality of service that we provide. Therefore, we regularly test it.
In addition to running the tests, it is important to monitor the state of production. To do this, we have various online checks and graphs with set thresholds and configured alerts. Alerts come on duty. Our daily team is involved in the daily duty.
First of all, we track:
All this helps us to ensure high reliability and availability of service through the efforts of a small team and concentrate on the development of the product.
The task of infrastructure teams in Yandex is to create and maintain reliable, scalable and productive solutions, based on which you can quickly and successfully launch new products that improve the lives of end users. Inside the company, our queue service proved its usefulness long ago and became part of the Yandex.Video, Yandex.Market, Yandex.Education, Yandex.Taxi and other services architecture.
Now it is available in the Yandex.Oblak ecosystem and can be used to build services inside and outside the Cloud itself. Now new users receive a cash grant for registration during registration, so you can try Yandex Message Queue for free.
Today I want to tell Habr's readers about message queues in general and about Yandex Message Queue in particular. First, I want to explain what a “distributed persistent message queue” is and why it is needed. Show its practical value, the mechanics of working with messages, talk about the API and usability. In the second half of the material, we will look at the technical side: how Yandex Database is used in our queues (this is a solid foundation of our service), what a naive and improved approach to building architecture looks like, what distributional problems cause and how they can be solved.
What is a distributed persistent message queue?
Wikipedia defines the message queue as a “software engineering component used for inter-process or inter-thread communication within a single process”. In fact, this concept is somewhat broader: processes interacting with the help of a queue can be located on different servers and even in different data centers.
')
We will clarify terms a bit.
A message queue is a repository that stores and reads data in a specific order.
Two types of entities usually interact with the queue:
- writers (producers) - send messages to the queue;
- readers (consumers) - get (read) messages from the queue.
When using the queue, readers and writers are independent of each other. They can work with different performance, reliability, availability, and can even be written in different programming languages.
The main scenario for the queue: reliably and quickly transfer messages from the writer to the reader. Unlike the database, the queue is not intended for long-term storage of messages. In many popular implementations, there is a corresponding parameter - “Message retention period”. It determines how long the message is stored until it is permanently deleted.
We figured out the concept of the queue, go to the "distribution" and "persistence."
- Distribution in our case means the presence of a cluster that stores and processes the data and metadata of the queues, combining all its nodes into a coherent whole with the help of a computer network.
- Persistence implies that all messages in the queue are written to disk, and the writer receives confirmation of sending only after successful recording.
Distribution and persistence do not affect the main functionality of the queue, they provide fault tolerance and reliability of data storage. What types of failures can happen in our system, we will look at a little later. However, I can not deny myself the pleasure and slightly reveal the cards: in the entire history of the service, we have not lost a single saved client message.
What is the message queue for?
The queue allows you to separate the logically independent parts of the services from each other, that is, provides decoupling , which is so in demand in the currently popular microservices. This increases scalability and reliability: you can always increase the flow of writing to the queue and add more readers - message handlers, while the refusal of readers does not affect the work of writers.
Queues smooth load peaks: they serve as a buffer for readers. If there are not enough readers for instant processing of all incoming messages of the current capacity, the messages placed in the queue will be processed later when the load decreases. Buffering is useful for services with unstable load, where instant processing of incoming events is not needed.
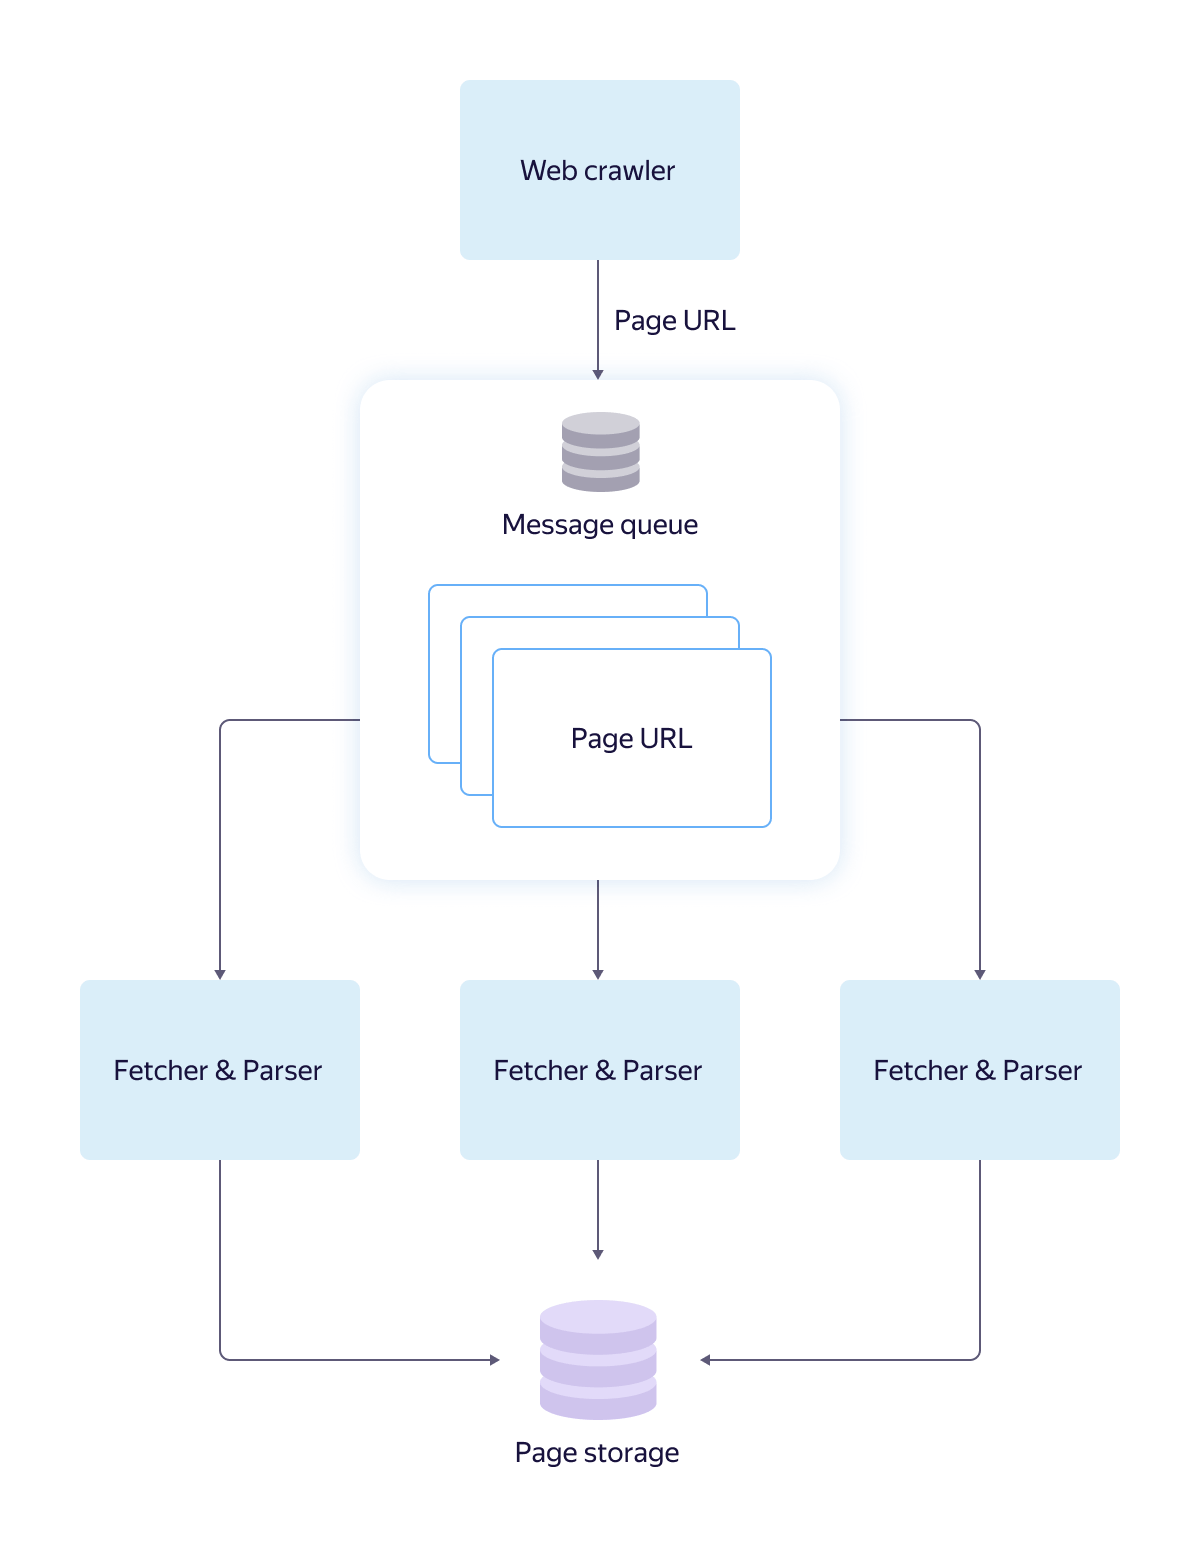
Let's take a look at how this works, using the example of a search robot (after all, Yandex began with a search!), Which downloads, processes, and puts web pages into a database. Take just such an architecture.
The message queue solves the following problems here:
- The robot is much faster than the workers who are responsible for parsing and loading pages into the database. Without a queue, links would accumulate and fill up the available memory or disk. The same thing would happen if the workers were temporarily unavailable.
- Without a queue, the robot needs to “know” the working interface of the workers in order to assign them tasks. The interface may change as the product develops.
- The individual worker has low reliability, so there is no guarantee that the link will be processed by him completely.
The queue provides reliable data storage with scaling, allows you to postpone the processing of links. If one worker fails, the raw link will be returned to the queue after a certain period of time for processing by another worker. The queue has its own interface, which has been tested and described in the documentation, so that the systems of the search robot and the workers can develop different commands in different programming languages. This will not affect overall performance.
How Yandex Message Queue works with messages
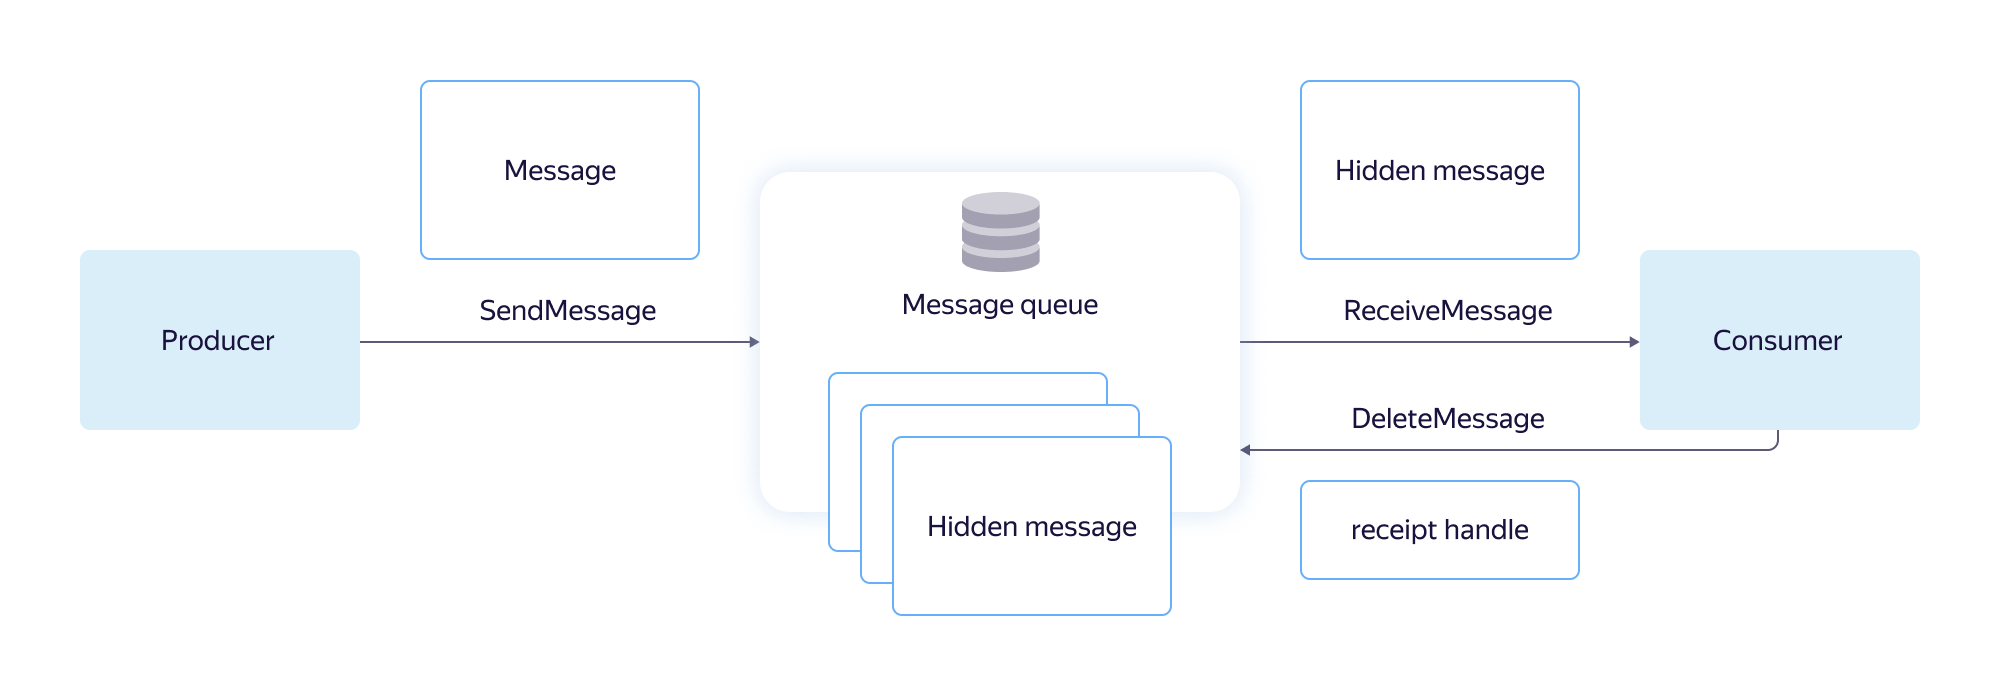
Here there are three main stages:
- write message to the queue;
- reading a message from the queue;
- remove message from queue.
Record is considered successful if the message has been reliably saved and will soon be available to readers. It is possible to record with deduplication: when a repeated attempt to write the sent message is ignored.
At the time of reading the message is hidden from the queue for a period of time, which is called Visibility Timeout, and becomes inaccessible to other readers. If the visibility timeout expires, the message returns to the queue and becomes available again for processing. The order in which messages are read is determined by the queue, not by the reader.
The reader itself and the network connection to it are potentially unreliable. A visibility timeout is needed to be able to return a message to the queue when the reader crashes or the connection is broken. Otherwise, there is a chance that a single message will never be processed correctly.
After successful reading, the message is sent to the client along with the ReceiptHandle identifier. The identifier indicates specific data that should be removed from the message queue.
Types of queues in Yandex Message Queue
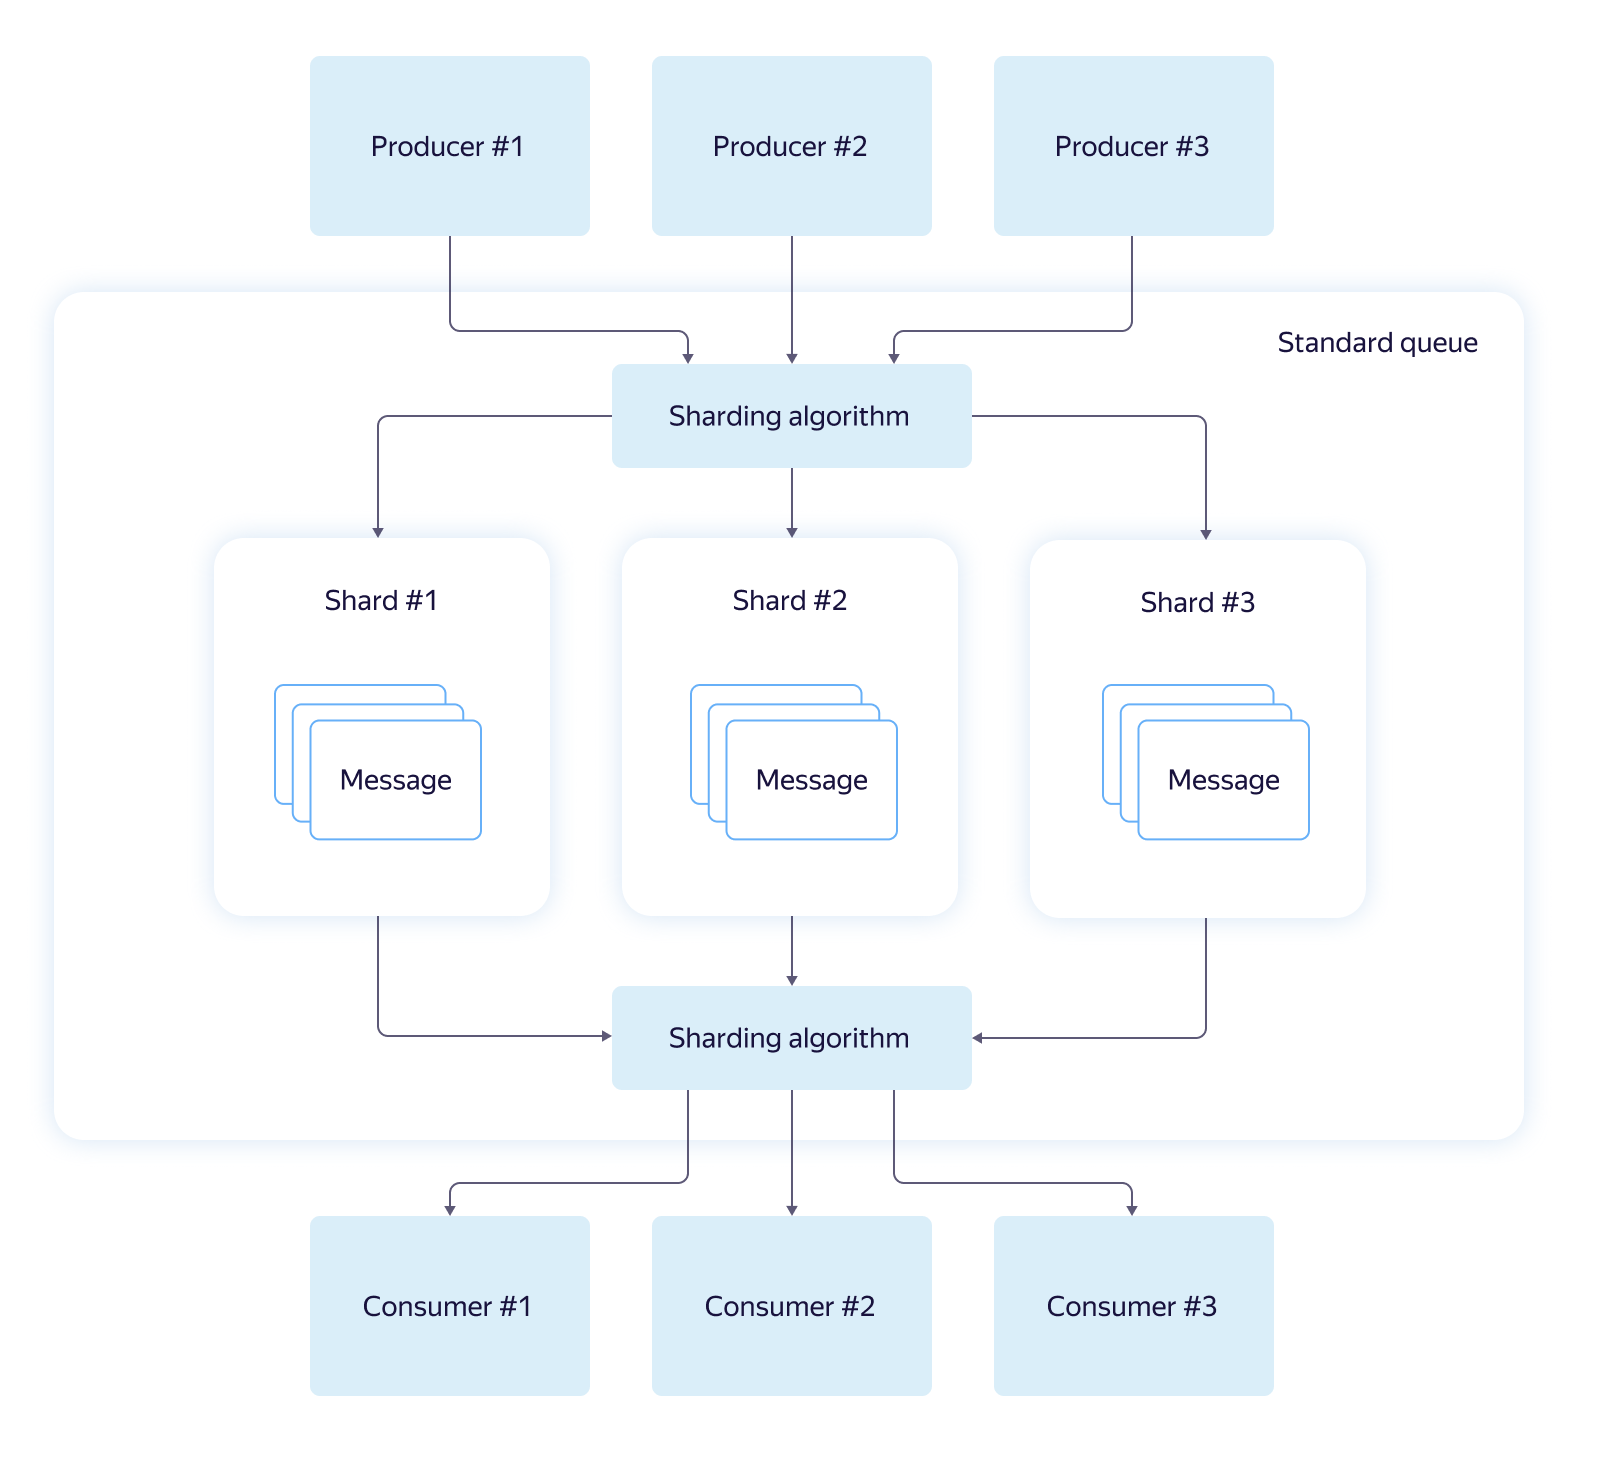
The first and most frequently used type is the Standard Queue. It is characterized by high throughput (thousands of messages per second), excellent performance and low execution time of basic operations. Standard queues consist of logical shards and support almost linear bandwidth scaling.
Standard queues do not support message deduplication when writing to a queue and do not guarantee the order of reading. Due to the use of sharding, a read request may not return a single message, even if they are in the queue. Most often this happens in short polling mode, when reading comes from one randomly selected shard.
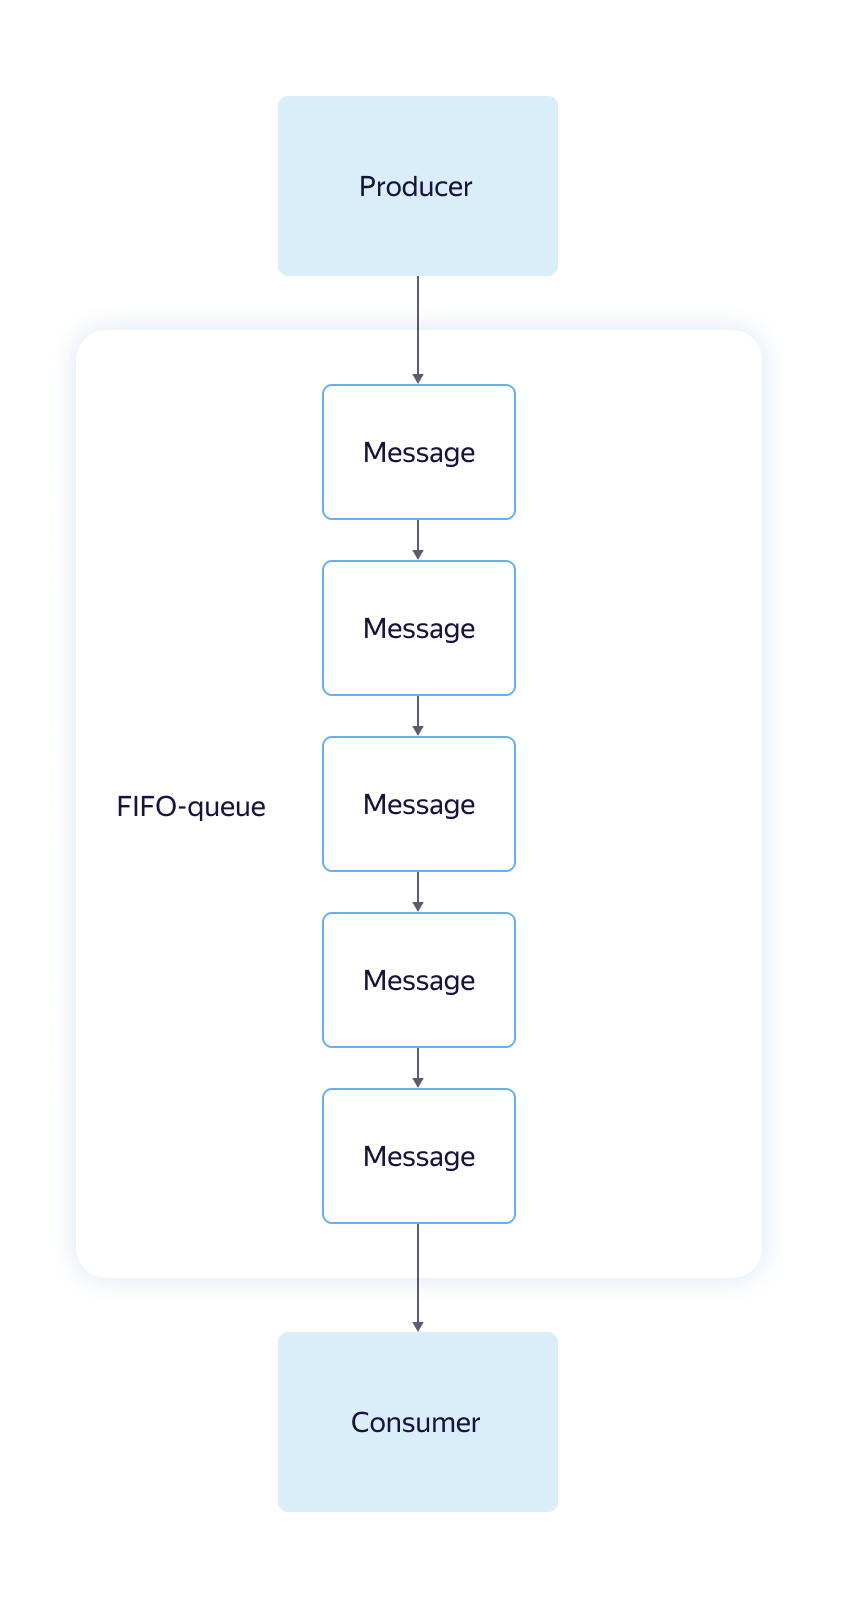
The second type - FIFO - the opposite of the standard queue. Provides a strict reading order, supports deduplication when writing and retrying reading messages. Performance and scalability are lower than the standard. FIFO queue performance is limited to 30 requests per second. FIFO is recommended when trying to ensure the delivery semantics is “exactly once”. Usually, the word "queue" means exactly FIFO.
Yandex Message Queue API
API is a very important part of any product. A good software interface should be simple and straightforward, requiring minimal familiarity with the documentation for effective use. Should not allow doing strange or unnecessary actions and protect against stupid mistakes, in time reporting a violation of the "contract".
If the system has such an API, it quickly gains loyal users and becomes cluttered with convenient “wrappers” for different platforms and programming languages.
Amazon Simple Queue Service API (AWS SQS API) is an example of such an interface, proven by time and a huge number of clients. Therefore, we decided not to invent a unique interface for Yandex Message Queue, but implemented support for the AWS SQS API, and very carefully.
In most cases, the SQS user only needs to change the endpoint (service address), the region (at the moment we only use “ru-central1”) and get new access details (credentials) within Yandex.Lamp. Everything else, for example, a script using the AWS command line , code using the AWS SDK or a ready service on Celery or boto , most likely, will not have to be touched. The logic and functionality of the queue service will remain the same.
Detailed description of Yandex Message Queue API methods is in the service documentation .
A little about convenience
Yandex Message Queue is a managed service, that is, Yandex.Oblaco is responsible for the performance of servers and software. The service team monitors the health of the queues, promptly replaces the failed drives, eliminates network breaks and rolls updates. Updating occurs without stopping the service: as long as we install the new version of YMQ on one server group, the load balancer diligently redirects traffic to others. So users do not notice anything.
To make it easier for you to control the work of the queues, we added a large number of visual graphs to the YMQ, here only a small part of them is shown. Charts are located in the console Yandex. Oblaka, in the "Statistics".
We will tell you about the four most useful graphics in our opinion:
- The “Messages in Queue” graph helps to monitor the accumulation of data in the queue. The growth of the graph may mean that the handlers are not coping with the load or the processing has stopped.
- The “Age of the oldest message in the queue” graph: large values signal problems with message processing. If everything works correctly, the messages should not be long in the queue.
- The graph “Number of attempts to read a message” shows when messages begin to be read several times. This may mean that handlers crash when they receive some messages.
- The graph “Time in queue” tells how much time passes from the moment the message is sent to the queue until it is received by the processor.
Charts help to instantly assess the dynamics of the queue and the presence of failures without the need to view the logs.
We discussed more or less general points, now let's get to the details.
How Yandex Database used Queue Database
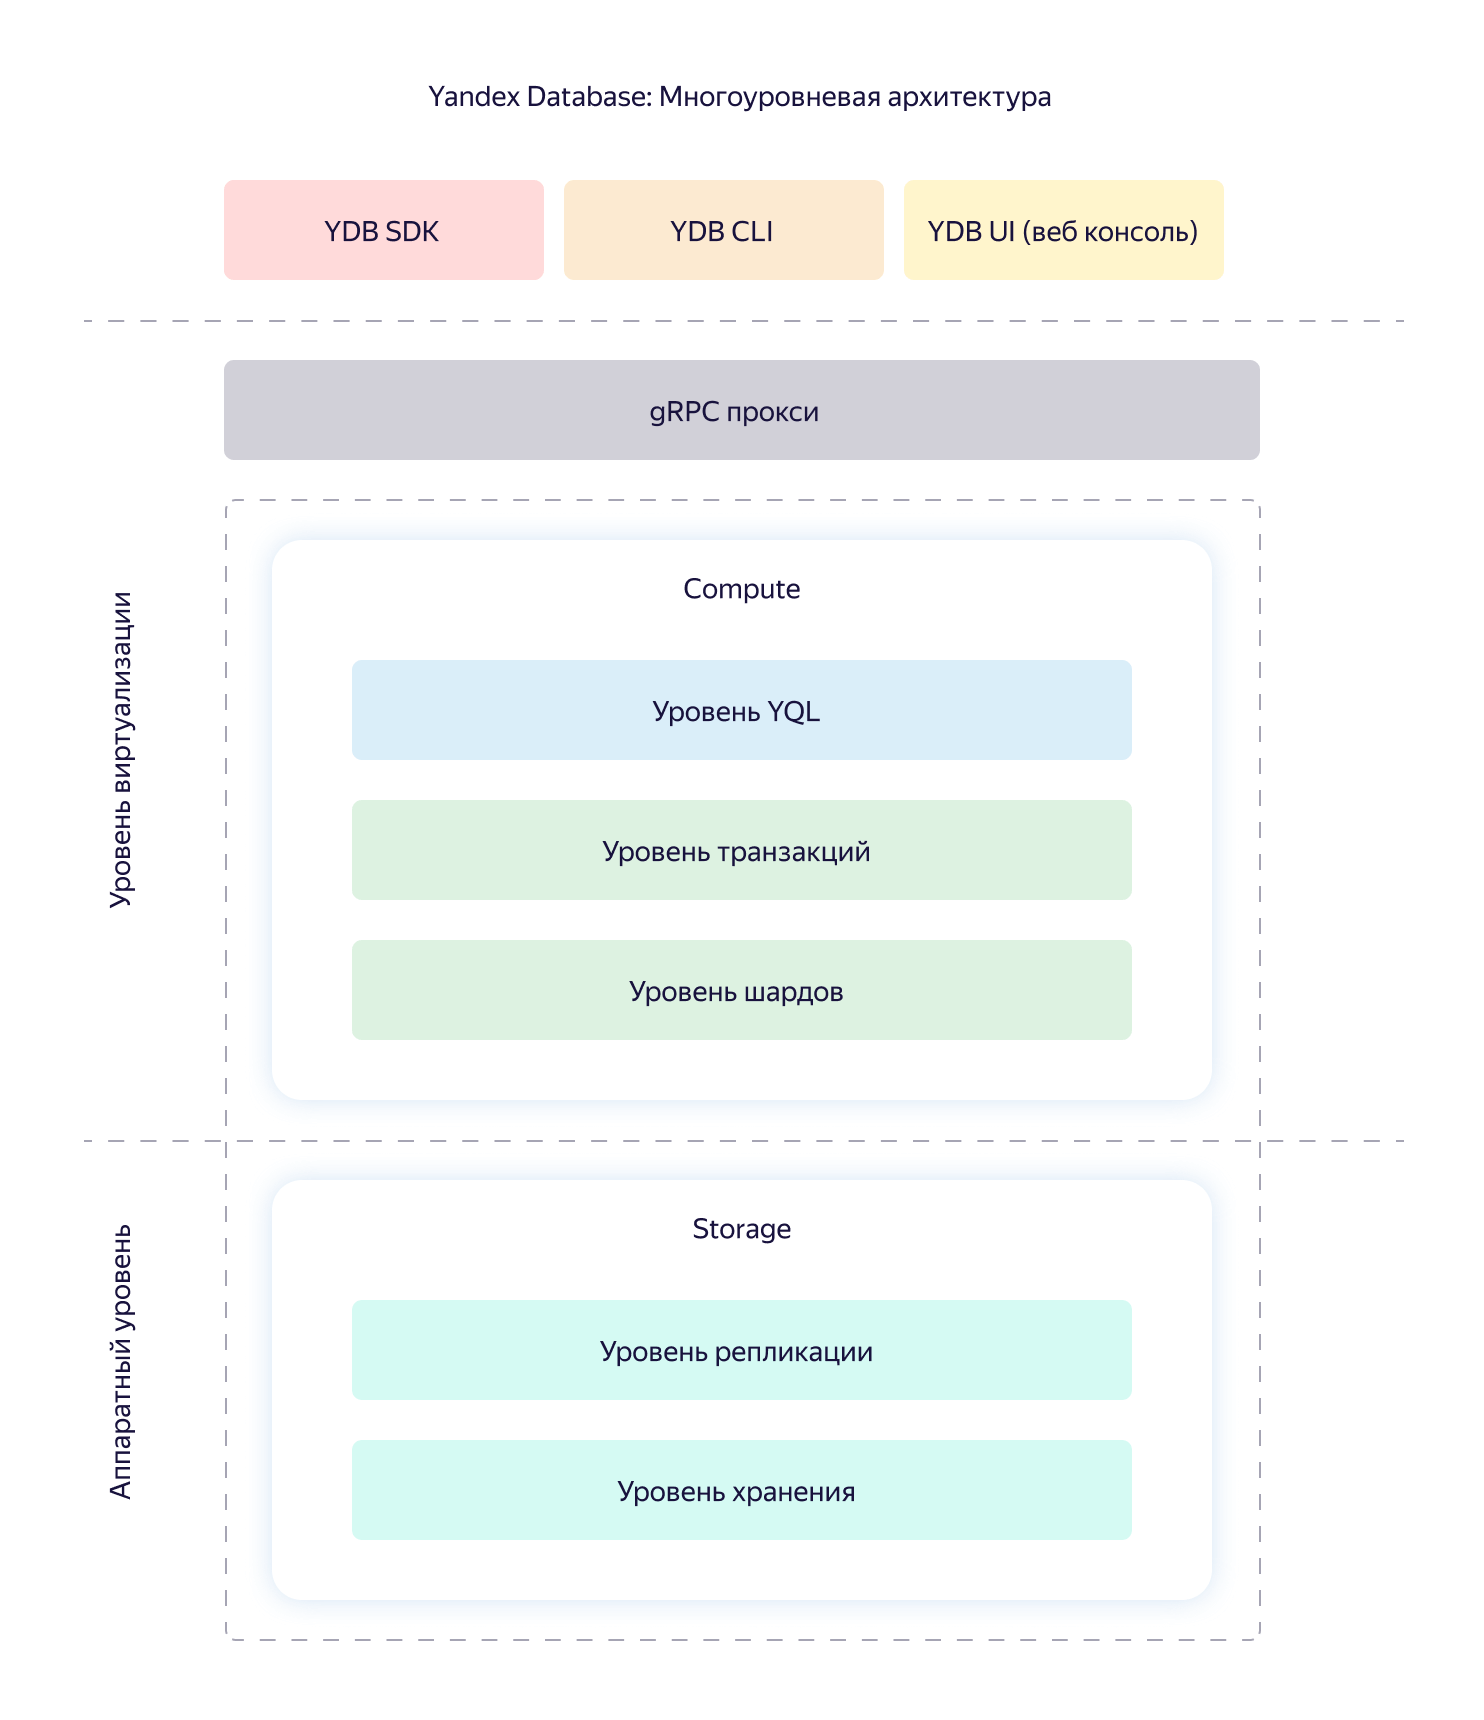
The Yandex Message Queue service is built on top of the Yandex Database (YDB) geo-distributed, fault-tolerant database, which provides strict consistency and support for ACID transactions. We will not now disassemble its device and characteristics, we restrict ourselves to the general scheme.
A queue in YMQ consists of logical shards, represented by some fixed set of tables YDB. Each table stores its own piece of information. For example, there is a common state table called State, which stores the offset and the actual number of messages. There is a table with data and message metadata. There is a table with related attributes.
All the main operations with the queue - working with messages, changing attributes, creating and deleting - this is working with a hierarchy of tables and directories YDB, or transactional requests to one or more tables in the queue. The data inside the queue tables is the source of absolute truth. Therefore, in addition to the correct and stable operation of the database, it is necessary to ensure reliable storage and high availability of data.
Our information is stored in several replicas: one copy in each of the three Yandex data centers. In case of unavailability of one of the data centers, the number of replicas in the remaining doubles. Thus, the required level of reliability is restored. Even if the whole data center fails and one service counter in the other, the data will be fully accessible.
The first version of the architecture Yandex Message Queue
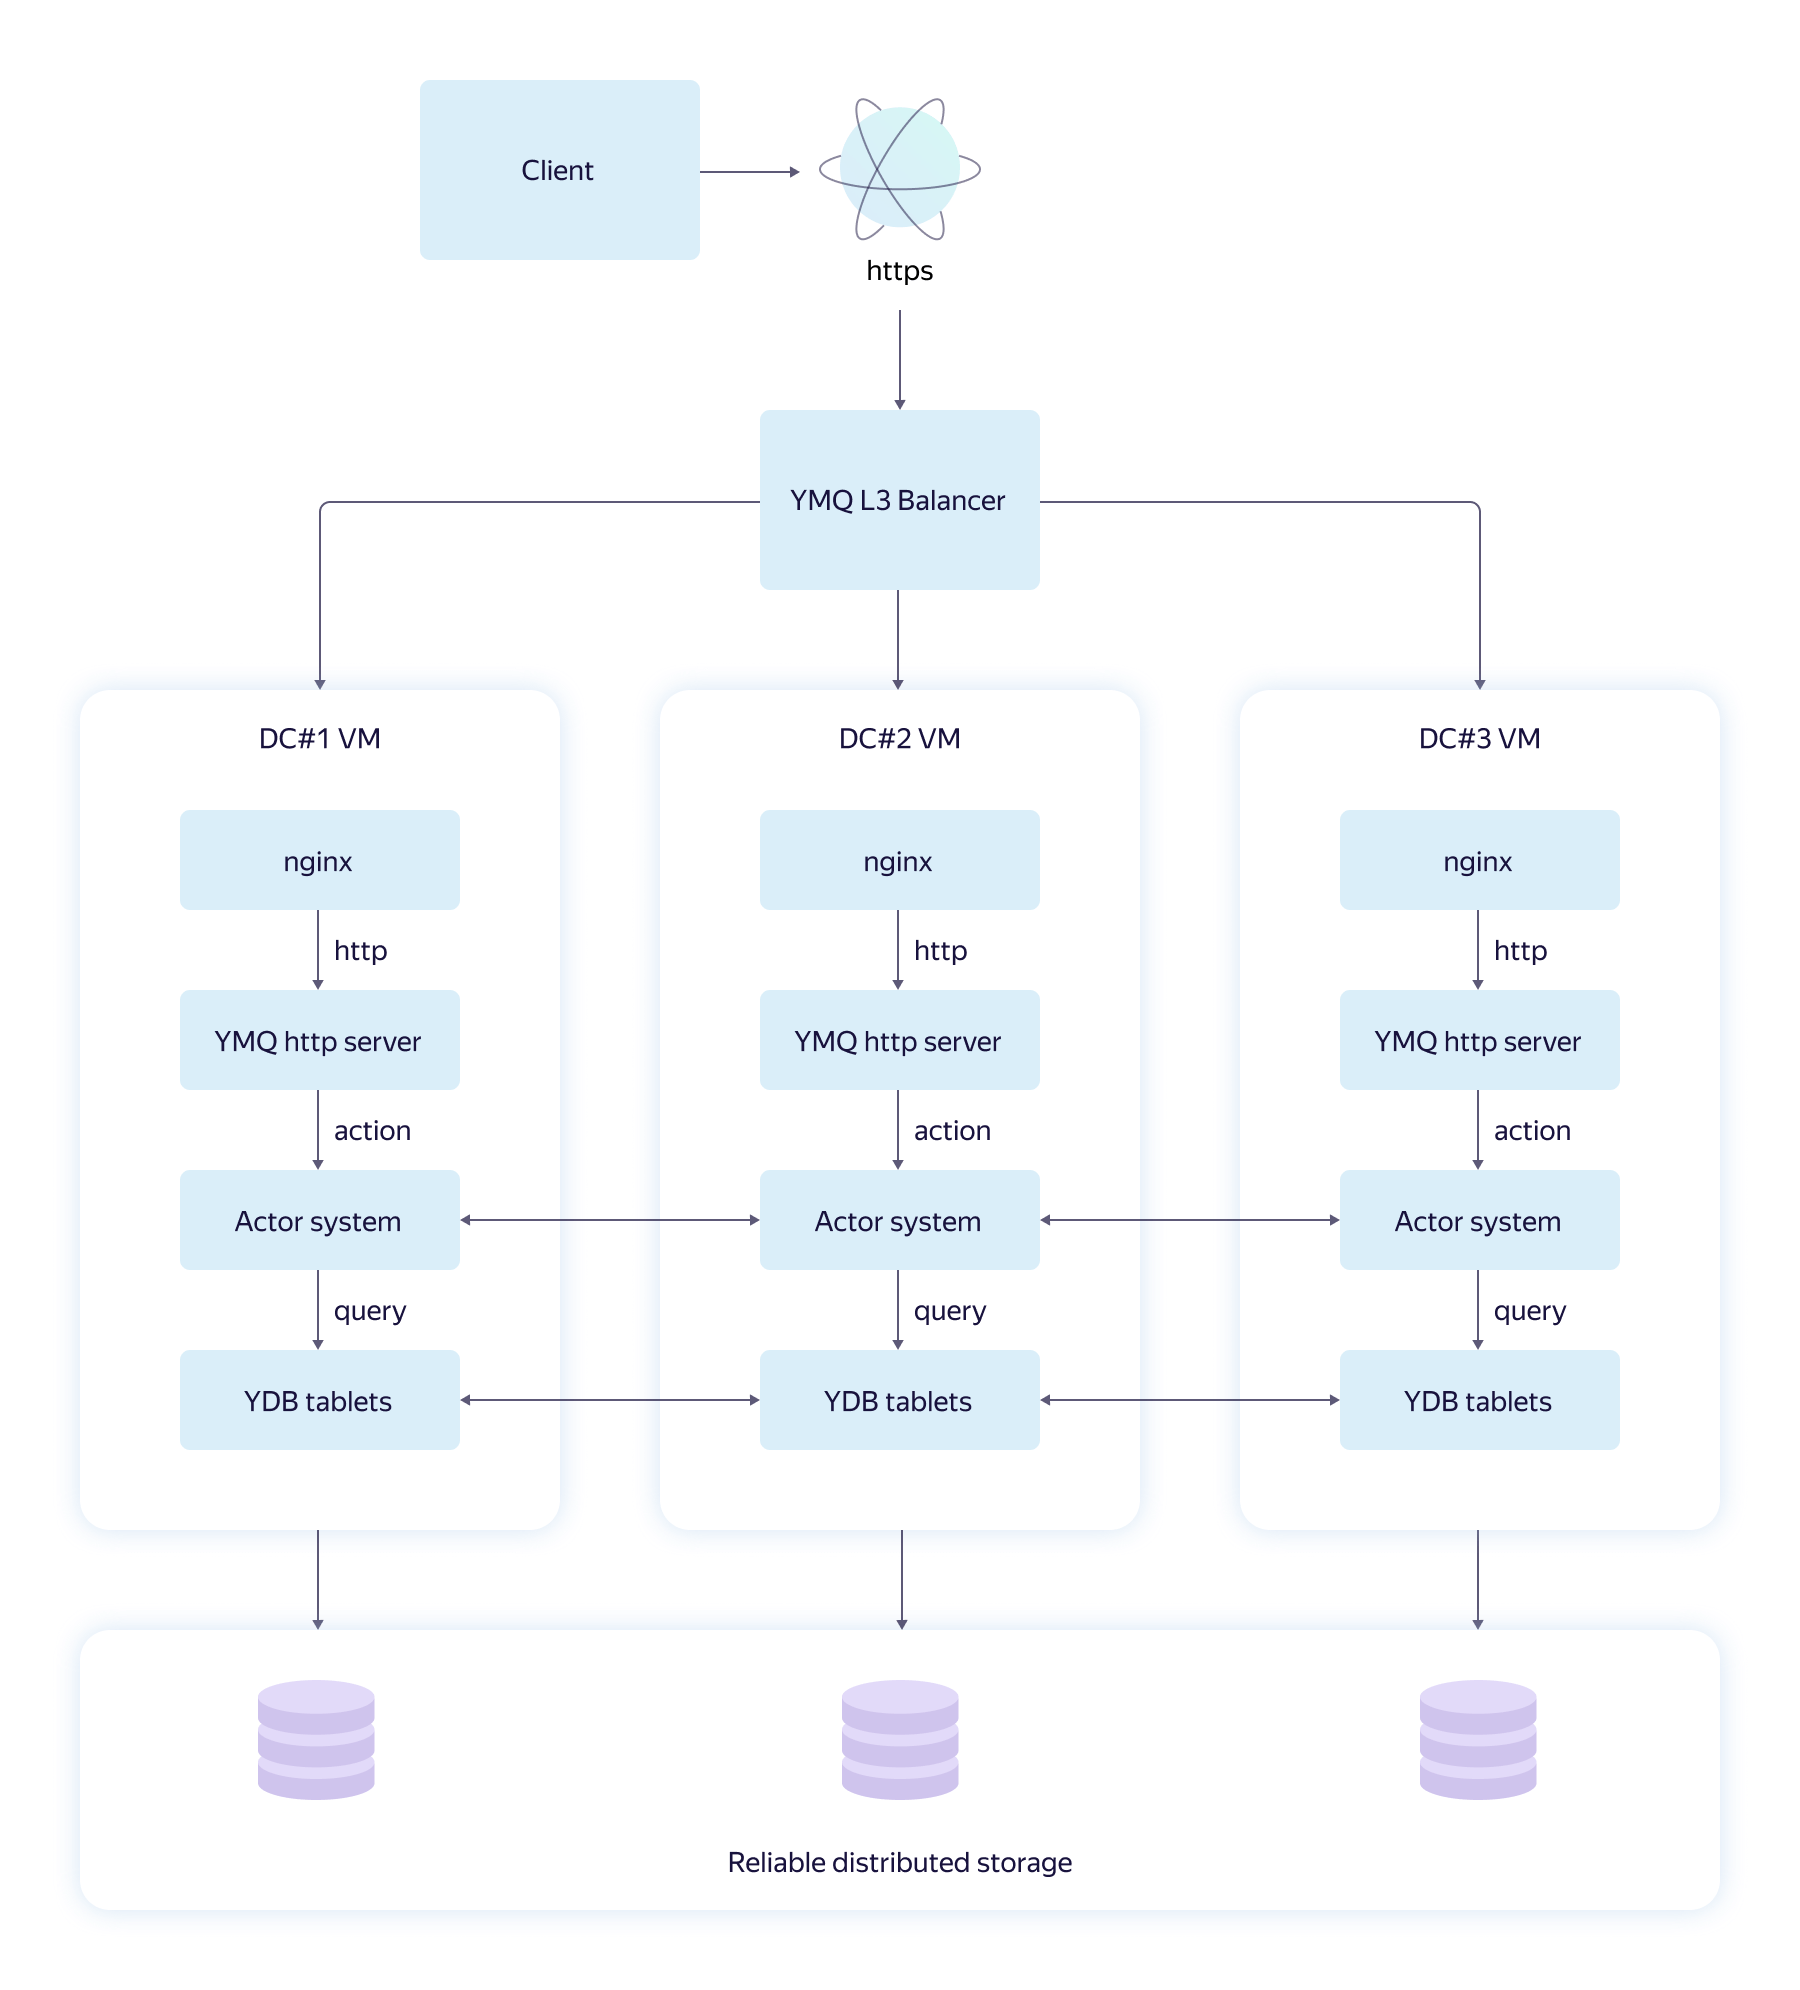
The first version of the YMQ architecture, which we ourselves called naive, looked like this.
The diagram shows the path of the HTTPS request from the YMQ client to the YDB repository. Let's look at the main components:
- The L3 balancer sends the request to the Yandex data center closest to the user. This reduces network delays, although the load is unevenly distributed.
- Nginx on the Yandex.Cloud virtual machine terminates HTTPS connections, provides protection against network attacks, and proxies the request further to the YMQ server, already in HTTP.
- The YMQ HTTP server implements the SQS HTTP API logic, validates, and translates the request into the strongly typed protobuf format.
- YMQ Actor system - actor system . It simultaneously launched thousands of different actors sharing information. The actor system of each host is part of a cluster. All cluster actors live and act as one. The business logic of YMQ is implemented in various actors implementing query transactions to YDB.
- YDB tablets ("tablets") - part of the YDB core, which is responsible for working with tables in queries and transactions. The tablets themselves do not store data. These are control structures in memory that are able to recover in the event of a hardware failure.
- Storage - reliable, distributed, fault-tolerant storage.
This architecture has a flaw: all servers in the cluster work independently with tables in the same queue. This adversely affects performance and makes it difficult to organize reliable caches of hidden and readable messages. It is difficult to limit the flow of requests, and this is very important for any high-load service.
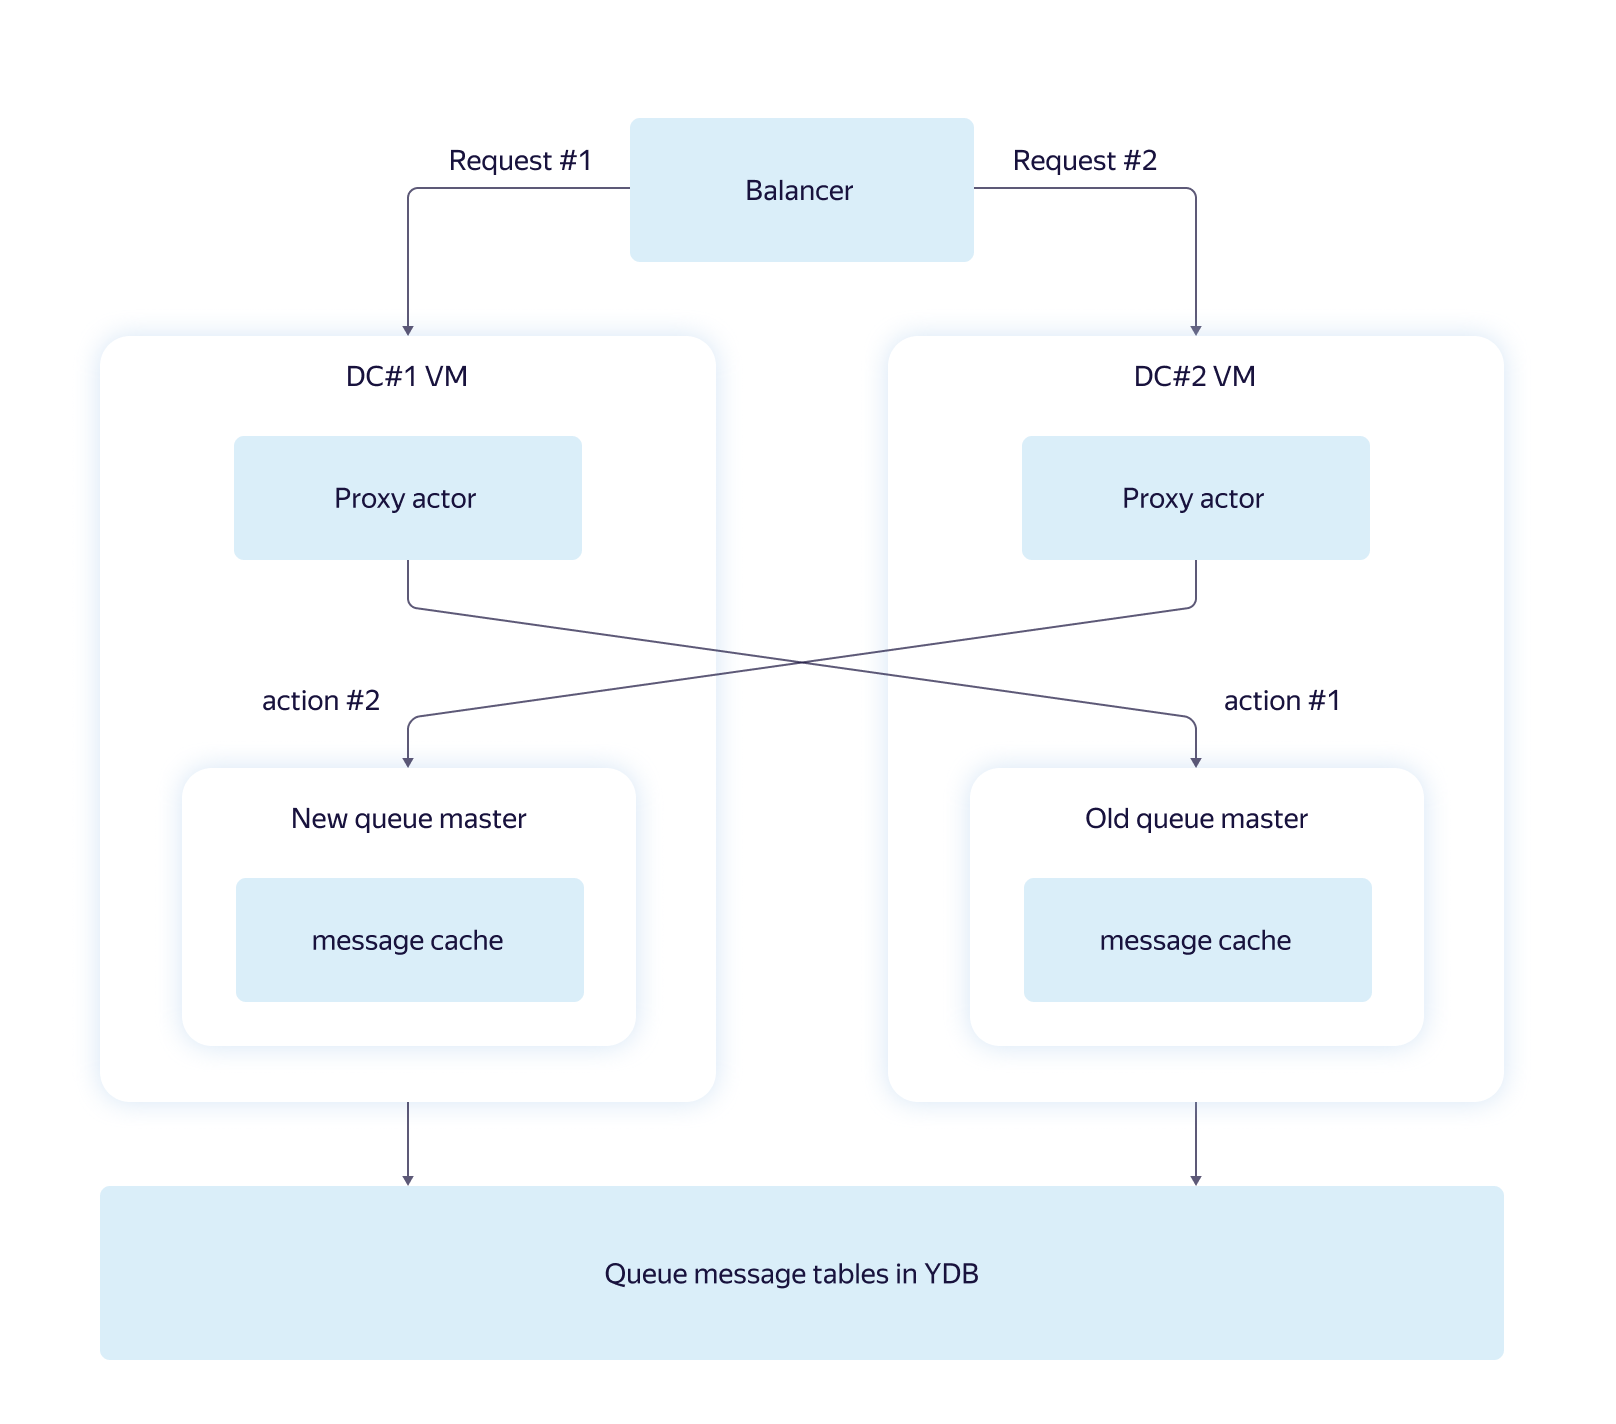
Yandex Message Queue architecture with queue masters
Load firing showed that the first version of the architecture withstands about 450 messages per second per queue with one shard. It was very small.
The main problem was contention requests. A large number of logically conflicting transactions quickly brought hidden message caches to an inconsistent state. To solve the problem, we introduced a special entity - the queue master.
A queue master is an actor that normally exists in a cluster in a single copy and passes all requests related to a specific queue through itself. If the request to the queue comes to the server where the required master is missing, a special proxy actor redirects the request and then transmits the response received from the master back.
When using the queue wizard, the correct cache of unblocked messages reduces contention when working with tables. The implementation of restricting the flow of requests is simplified, for example, through the Leaky bucket . Fast and accurate queue metrics are available: number of messages, total traffic, and the like. You can group similar requests.
In theory, such an architecture has certain disadvantages associated with centralization:
- Reduced fault tolerance: if a virtual machine with a master fails, all queues with masters on it will be unavailable. However, special YDB mechanisms allow you to raise new masters within a cluster in just a few seconds. This largely solves the problem.
- Limited scalability: all requests go through the same host. The disadvantage is leveled tablets YDB. They are the ones who do all the hard work with data. And the master asynchronously sends requests and processes the received results. This makes it a “light” entity that does not create a bottleneck effect under load testing.
Quest queuing in queue masters
Distributed transactions with database tables lead to certain additional costs, so the idea of reducing the number of queries seemed logical to us. One hundred transactions to write messages one by one is better to turn into one transaction to write one hundred messages at once. With queue masters, it is much easier to implement such batch processing (batching, batching).
Butching increases latency somewhat when performing operations. In exchange, throughput is greatly increased. With a batching, a single-queue queue can handle up to 30,000 requests per second.
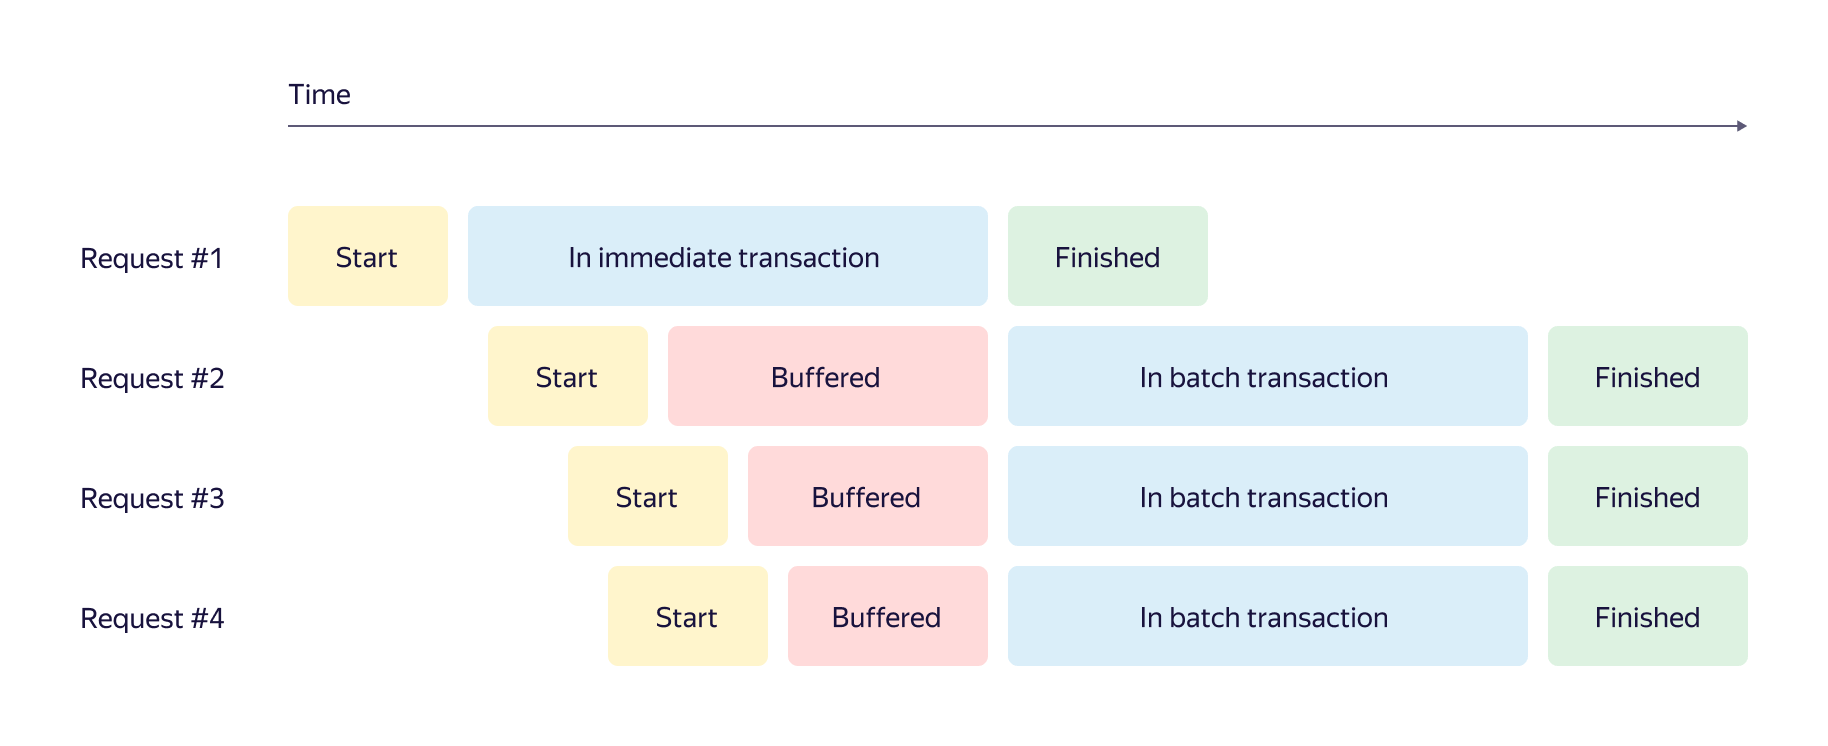
In general, the loading of queues is very different: and thousands of messages per second, and several messages per day. We needed to optimize work with queues using a flexible algorithm. Frontal options with the accumulation of messages in the buffer to a threshold number or reset by timer did not suit us. Therefore, we developed an adaptive batching algorithm for YMQ that works well in both cases. His work is shown in a timeline format.
Here, when a new message arrives, one of three scenarios is possible:
- A transaction starts instantly if there are no other transactions of this type running.
- If there are transactions running, the message is added to the buffer and waits for the completion of transactions.
- If the buffer size exceeds the threshold value, another parallel transaction is started. The number of concurrently running transactions is limited.
The idea of adaptive batching resembles Nagle ’s TCP / IP algorithm . And what is interesting: according to the results of load tests, we found out that adaptive batching reduces the latency of operations a little. The number of simultaneous transactions decreases, and with it the load on the tables. By the sum of factors, the solution with adaptive batching surpassed the first naive solution in all variants of scenarios.
What happens to the masters when problems arise
In Yandex Message Queue, as in any distributed system, emergencies may arise. Servers are denied, disks are inhibited, the network inside and between data centers is torn.
In such cases, YDB automatically transfers the affected tablets to a more suitable server within the cluster within a few seconds. YMQ queuing wizards are carried along with their pills.
Not in all cases it is possible to reliably determine the status of the server over the network, so there are situations when a new master is already running and the old one has not yet stopped working.
For YMQ, this is not a problem. Requests to the database do not make assumptions about the accuracy of the cache of visible messages and check each of them again during the process of hiding. Therefore, the existence of "extra" wizards only leads to a small temporary decrease in performance.
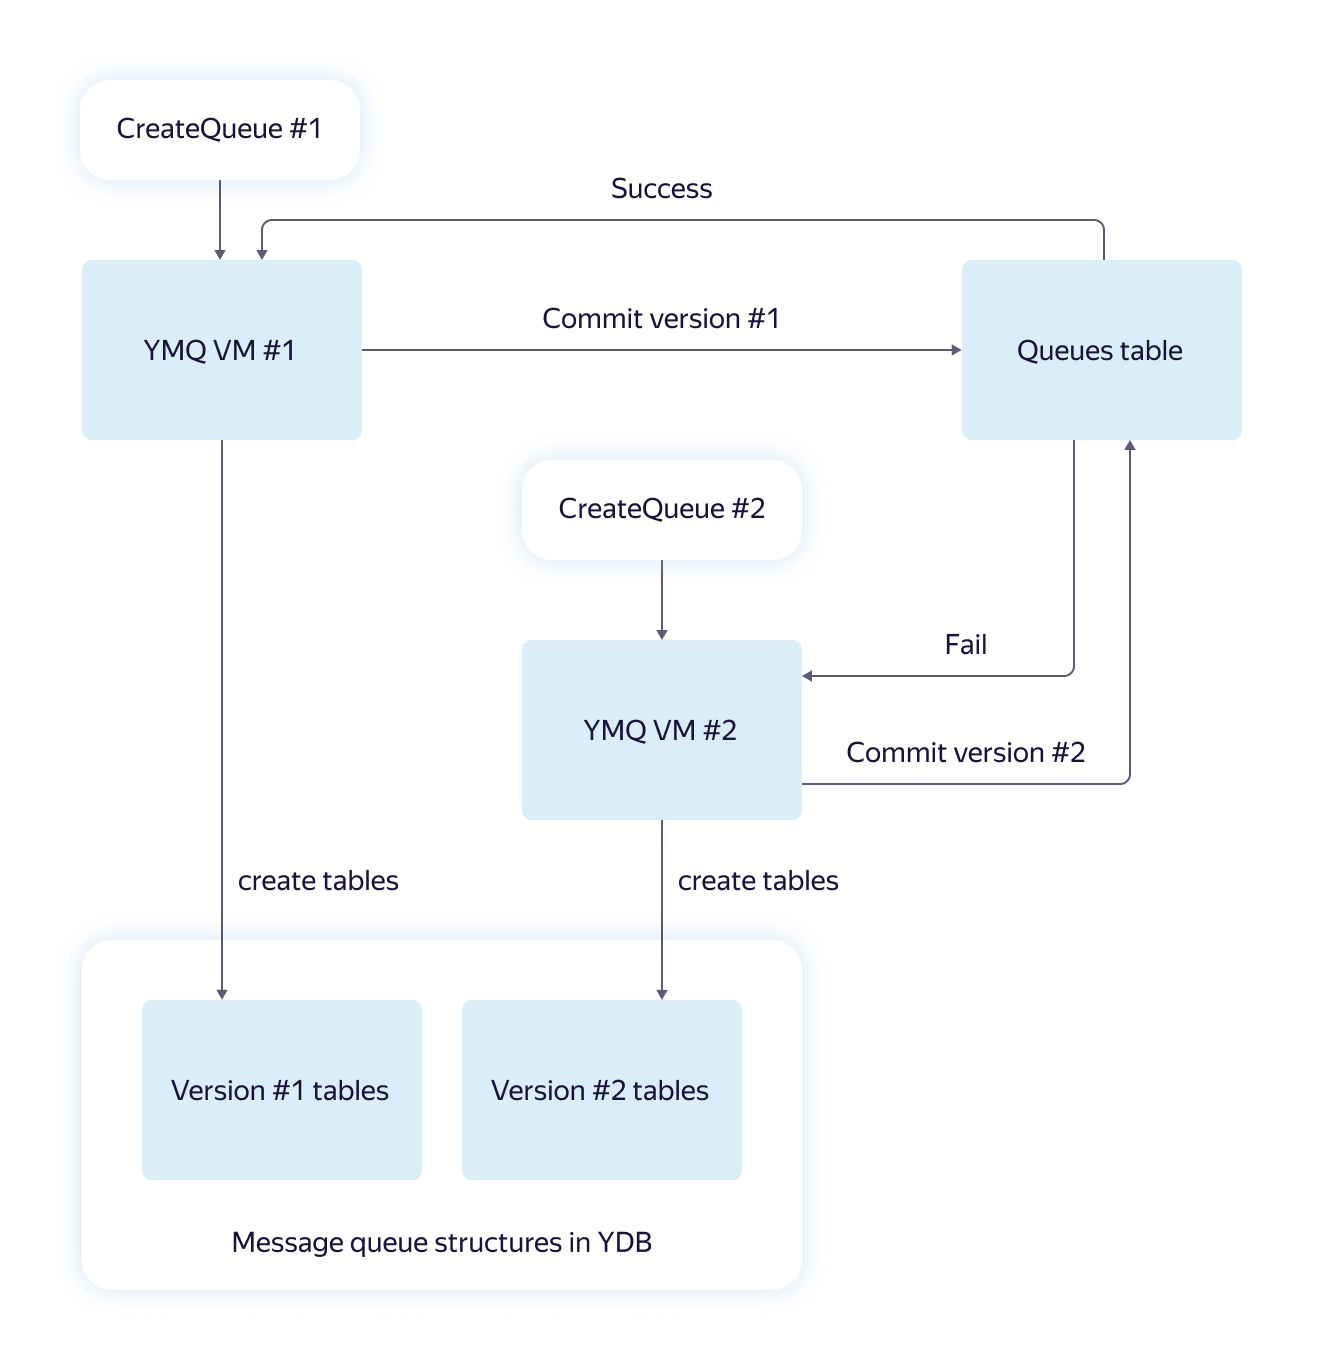
How we achieved resiliency when creating a queue
In YDB, it is impossible to create multiple tables and modify data in a single transaction. For us, this meant that a queue, which is physically a set of tables, cannot be created “transactionally”. When racing in parallel requests or in case of machine failures, you can get an inconsistent state from which it is impossible to get out without outside intervention. We thought and developed just such a scheme for solving the problem.
The basic idea is this: for each request for creating a queue, the necessary queue data structures are created in parallel and independently. Thus, versions are created that at the end are “committed” as a string to a special table. The winner version is chosen, and all the “losers” requests understand which version has “won” and return the correct link.
Such an algorithm in the “all or nothing” paradigm is resistant to failures due to the independence of the created structures and the presence of the final transaction with the commit version. If the commit is completed successfully, we can assume that the requested queue was created correctly.
How testing and monitoring is organized in Yandex Message Queue
Yandex Message Queue is a complex software and hardware complex. He has many possible points of failure. We must be confident in the quality of service that we provide. Therefore, we regularly test it.
- Unit tests verify the correctness of parsing requests, validation of parameters, attributes, and so on. These tests are as fast and focused as possible.
- Functional tests allow you to verify the full performance of the implemented API in different situations, normal and not so. Long enough, they are necessarily run after each change of the code in the repository.
- System tests do what a real user would do: they create and delete queues, set up the necessary parameters and then run a certain number of messages through them. Check that nothing is lost and has not changed. Also check the boundary values of the parameters and the correctness of the processing of incorrect behavior. Implemented using the boto library, working 24/7, including in the production cluster under the guise of an individual user.
- Load tests use the same code as the system tests , but they work with an increased frequency of requests and the number of messages. Repeatedly helped us find bottlenecks in architecture.
In addition to running the tests, it is important to monitor the state of production. To do this, we have various online checks and graphs with set thresholds and configured alerts. Alerts come on duty. Our daily team is involved in the daily duty.
First of all, we track:
- the number of errors with code 5xx, which ideally should not be at all;
- number of unsuccessful YDB transactions;
- CPU, disk, network, actor cluster system load;
- the correctness and performance of the model load, simulating the actions of a real user;
- operability of Yandex.Oblak virtual machines with our service and all related equipment.
All this helps us to ensure high reliability and availability of service through the efforts of a small team and concentrate on the development of the product.
Finally
The task of infrastructure teams in Yandex is to create and maintain reliable, scalable and productive solutions, based on which you can quickly and successfully launch new products that improve the lives of end users. Inside the company, our queue service proved its usefulness long ago and became part of the Yandex.Video, Yandex.Market, Yandex.Education, Yandex.Taxi and other services architecture.
Now it is available in the Yandex.Oblak ecosystem and can be used to build services inside and outside the Cloud itself. Now new users receive a cash grant for registration during registration, so you can try Yandex Message Queue for free.
Source: https://habr.com/ru/post/455642/
All Articles