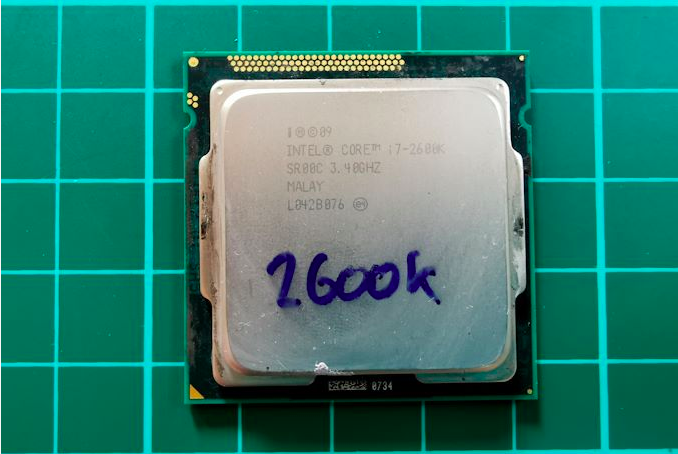
Legendary Intel Core i7-2600K: Sandy Bridge Testing in 2019 (Part 2)
Part 1 → Part 2 → Part 3
In accordance with our policy of testing the processor, we take a premium motherboard, with a suitable socket, and equip the system with enough memory that runs at the maximum frequency supported by the manufacturer. Testing is also performed, when possible, with JEDEC settings.
It is noted that some users dispute this approach, mentioning that sometimes the maximum supported frequency is rather low, or faster memory is available at a similar price, or that the use of supported frequencies may reduce performance. Although these comments make sense, in the end, very few consumers use memory profiles (XMP or others), as they require interaction with the BIOS, and most users refuse to support JEDEC speeds — this includes both home users and vendors who may want to reduce the margin for a couple of cents or stay within the limits set by the manufacturer. Where possible, we will extend testing to add faster memory modules, either in this review or later.
')

Thank you very much…
We should thank the companies listed below for the kindly provided equipment for our test benches. Some of this hardware is not included in this test system, but is used in other tests.

In order to keep up with the times, we have to update our software again. In updates, we usually use the latest operating system, the latest fixes, the latest software versions and graphics drivers, as well as add new tests or remove old ones. As regular readers know, our processor testing consists of a set of automated tests, and depending on how the latest software works, the package has to be changed: update or delete tests, or completely redo it. The last time we rewrote tests from scratch, it took most of the month, including regression testing (testing old processors).
One of the key elements of our update tests for 2018 (and 2019) of the year is the fact that our scripts and systems are prepared to protect against Specter and Meltdown. This means that our BIOS must be updated using the latest microcode, and all steps are performed on the operating system with security updates. In this case, we use Windows 10 x64 Enterprise 1709 with April security updates that mitigate the threat of Smeltdown (so we call two vulnerabilities in one word). Users may ask why we do not use Windows 10 x64 RS4, the latest major update. This is due to some new features that give mixed results. Instead of spending several weeks studying the possibility of disconnecting them, we will continue to work with RS3, which is now widely used.
Our previous set of benchmarks was divided into several segments, depending on what the test relates to and how it is perceived. Our new test suite follows the same rules, and we run tests based on:
Depending on the focus of the review, the order of these guidelines may change, and some of them may remain outside the scope of the review. All test results will be stored in our Bench database, which now has a new section "CPU 2019".
In each section, we will conduct the following tests:
Our power tests create the maximum workload for each thread in the system, and check the power registers on the chip to find out such details as the power consumption of the cores, the power of the entire chip, DRAM, the I / O unit, and the power of each core. The result depends on how much information the chip maker gives: sometimes really a lot, sometimes almost nothing.
We currently use POV-Ray as the main Power test, as it seems to penetrate deeply into the system and is very consistent. To limit the number of cores for testing, we use the command-line affinity mask.
These tests are performed with all turbo modes turned off in the system, forcing it to operate at the base frequency, and implement both the memory latency check (Intel Latency Checker works equally well for both platforms) and AIDA64 to check the throughput of the cache.
We recently automated about a dozen games with four different levels of performance. Most games will have data on the frame time, but due to difficulties with automation, not everyone has it. The idea is to get a good overview of a selection of different genres and testing engines. At the moment we have automated the following games:

CPU Gaming test suite we will use NVIDIA GTX 1080. For pure CPU testing we use the RX460, since now we have several devices for parallel testing.
In previous years, we tested several GPUs on a small number of games. This time, thanks to my Twitter survey, which gave a result of exactly 50:50, we do the opposite: more games, fewer graphics processors.
From time to time we get the same comment: automation is not the best way to test. There is a high barrier to entry, and this limits the ability to conduct tests. From our point of view, despite the fact that it takes time to properly program (and correctly write a test), automation allows the following advantages:
Our test software compares all the results, and sends all the data of the running tests to the central repository, and I can analyze the data as it arrives. This also acts as a manual check in case any data looks abnormal.
We have one main limitation, it concerns our game tests. We run several tests through a single Steam account, and some games (for example, GTA) are only available online. Since Steam allows one account to run the game on only one system, our game script checks the Steam API to determine whether we are “online” or not, and runs offline tests if the account is allowed to log in. Depending on the number of games that absolutely require an online mode, this need may be a bottleneck.
As always, we fulfill requests to use benchmarks. This helps us understand the workloads that users work with and plan their testing accordingly.
Note on software packages: we had requests for tests for software such as ANSYS or other professional-level software. The downside to testing this software is licensing and scaling. Most of these companies do not particularly care that we conduct tests, and state that this is not in their plans. Others, such as Agisoft, are more than willing to help. If you are a developer of these software packages, the best way to see how we use them is to give us a hand. We have special software versions for some tests, and if we can get something that works and is important for our audience, then it will be easy for us to add it to the test suite.
The “System Tests” section focuses on testing in real-world conditions faced by the consumer, with a slight bias in throughput. In this section, we consider application load time, image processing, simple physics, emulation, neural modeling, optimized computation, and the development of three-dimensional models using readily available and customizable software. Although some of the tests more simply overlap with the capabilities of large packages, such as PCMark, (we publish these values in the office test section), various perspectives are still worth considering. In all tests we will explain in detail what is being tested and how exactly we are testing.
All our test results can also be found on our Bench page.
One of the most important aspects of user experience and workflow is the speed of response of the system. A good test here is to check the application download time. Most programs nowadays, when stored on an SSD, load almost instantly, but some office tools require preloading of assets before they are ready to go. Most operating systems also use caching, so when certain software is loaded frequently (web browser, office tools), it can be initialized much faster.
In the previous test suite, we checked how long it would take to load a large PDF document in Adobe Acrobat. Unfortunately, this test was a nightmare in terms of programming, and refused to switch to Win10 RS3 without a fight. In the meantime, we discovered an application that can automate this test, and we decided to use GIMP, a popular and free photo editing application. It is an open source editor, and the main alternative to Adobe Photoshop. We configured it to load a large design pattern of 50 MB in size, and performed the load 10 times with an interval of 10 seconds between them. Because of the caching, the first 3-5 results are often slower than the rest, and the time for caching can be inconsistent, so we take the average of the last five results to show CPU processing with cached load.

Even overclocked, the 2600K can not reach the performance of 7700K, while the 9700K with a higher single-threaded frequency takes a decent first place.
FCAT software was developed to detect micro-sticking, dropped frames, and run graphic tests when two video cards are combined to render the scene. Because of the game engines and graphics drivers, not all GPU combinations worked perfectly, with the result that the software captured colors for each rendered frame and dynamically produced RAW data recording using a video capture device.

FCAT software takes recorded video, in our case it is 90 seconds 1440p of Rise of the Tomb Raider game, and converts color data to frame time data, so the system can display the “observed” frame rate and correlate with the power consumption of video accelerators. This test, because of how quickly it was compiled, is single-threaded. We start the process and get the completion time as a result.

FCAT is another single-threaded test, so we see the same differences in performance: the overclocked 2600K cannot quite match the stock 7700K, and 9700K takes the lead.
Our 3DPM test is a custom benchmark designed to simulate six different algorithms for the movement of particles in three-dimensional space. The algorithms were developed as part of my PhD thesis and, ultimately, work best on the GPU, and give a good idea of how command flows are interpreted by different micro-architectures.
The key part of the algorithms is the generation of random numbers — we use relatively fast generation, which completes the implementation of dependency chains in the code. The main update compared with the primitive first version of this code - the problem of False Sharing in the caches was solved, which was the main bottleneck. We are also considering using the AVX2 and AVX512 versions of this test for future reviews.
For this test, we launch the stock set of particles using six different algorithms, within 20 seconds, with 10-second pauses, and report the total speed of movement of the particles in millions of operations (movements) per second.
3DPM v2.1 can be downloaded from our server: 3DPMv2.1.rar (13.0 MB)


Since the 2600K does not have an AVX2, it lags far behind the 7700K / 9700K when the program is optimized for new instructions.
One of the most popular requested tests in our package is console emulation. The ability to select a game from an outdated system and run it is very attractive, and depends on the efforts of the emulator: it takes a much more powerful x86 system to be able to accurately emulate an old console, different from x86. Especially if the code for this console was made taking into account some physical flaws and equipment bugs.
For our test, we use the popular Dolphin emulation software, and run a computational project through it to determine how accurately our processors can emulate a console. In this test, work under the Nintendo Wii emulation will last about 1050 seconds.
The latest version of Dolphin can be downloaded here.

Dolphin achieved significant results in the Haswell / Broadwell era, leading to an incredible increase in performance from 2600K to 7700K. Unfortunately, for various reasons, the overclocked processor failed this test.
This benchmark was originally designed to model and visualize the activity of neurons and synapses in the brain. The software comes with various preset modes, and we chose a small benchmark that performs brain simulation from 32 thousand neurons / 1.8 billion synapses, which is equivalent to the brain of a sea slug.
We report the test results as an opportunity to emulate data in real time, so any results above the “one” are suitable for working in real time. Of the two modes, the mode “without launching synapses”, which is heavy for DRAM, and the mode “with launching synapses”, in which the processor is loaded, we choose the latter. Despite our choices, the test still affects the speed of DRAM.
DigiCortex can be downloaded here.

For tests related to memory, we ran the systems at their supported frequencies defined by Intel, with the exception of the “overclocked” system, which fairly received significant acceleration from DDR3-1333 to DDR3-2400. The results show an increase in performance, but even the default 7700K is faster. And the transition to 9700K shows performance gains due to additional cores.
I once heard of y-Cruncher as a tool to help calculate various mathematical constants. But after I started talking to his developer, Alex Yee, a NWU researcher and now a software optimization developer, I realized that he had optimized the software in an incredible way to get the best performance. Naturally, any simulation that takes 20+ days will benefit from a 1% performance boost! Alex started working with y-Cruncher as a project in high school, and now the project is up to date. Alex is constantly working on it to take advantage of the latest instruction sets, even before they are available at the hardware level.
For our test, we run y-Cruncher v0.7.6 through all possible optimized variants of binary, single-threaded and multi-threaded calculations, including binary files optimized for AVX-512. The test is to calculate 250 million characters of Pi, and we use single-threaded and multi-threaded versions of this test.
Users can download y-cruncher from Alex’s site

y-cruncher is another benchmark that uses as many AVX features as possible to speed up, demonstrating that modern Sandy Bridge descendants have additional advantages.
One of the ISVs we have been working with for several years is Agisoft. The campaign is developing software called PhotoScan, which converts a series of 2D images into a 3D model. It is an important tool in the development and archiving of models, and relies on a number of single-threaded and multi-threaded algorithms to move from one side of the calculation to the other.

In our test, we take version 1.3.3 of the software with a large data set — photographs 84 x 18 megapixels. We run the test on a fairly quick set of algorithms, but still more stringent than our 2017 test. As a result, we report the total time to complete the process.
The Agisoft Photoscan website can be found here.

Since this is a test with variable multithreading, overclocking 2600K gives a significant performance boost compared to the stock version. However, the default 7700K makes another jump of almost the same size. And 9700K, due to the large number of cores, just laughs at the rest of the chips in this comparison.
In a professional environment, rendering is often the main workload of the processor. It is used in various formats: from 3D rendering to rasterization, in such tasks as games or ray tracing, and uses the ability of software to manage meshes, textures, collisions, aliases, and physics (in animation). Most renderers offer code for the CPU, while some of them use graphics processors and choose environments that use FPGA or specialized ASICs. However, for large studios, processors are still the main hardware.
All our test results can also be found on our Bench page.
Improved performance optimizer for software such as 3ds Max and Cinema 4D, Corona test renders the generated scene of standard version 1.3. Typically, a benchmark GUI implementation shows the scene building process, and allows the user to see the result as “time to complete.”
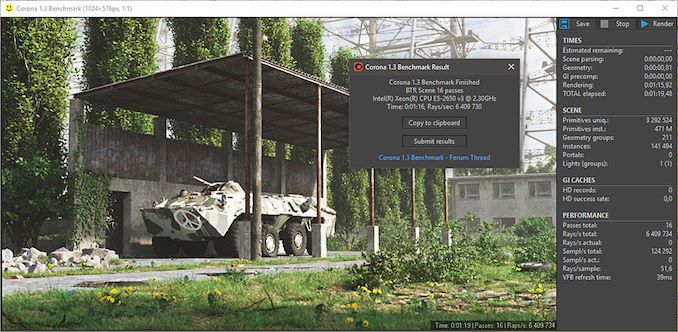
We contacted the developer who gave us the command line version of the test, which provides a direct output of the results. Instead of reporting the scene construction time, we report the average number of rays per second over six runs, since the ratio of actions performed to units of time is visually easier to understand.

We see a noticeable difference in performance between the 7700K and 2600K due to the micro-architecture updates and frequency, but overclocking the 2600K only halves this gap.
A high-end rendering tool, Blender is an open source product with many settings and configurations used by many high-end animation studios around the world. The organization recently released the Blender test suite, a couple of weeks after we decided to reduce the use of the Blender test in our new package, but the new test may take more than an hour. To get our results, we launch one of the subtests in this package via the command line - the standard bmw27 scene in the “CPU only” mode, and measure the rendering completion time.
Blender can be downloaded at .

We see the same picture with the Blender test: overclocking only halves the performance gap between 2600K and stock 7700K. Add overclocking to 7700K, and this gap will be wider.
As stated above, there are many different ways to handle rendering data: CPU, GPU, Accelerator, and others. In addition, there are many frameworks and APIs in which to program, depending on how the software is used. LuxMark, a benchmark designed using the LuxRender mechanism, offers several different scenes and an API.
In our test, we run a simple “Ball” scene on C ++ and OpenCL code, but in CPU mode. This scene begins with a rough rendering and slowly improves the quality over two minutes, giving the final result in an indicator that can be called "the average number of thousands of rays per second."

POV-Ray 3.7.1: ray tracing
The Persistence of Vision ray tracing engine is another well-known benchmarking tool that was dormant for a while until AMD released its Zen processors when suddenly both Intel and AMD started pushing code into the main branch of the open source project. For our test, we use the built-in test for all cores, called from the command line.
POV-Ray can be downloaded here.

POV-Ray stands out from previous tests, and shows the role that AVX2 plays in modern processors. POV-Ray also prefers cores rather than streams, so having eight real cores gives 9700K a good advantage.
The Office Test Suite is designed to focus on more industry standard benchmarks that focus on office workflows. These are more synthetic tests, but we also check the compiler performance in this section. For users who need to evaluate the equipment as a whole, these are usually the most important criteria that should be taken into account.
All our test results can also be found on our Bench page.
Futuremark, now known as UL, has been developing tests that have become industry standards for two decades. The latest system test suite is PCMark 10, where several tests have been improved compared to PCMark 8, and more attention has been paid to OpenCL, specifically in such cases as video streaming.
PCMark splits its assessments into approximately 14 different areas, including application launch, web pages, spreadsheets, photo editing, rendering, video conferencing and physics. We publish all these data in our Bench database, but the key indicator for the current review is the overall score.

, PCMark, , , , 9700K . 7700K 2600K 17%, 5% . , , 7700K 2600K: 5% . , .
AnandTech — -, , . Linux «» , , — Windows Chrome, , Chrome 56 2017 , , . Google , Windows, 400 000 .
, Google, MSVC, ninja . , , DRAM, . , , — , , .

9700K SMT, , 2600K 7700K 2600K. , 7700K .
PCMark 3DMark, Futuremark (UL) – . , , , , . , , Ice Storm, Cloud Gate, Sky Diver, Fire Strike Time Spy.

, Ice Storm Unlimited, , Fire Strike Ultra, 4K . , Time Spy AVX-512 ( ).


, Bench , : Ice Storm Unlimited, Cloud Gate, Sky Diver, Fire Strike Ultra Time Spy,
, Mac, GeekBench 4 — , . , , , , n-, , HTML.
, . - , ( ).
(Crypto, Integer, Floating Point, Memory) , .

, , . , , , , , , . , , .
Bench.
, Handbrake — , , , . . , AVX-512 OpenCL . , , CPU, .
Handbrake , - Logitech C920 1080p60 ( , ). . :

/ 7-zip , . , . .
, : , . , , Windows Scheduler . , .
, , - , , . .

, WinRAR. . , right-click Windows . , , 30 60- 2000 -, .
WinRAR , , 10 , , .

WinRAR - 2600K 7700K. , , , , 7700K. , 9700K , DRAM.
, , . Windows BitLocker . AES discontinued TrueCrypt , .

, , — AES / , . AES , AVX-512.
low-end , small form factor , -, , . - , , - . , ( ) . , - : -, , . - , , , .
, .
Bench.
, XPRT, Principled Technologies, -, , , «3». ( , ) : , , , , HTML5, , .
, . , .
WebXPRT

WebXPRT — 2015 , - , , , . - , , - , . - . , , , . — , . « », .

WebXPRT3, , . , .
- — Speedometer 2, javascript, : , , . , , , -.

«rpm», . .
- , , — Octane Google. 2.0 , , , , , — .

, . .
Even older than Octane, in front of us is Kraken, this time developed by Mozilla. This is an old test that performs relatively monotonous computational mechanics, such as sound processing or image filtering. It seems that Kraken produces a very unstable result, depending on the browser version, since this test is highly optimized.

The main benchmark passes through each of the subtests ten times, and returns the average completion time for each cycle in milliseconds. We run a full benchmark four times, and measure the average result.
The first “inherited” test in the package is the first version of our 3DPM test. This is the ultimate native version of the code, as if it were written by a scientist without knowledge of how computer equipment, compilers, or optimization work (as it was at the very beginning). The test is a large amount of scientific modeling in the wild, where getting an answer is more important than the speed of calculations (getting a result in 4 days is acceptable if it is correct; a year learns to program and getting a result in 5 minutes is not acceptable).
In this version, the only real optimization was in the compiler flags (-O2, -fp: fast): compile into release mode and enable OpenMP in the main calculation cycles. The cycles were not adjusted to the size of the functions, and the most serious slowdown is false sharing in the cache. The code also has long chains of dependencies based on random number generation, which leads to a decrease in performance on some computational micro-architectures.
3DPM v1 as well as 3DPM v2 can be downloaded here: 3DPMv2.1.rar (13.0 MB)

This transcoding test is very old; it was used by Anandtech in the days of the Pentium 4 and Athlon II processors. In it, standardized 720p video is recoded with double conversion, and the benchmark shows frames per second of each pass. The test is single-threaded, and in some architectures we run into the IPC constraint, instructions-per-clock.

Thank you for staying with us. Do you like our articles? Want to see more interesting materials? Support us by placing an order or recommending to friends, 30% discount for Habr's users on a unique analogue of the entry-level servers that we invented for you: The Truth About VPS (KVM) E5-2650 v4 (6 Cores) 10GB DDR4 240GB SSD 1Gbps $ 20 or how to share the server? (Options are available with RAID1 and RAID10, up to 24 cores and up to 40GB DDR4).
Dell R730xd 2 times cheaper? Only we have 2 x Intel TetraDeca-Core Xeon 2x E5-2697v3 2.6GHz 14C 64GB DDR4 4x960GB SSD 1Gbps 100 TV from $ 199 in the Netherlands! Dell R420 - 2x E5-2430 2.2Ghz 6C 128GB DDR3 2x960GB SSD 1Gbps 100TB - from $ 99! Read about How to build an infrastructure building. class c using servers Dell R730xd E5-2650 v4 worth 9000 euros for a penny?
Testing Equipment
In accordance with our policy of testing the processor, we take a premium motherboard, with a suitable socket, and equip the system with enough memory that runs at the maximum frequency supported by the manufacturer. Testing is also performed, when possible, with JEDEC settings.
It is noted that some users dispute this approach, mentioning that sometimes the maximum supported frequency is rather low, or faster memory is available at a similar price, or that the use of supported frequencies may reduce performance. Although these comments make sense, in the end, very few consumers use memory profiles (XMP or others), as they require interaction with the BIOS, and most users refuse to support JEDEC speeds — this includes both home users and vendors who may want to reduce the margin for a couple of cents or stay within the limits set by the manufacturer. Where possible, we will extend testing to add faster memory modules, either in this review or later.
')
Thank you very much…
We should thank the companies listed below for the kindly provided equipment for our test benches. Some of this hardware is not included in this test system, but is used in other tests.
Our new test suite for 2019 and 2020:
Hardened Specter and Meltdown
In order to keep up with the times, we have to update our software again. In updates, we usually use the latest operating system, the latest fixes, the latest software versions and graphics drivers, as well as add new tests or remove old ones. As regular readers know, our processor testing consists of a set of automated tests, and depending on how the latest software works, the package has to be changed: update or delete tests, or completely redo it. The last time we rewrote tests from scratch, it took most of the month, including regression testing (testing old processors).
One of the key elements of our update tests for 2018 (and 2019) of the year is the fact that our scripts and systems are prepared to protect against Specter and Meltdown. This means that our BIOS must be updated using the latest microcode, and all steps are performed on the operating system with security updates. In this case, we use Windows 10 x64 Enterprise 1709 with April security updates that mitigate the threat of Smeltdown (so we call two vulnerabilities in one word). Users may ask why we do not use Windows 10 x64 RS4, the latest major update. This is due to some new features that give mixed results. Instead of spending several weeks studying the possibility of disconnecting them, we will continue to work with RS3, which is now widely used.
Our previous set of benchmarks was divided into several segments, depending on what the test relates to and how it is perceived. Our new test suite follows the same rules, and we run tests based on:
- Power
- Memory
- Office
- System
- Render
- Encoding
- Web
- Legacy
- Integrated gaming
- CPU Gaming
Depending on the focus of the review, the order of these guidelines may change, and some of them may remain outside the scope of the review. All test results will be stored in our Bench database, which now has a new section "CPU 2019".
In each section, we will conduct the following tests:
Power
Our power tests create the maximum workload for each thread in the system, and check the power registers on the chip to find out such details as the power consumption of the cores, the power of the entire chip, DRAM, the I / O unit, and the power of each core. The result depends on how much information the chip maker gives: sometimes really a lot, sometimes almost nothing.
We currently use POV-Ray as the main Power test, as it seems to penetrate deeply into the system and is very consistent. To limit the number of cores for testing, we use the command-line affinity mask.
Memory
These tests are performed with all turbo modes turned off in the system, forcing it to operate at the base frequency, and implement both the memory latency check (Intel Latency Checker works equally well for both platforms) and AIDA64 to check the throughput of the cache.
Office
- Chromium Compile: Windows VC ++ Compile of Chrome 56 (as in 2017)
- PCMark10: General data will be in the results of the review, and the results of the subtests can be seen in the Bench
- 3DMark Physics: We enter each Bench sub-test, but we report on the most important (new)
- GeekBench4: On Demand (New)
- SYSmark 2018: recently released BAPCo, we are currently working on adding it to our automatic test suite (new, not yet available)
System
- Application Download: GIMP 2.10.4 (New)
- FCAT: processing a 90-second recording of the ROTR 1440p (as in 2017)
- 3D Particle Movement: Particle distribution test (as in 2017) - and we also have versions for AVX2 and AVX512, which we will try to add later;
- Dolphin 5.0: Console simulator (as in 2017)
- DigiCortex: Sea Slug Brain Simulator (as in 2017)
- y-Cruncher v0.7.6: Calculate Pi with an optimized instruction set of new CPUs (new)
- Agisoft Photoscan 1.3.3: 2D Image to 3D Conversion Tool (Updated)
Render
- Corona 1.3: Rendering performance in 3dsMax, Cinema4D (as in 2017)
- Blender 2.79b: Rendering bmw27 to CPU (updated to 2.79b)
- LuxMark v3.1 C ++ and OpenCL: Testing various rendering code paths (as in 2017)
- POV-Ray 3.7.1: Built-in benchmark (updated)
- CineBench R15: Outdated Cinema4D test, most likely will remain in the Bench (the same as in 2017)
Encoding
- 7-zip 1805: built-in benchmark (updated to v1805)
- WinRAR 5.60b3: Compression test of the folder containing video and web files (updated to 5.60b3)
- AES Encryption: AES memory throughput. Somewhat outdated test. (left over 2017)
- Handbrake 1.1.0: The initial Logitech C920 1080p60 file is recoded into three formats, for streaming / storage:
- 720p60, x264, 6000 kbps CBR, Fast, High Profile
- 1080p60, x264, 3500 kbps CBR, Faster, Main Profile
- 1080p60, HEVC, 3500 kbps VBR, Fast, 2-Pass Main Profile
Web
- WebXPRT3: Latest WebXPRT test (updated)
- WebXPRT15: Similar to 3, but somewhat outdated. (left over 2017)
- Speedometer2: Javascript Framework test (new)
- Google Octane 2.0: Outdated but popular web test (left over from 2017)
- Mozilla Kraken 1.1: Outdated but popular web test (left over from 2017)
- Legacy (set has not changed since 2017)
- 3DPM v1: Old 3DPM version
- x264 HD 3.0: Old benchmark transcoding
- Cinebench R11.5 and R10: Representatives of Various Coding Methodologies
Integrated and cpu gaming
We recently automated about a dozen games with four different levels of performance. Most games will have data on the frame time, but due to difficulties with automation, not everyone has it. The idea is to get a good overview of a selection of different genres and testing engines. At the moment we have automated the following games:
CPU Gaming test suite we will use NVIDIA GTX 1080. For pure CPU testing we use the RX460, since now we have several devices for parallel testing.
In previous years, we tested several GPUs on a small number of games. This time, thanks to my Twitter survey, which gave a result of exactly 50:50, we do the opposite: more games, fewer graphics processors.
Scale Up vs Scale Out: the benefits of automation
From time to time we get the same comment: automation is not the best way to test. There is a high barrier to entry, and this limits the ability to conduct tests. From our point of view, despite the fact that it takes time to properly program (and correctly write a test), automation allows the following advantages:
- Ensures constant breaks between cooling tests, not random recovery times based on “if I look at the screen”;
- Allows us to simultaneously test multiple systems. I currently use five systems in my office (limited by the number of 4K monitors and free space), which means that we can check more equipment at the same time;
- We can leave tests to run at night, which helps a lot in time;
- With the right approach, adding new tests is very easy.
Our test software compares all the results, and sends all the data of the running tests to the central repository, and I can analyze the data as it arrives. This also acts as a manual check in case any data looks abnormal.
We have one main limitation, it concerns our game tests. We run several tests through a single Steam account, and some games (for example, GTA) are only available online. Since Steam allows one account to run the game on only one system, our game script checks the Steam API to determine whether we are “online” or not, and runs offline tests if the account is allowed to log in. Depending on the number of games that absolutely require an online mode, this need may be a bottleneck.
Benchmark Kit Updates
As always, we fulfill requests to use benchmarks. This helps us understand the workloads that users work with and plan their testing accordingly.
Note on software packages: we had requests for tests for software such as ANSYS or other professional-level software. The downside to testing this software is licensing and scaling. Most of these companies do not particularly care that we conduct tests, and state that this is not in their plans. Others, such as Agisoft, are more than willing to help. If you are a developer of these software packages, the best way to see how we use them is to give us a hand. We have special software versions for some tests, and if we can get something that works and is important for our audience, then it will be easy for us to add it to the test suite.
System tests
The “System Tests” section focuses on testing in real-world conditions faced by the consumer, with a slight bias in throughput. In this section, we consider application load time, image processing, simple physics, emulation, neural modeling, optimized computation, and the development of three-dimensional models using readily available and customizable software. Although some of the tests more simply overlap with the capabilities of large packages, such as PCMark, (we publish these values in the office test section), various perspectives are still worth considering. In all tests we will explain in detail what is being tested and how exactly we are testing.
All our test results can also be found on our Bench page.
Application Download: GIMP 2.10.4
One of the most important aspects of user experience and workflow is the speed of response of the system. A good test here is to check the application download time. Most programs nowadays, when stored on an SSD, load almost instantly, but some office tools require preloading of assets before they are ready to go. Most operating systems also use caching, so when certain software is loaded frequently (web browser, office tools), it can be initialized much faster.
In the previous test suite, we checked how long it would take to load a large PDF document in Adobe Acrobat. Unfortunately, this test was a nightmare in terms of programming, and refused to switch to Win10 RS3 without a fight. In the meantime, we discovered an application that can automate this test, and we decided to use GIMP, a popular and free photo editing application. It is an open source editor, and the main alternative to Adobe Photoshop. We configured it to load a large design pattern of 50 MB in size, and performed the load 10 times with an interval of 10 seconds between them. Because of the caching, the first 3-5 results are often slower than the rest, and the time for caching can be inconsistent, so we take the average of the last five results to show CPU processing with cached load.
Even overclocked, the 2600K can not reach the performance of 7700K, while the 9700K with a higher single-threaded frequency takes a decent first place.
FCAT: image processing
FCAT software was developed to detect micro-sticking, dropped frames, and run graphic tests when two video cards are combined to render the scene. Because of the game engines and graphics drivers, not all GPU combinations worked perfectly, with the result that the software captured colors for each rendered frame and dynamically produced RAW data recording using a video capture device.
FCAT software takes recorded video, in our case it is 90 seconds 1440p of Rise of the Tomb Raider game, and converts color data to frame time data, so the system can display the “observed” frame rate and correlate with the power consumption of video accelerators. This test, because of how quickly it was compiled, is single-threaded. We start the process and get the completion time as a result.
FCAT is another single-threaded test, so we see the same differences in performance: the overclocked 2600K cannot quite match the stock 7700K, and 9700K takes the lead.
3D Particle Movement v2.1: Brownian Motion
Our 3DPM test is a custom benchmark designed to simulate six different algorithms for the movement of particles in three-dimensional space. The algorithms were developed as part of my PhD thesis and, ultimately, work best on the GPU, and give a good idea of how command flows are interpreted by different micro-architectures.
The key part of the algorithms is the generation of random numbers — we use relatively fast generation, which completes the implementation of dependency chains in the code. The main update compared with the primitive first version of this code - the problem of False Sharing in the caches was solved, which was the main bottleneck. We are also considering using the AVX2 and AVX512 versions of this test for future reviews.
For this test, we launch the stock set of particles using six different algorithms, within 20 seconds, with 10-second pauses, and report the total speed of movement of the particles in millions of operations (movements) per second.
3DPM v2.1 can be downloaded from our server: 3DPMv2.1.rar (13.0 MB)
Since the 2600K does not have an AVX2, it lags far behind the 7700K / 9700K when the program is optimized for new instructions.
Dolphin 5.0: console emulation
One of the most popular requested tests in our package is console emulation. The ability to select a game from an outdated system and run it is very attractive, and depends on the efforts of the emulator: it takes a much more powerful x86 system to be able to accurately emulate an old console, different from x86. Especially if the code for this console was made taking into account some physical flaws and equipment bugs.
For our test, we use the popular Dolphin emulation software, and run a computational project through it to determine how accurately our processors can emulate a console. In this test, work under the Nintendo Wii emulation will last about 1050 seconds.
The latest version of Dolphin can be downloaded here.
Dolphin achieved significant results in the Haswell / Broadwell era, leading to an incredible increase in performance from 2600K to 7700K. Unfortunately, for various reasons, the overclocked processor failed this test.
DigiCortex 1.20: Modeling the Brain of a Sea Slug
This benchmark was originally designed to model and visualize the activity of neurons and synapses in the brain. The software comes with various preset modes, and we chose a small benchmark that performs brain simulation from 32 thousand neurons / 1.8 billion synapses, which is equivalent to the brain of a sea slug.
We report the test results as an opportunity to emulate data in real time, so any results above the “one” are suitable for working in real time. Of the two modes, the mode “without launching synapses”, which is heavy for DRAM, and the mode “with launching synapses”, in which the processor is loaded, we choose the latter. Despite our choices, the test still affects the speed of DRAM.
DigiCortex can be downloaded here.
For tests related to memory, we ran the systems at their supported frequencies defined by Intel, with the exception of the “overclocked” system, which fairly received significant acceleration from DDR3-1333 to DDR3-2400. The results show an increase in performance, but even the default 7700K is faster. And the transition to 9700K shows performance gains due to additional cores.
y-Cruncher v0.7.6: Calculations Optimized for Micro-Architecture
I once heard of y-Cruncher as a tool to help calculate various mathematical constants. But after I started talking to his developer, Alex Yee, a NWU researcher and now a software optimization developer, I realized that he had optimized the software in an incredible way to get the best performance. Naturally, any simulation that takes 20+ days will benefit from a 1% performance boost! Alex started working with y-Cruncher as a project in high school, and now the project is up to date. Alex is constantly working on it to take advantage of the latest instruction sets, even before they are available at the hardware level.
For our test, we run y-Cruncher v0.7.6 through all possible optimized variants of binary, single-threaded and multi-threaded calculations, including binary files optimized for AVX-512. The test is to calculate 250 million characters of Pi, and we use single-threaded and multi-threaded versions of this test.
Users can download y-cruncher from Alex’s site
y-cruncher is another benchmark that uses as many AVX features as possible to speed up, demonstrating that modern Sandy Bridge descendants have additional advantages.
Agisoft Photoscan 1.3.3: 2D image conversion to 3D model
One of the ISVs we have been working with for several years is Agisoft. The campaign is developing software called PhotoScan, which converts a series of 2D images into a 3D model. It is an important tool in the development and archiving of models, and relies on a number of single-threaded and multi-threaded algorithms to move from one side of the calculation to the other.
In our test, we take version 1.3.3 of the software with a large data set — photographs 84 x 18 megapixels. We run the test on a fairly quick set of algorithms, but still more stringent than our 2017 test. As a result, we report the total time to complete the process.
The Agisoft Photoscan website can be found here.
Since this is a test with variable multithreading, overclocking 2600K gives a significant performance boost compared to the stock version. However, the default 7700K makes another jump of almost the same size. And 9700K, due to the large number of cores, just laughs at the rest of the chips in this comparison.
Rendering Tests
In a professional environment, rendering is often the main workload of the processor. It is used in various formats: from 3D rendering to rasterization, in such tasks as games or ray tracing, and uses the ability of software to manage meshes, textures, collisions, aliases, and physics (in animation). Most renderers offer code for the CPU, while some of them use graphics processors and choose environments that use FPGA or specialized ASICs. However, for large studios, processors are still the main hardware.
All our test results can also be found on our Bench page.
Corona 1.3: Performance Render
Improved performance optimizer for software such as 3ds Max and Cinema 4D, Corona test renders the generated scene of standard version 1.3. Typically, a benchmark GUI implementation shows the scene building process, and allows the user to see the result as “time to complete.”
We contacted the developer who gave us the command line version of the test, which provides a direct output of the results. Instead of reporting the scene construction time, we report the average number of rays per second over six runs, since the ratio of actions performed to units of time is visually easier to understand.
We see a noticeable difference in performance between the 7700K and 2600K due to the micro-architecture updates and frequency, but overclocking the 2600K only halves this gap.
Blender 2.79b: 3D Creation Suite
A high-end rendering tool, Blender is an open source product with many settings and configurations used by many high-end animation studios around the world. The organization recently released the Blender test suite, a couple of weeks after we decided to reduce the use of the Blender test in our new package, but the new test may take more than an hour. To get our results, we launch one of the subtests in this package via the command line - the standard bmw27 scene in the “CPU only” mode, and measure the rendering completion time.
Blender can be downloaded at .
We see the same picture with the Blender test: overclocking only halves the performance gap between 2600K and stock 7700K. Add overclocking to 7700K, and this gap will be wider.
LuxMark v3.1: LuxRender via various code paths
As stated above, there are many different ways to handle rendering data: CPU, GPU, Accelerator, and others. In addition, there are many frameworks and APIs in which to program, depending on how the software is used. LuxMark, a benchmark designed using the LuxRender mechanism, offers several different scenes and an API.
In our test, we run a simple “Ball” scene on C ++ and OpenCL code, but in CPU mode. This scene begins with a rough rendering and slowly improves the quality over two minutes, giving the final result in an indicator that can be called "the average number of thousands of rays per second."
POV-Ray 3.7.1: ray tracing
The Persistence of Vision ray tracing engine is another well-known benchmarking tool that was dormant for a while until AMD released its Zen processors when suddenly both Intel and AMD started pushing code into the main branch of the open source project. For our test, we use the built-in test for all cores, called from the command line.
POV-Ray can be downloaded here.
POV-Ray stands out from previous tests, and shows the role that AVX2 plays in modern processors. POV-Ray also prefers cores rather than streams, so having eight real cores gives 9700K a good advantage.
Office tests
The Office Test Suite is designed to focus on more industry standard benchmarks that focus on office workflows. These are more synthetic tests, but we also check the compiler performance in this section. For users who need to evaluate the equipment as a whole, these are usually the most important criteria that should be taken into account.
All our test results can also be found on our Bench page.
PCMark 10: Industry Standard
Futuremark, now known as UL, has been developing tests that have become industry standards for two decades. The latest system test suite is PCMark 10, where several tests have been improved compared to PCMark 8, and more attention has been paid to OpenCL, specifically in such cases as video streaming.
PCMark splits its assessments into approximately 14 different areas, including application launch, web pages, spreadsheets, photo editing, rendering, video conferencing and physics. We publish all these data in our Bench database, but the key indicator for the current review is the overall score.
, PCMark, , , , 9700K . 7700K 2600K 17%, 5% . , , 7700K 2600K: 5% . , .
Chromium Compile: Windows VC ++ Chrome 56
AnandTech — -, , . Linux «» , , — Windows Chrome, , Chrome 56 2017 , , . Google , Windows, 400 000 .
, Google, MSVC, ninja . , , DRAM, . , , — , , .
9700K SMT, , 2600K 7700K 2600K. , 7700K .
3DMark Physics:
PCMark 3DMark, Futuremark (UL) – . , , , , . , , Ice Storm, Cloud Gate, Sky Diver, Fire Strike Time Spy.
, Ice Storm Unlimited, , Fire Strike Ultra, 4K . , Time Spy AVX-512 ( ).
, Bench , : Ice Storm Unlimited, Cloud Gate, Sky Diver, Fire Strike Ultra Time Spy,
GeekBench4:
, Mac, GeekBench 4 — , . , , , , n-, , HTML.
, . - , ( ).
(Crypto, Integer, Floating Point, Memory) , .
Encoding Tests
, , . , , , , , , . , , .
Bench.
Handbrake 1.1.0:
, Handbrake — , , , . . , AVX-512 OpenCL . , , CPU, .
Handbrake , - Logitech C920 1080p60 ( , ). . :
- 720p60 at 6000 kbps constant bit rate, fast setting, high profile
- 1080p60 at 3500 kbps constant bit rate, faster setting, main profile
- 1080p60 HEVC at 3500 kbps variable bit rate, fast setting, main profile
7-zip v1805:
/ 7-zip , . , . .
, : , . , , Windows Scheduler . , .
, , - , , . .
WinRAR 5.60b3:
, WinRAR. . , right-click Windows . , , 30 60- 2000 -, .
WinRAR , , 10 , , .
WinRAR - 2600K 7700K. , , , , 7700K. , 9700K , DRAM.
AES:
, , . Windows BitLocker . AES discontinued TrueCrypt , .
, , — AES / , . AES , AVX-512.
-
low-end , small form factor , -, , . - , , - . , ( ) . , - : -, , . - , , , .
, .
Bench.
WebXPRT 3: - ,
, XPRT, Principled Technologies, -, , , «3». ( , ) : , , , , HTML5, , .
, . , .
WebXPRT
WebXPRT 2015: HTML5 Javascript Web UX
WebXPRT — 2015 , - , , , . - , , - , . - . , , , . — , . « », .
WebXPRT3, , . , .
Speedometer 2: Javascript Frameworks
- — Speedometer 2, javascript, : , , . , , , -.
«rpm», . .
Google Octane 2.0: Core Web Compute
- , , — Octane Google. 2.0 , , , , , — .
, . .
Mozilla Kraken 1.1: Core Web Compute
Even older than Octane, in front of us is Kraken, this time developed by Mozilla. This is an old test that performs relatively monotonous computational mechanics, such as sound processing or image filtering. It seems that Kraken produces a very unstable result, depending on the browser version, since this test is highly optimized.
The main benchmark passes through each of the subtests ten times, and returns the average completion time for each cycle in milliseconds. We run a full benchmark four times, and measure the average result.
3DPM v1: Naïve Code Option 3DPM v2.1.
The first “inherited” test in the package is the first version of our 3DPM test. This is the ultimate native version of the code, as if it were written by a scientist without knowledge of how computer equipment, compilers, or optimization work (as it was at the very beginning). The test is a large amount of scientific modeling in the wild, where getting an answer is more important than the speed of calculations (getting a result in 4 days is acceptable if it is correct; a year learns to program and getting a result in 5 minutes is not acceptable).
In this version, the only real optimization was in the compiler flags (-O2, -fp: fast): compile into release mode and enable OpenMP in the main calculation cycles. The cycles were not adjusted to the size of the functions, and the most serious slowdown is false sharing in the cache. The code also has long chains of dependencies based on random number generation, which leads to a decrease in performance on some computational micro-architectures.
3DPM v1 as well as 3DPM v2 can be downloaded here: 3DPMv2.1.rar (13.0 MB)
x264 HD 3.0: outdated transcoding test
This transcoding test is very old; it was used by Anandtech in the days of the Pentium 4 and Athlon II processors. In it, standardized 720p video is recoded with double conversion, and the benchmark shows frames per second of each pass. The test is single-threaded, and in some architectures we run into the IPC constraint, instructions-per-clock.
Thank you for staying with us. Do you like our articles? Want to see more interesting materials? Support us by placing an order or recommending to friends, 30% discount for Habr's users on a unique analogue of the entry-level servers that we invented for you: The Truth About VPS (KVM) E5-2650 v4 (6 Cores) 10GB DDR4 240GB SSD 1Gbps $ 20 or how to share the server? (Options are available with RAID1 and RAID10, up to 24 cores and up to 40GB DDR4).
Dell R730xd 2 times cheaper? Only we have 2 x Intel TetraDeca-Core Xeon 2x E5-2697v3 2.6GHz 14C 64GB DDR4 4x960GB SSD 1Gbps 100 TV from $ 199 in the Netherlands! Dell R420 - 2x E5-2430 2.2Ghz 6C 128GB DDR3 2x960GB SSD 1Gbps 100TB - from $ 99! Read about How to build an infrastructure building. class c using servers Dell R730xd E5-2650 v4 worth 9000 euros for a penny?
Source: https://habr.com/ru/post/455622/
All Articles