How we broke the scoring model. Machine learning in microfinance
Hi, Habr! I work in a Devim team that develops a decision-making system for borrowers of loans. There was a sufficient amount of practical knowledge in this area, so I decided to share a part with you.
I'll tell you about the problems and how to solve them when developing scoring models. These examples may be of interest to professionals working in the field of lending and simply to readers of Habr who are interested in the features of development in machine learning / credit scoring projects.

Consider two scenarios:
')
So, here are some ways to break the scoring model.
It is necessary that a marketing department be created in the MFI. With the very frequent appearance of new credit products, changes in interest rates, marketing campaigns “first loan for free”, scoring models will not be able to adequately work for a long period.

In the database, you must create a field FIRSTLOAN with the comment "requested loan amount". When approving a loan, rewrite the value of this field with an amount that was ultimately approved.
He will convince everyone that the scoring bureau ball sucks. Prod stacking is good. Selection of hyperparameters and cool models - this is what you need to spend most of the time. And if you find gold seed, you can get a small increase in quality.
Let us examine in more detail each method.
Here is the main page of the site, where the client selects the amount and term of the loan. Pay attention to the number of tabs and the range of amounts on each tab.
After the first and second tabs were combined into one, part of the applications from the 2-10k range moved to the 11-20k range. For business it is good from the point of view of the average check.
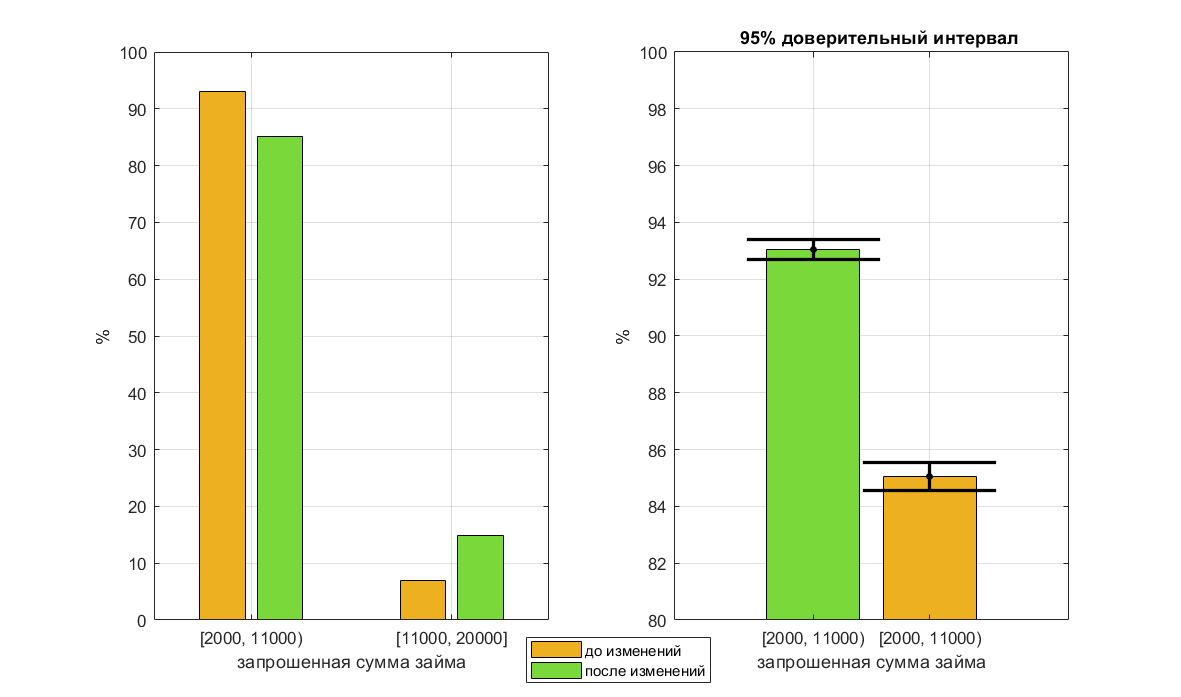
Distribution of requested amounts before and after changes
Right - large scale
According to historical data collected during the operation of the old version of the site, there is a linearly negative relationship between the requested loan amount and the probability of default. For customers who have requested a sum of 11-20k, the probability of no return is less. Even with manual underwriting, there is a higher level of approval. This confirms the hypothesis that borrowers who applied for from the second tab, on average, are better. For a trained model, this means that a request for a sum of 11-20k characterizes the borrower as good. However, after the tabs were merged, the level of approval for manual review of such applications decreased, and the probability of non-return increased. The model continued to consider such borrowers as good, which led to a decrease in the quality of scoring in this range. The solution to the problem was to rebuild the model on the same data, but without the sign "sum".
For loans, which managed to be issued by the old model on the new version of the site, analysis of model errors was carried out. Most of them were related to the fact that a borrower with a very bad credit history should have been refused, but having indicated the amount of 20,000, he received a “cheat” soon and received approval of a minimum amount of 2-3k.
The connection between the large amount requested and the low probability of no return is odd. There is an assumption that large sums are requested by people with higher income levels. And on a separate tab 11-20k (perhaps) people went who really needed just such a sum and they knew that they could repay it.
Let's look at how the value of the “amount” slider affects the distribution of the requested amounts. When entering the site, the value of the amount slider is set to 7000 p. - The picture on the left, 8000 p. - the picture on the right.
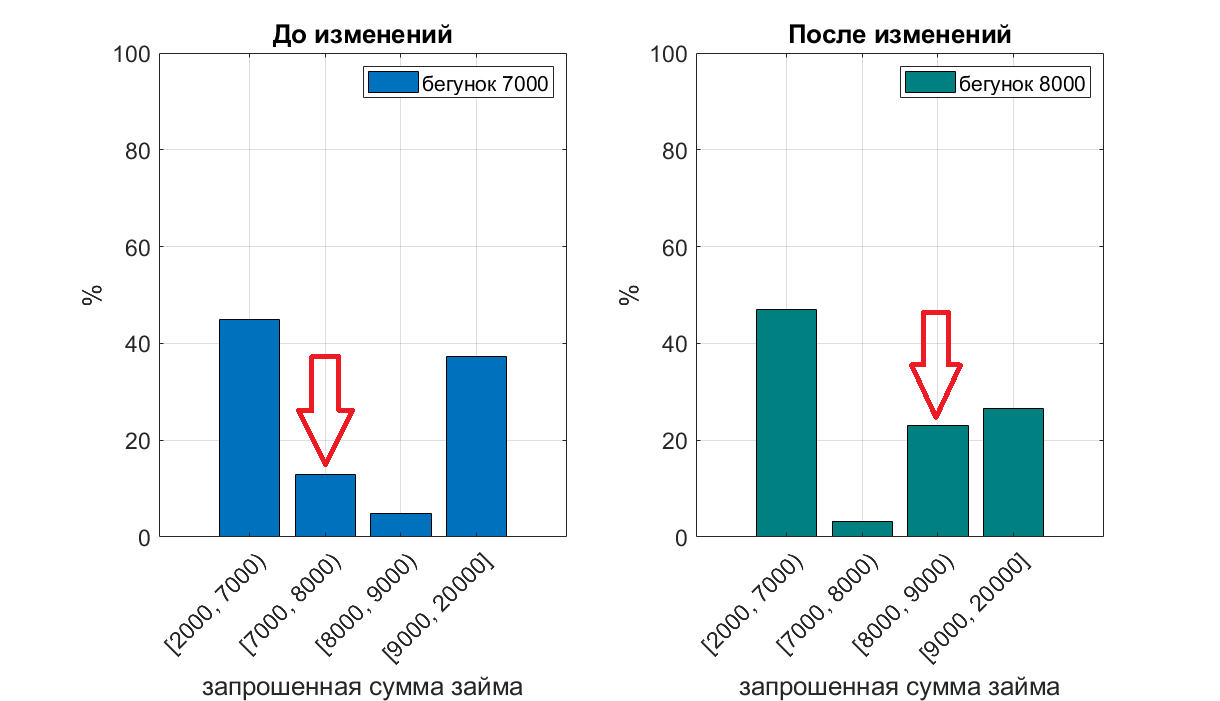
It can be seen that the number of requests for a loan of a certain amount (7k or 8k) greatly increases, if you set the default slider to this value.
If there is a relationship between the slider shift (the deliberate choice of the amount needed by the borrower) and the risk of non-return, a tree-based model will find this relationship in the data in the characteristic loan amount. Even without creating a special feature, “Does the selected amount match the slider's default value?” The algorithm creates the rule "if the amount is more than 6k, but less than 8k - the borrower is bad." In case of changing the default value of the slider on the site, this rule will not work correctly. The solution to the problem is to refuse to use this feature, or to create an additional feature - “does the selected amount match the slider's default value”.
When analyzing a new model that does not use the “loan amount” feature, we constructed the dependence of the average rate on the loan amount.
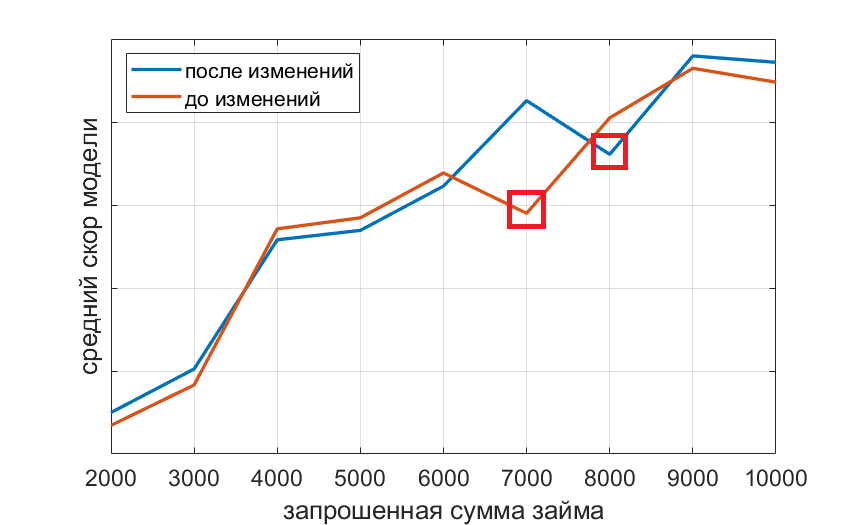
The model, not knowing what the default value of the slider is set on the site, and not using the sign of the requested loan amount, still assigns to borrowers who do not move the slider, less quickly, relying on other signs. This interesting finding allows us to argue that the choice of the amount and term of the loan by default is a sign of a bad borrower.
When applying for a loan, a paid inquiry is sent to the credit bureau. The response contains detailed information on how the customer paid other loans, whether there were delays, size, type of loans, etc. Quite often, clients take a loan to an MFI more than once. When you contact the bureau again, a request is also sent, since The borrower's financial position may have changed. The database architect, underwriters, and other individuals who work with credit history in any way decide that it’s not worthwhile to keep a credit history of previous applications. it takes up space on the hard drive, and no one will watch it. Create two tables ORDERS and CLIENTS. The order data is written to ORDERS, and the client is written to CLIENTS. KI is placed in the table CLIENTS. With each new circulation, the CI is overwritten. For a datasaentist, this means that he receives an offset sample for learning. In the database are KI about customers who either took a loan once and did not return. Or they took it once and did not become regular customers. Information about the first application of the most valuable customers who have become permanent is not available.
The situation with the questionnaire data is similar. The CLIENTS table stores information about income, marital status, place of work, etc. These data are also overwritten. However, a person’s income and marital status, as is known, may change over time.
When applying for a loan, the client fills out a questionnaire in which he indicates his monthly income. Let's look at how the distribution of income values depends on the application channel. On x - application id, on y - income.
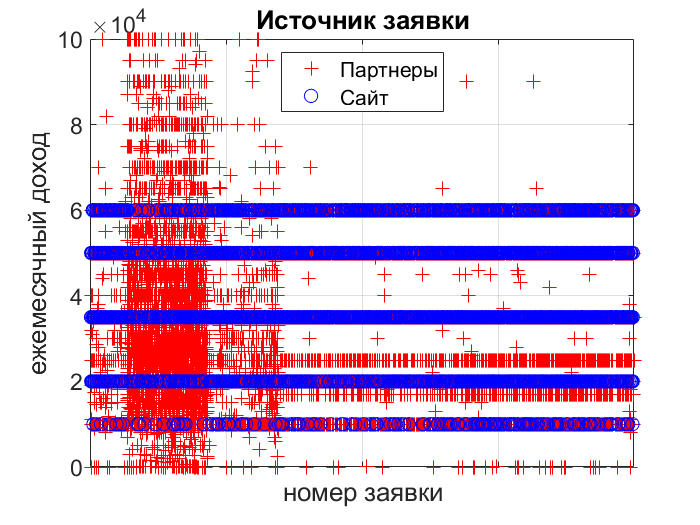
The site has a drop-down list. And when the application comes from the affiliate network, the field can be filled with an arbitrary value. A similar situation occurs when filling out the application in the offline - office. If you do not notice this fact when developing a scoring model, the model will estimate the probability of no return using the “revenue” attribute depending on the ratio of the given partners / site / offline channels in the training set. The solution to the problem is not to use the sign “income”. Either do a discretization of the characteristic value for the channel “partners” and “offline” at the same intervals as indicated on the site (which is not very good, since the input method is different). Or do the input field on the site and wait for the accumulated data.
There are several products in the company:
PDL loans - loans in the amount of 2 to 20k, which need to be closed in one payment.
Installment loans - loans in the amount of 21 to 100k. At the moment when the client makes an application, depending on whether the client is new or repeated, on the region and other factors, marketing determines which product he can and should be given. Product parameters include minimum / maximum loan amounts and terms. Initially, the product definition was carried out after scoring. Those. In the scoring model the amounts and the period specified by the client were submitted. At some point, the definition of the product began to occur before scoring. And the data specified by the client were automatically replaced by the "necessary" ones and were scored. This has led to a deterioration in the quality of scoring. The solution to the problem is a return to the previous logic of product definition.
The data analyst wants to use the “loan target” text box as a sign. Uploads data, groups loan goals into categories. Analyzes the percentage of bad in each category. The percentage of bad, or WOE - the logarithm of the ratio of good to bad.

Analysis of the level of overdue (the number of unpaid loans divided by the number of loans issued) for each category. However, the data for which the analysis was carried out include online and offline applications.
The procedure for filling the questionnaire offline is significantly different, because The questionnaire is filled in by the office manager according to the client, or the client with the prompts of the manager
Let's see what the frequency distribution of the loan target looks like in online / offline sections.

Online customers do not fill out the purpose of the loan. Taking into account the fact that the ratio of applications towards online is constantly growing, it is possible to use a sign only after setting the field “loan target” for the mandatory and additional data collection cycle.
Let's return to the sign "loan amount". The data analyst decides to use the loan amount from the loan application. An algorithm based on decision trees (random forest / gradient boosting) was chosen as the method. After the first experiments with models on the schedule feature importances, it turned out that the “loan amount” sign is the strongest. Intuitively stronger signs did not reach the top. After analyzing the possible causes, it was found that the “loan amount” field is overwritten after the loan is approved. This happens in cases where a loan officer approves a smaller and “uneven” loan amount. Thus, data leak in the data crept in, which is so common in data analysis competitions. The solution to the problem is an additional field in the database in which the initially specified amount is written.
But that's not all. Let's look at the frequency of “uneven” loan amounts depending on the application channel.
Applications coming from partners have uneven amounts. What in our case creates illogical connections in the tree and makes the model less resistant to the emergence of new channels of applications. The problem is aggravated by the fact that in the flow of applications the percentage of partnership in some periods can reach 80-90%. In this case, the problem is solved by abandoning the use of the feature or by discretization up to 1000 r or more.
Leaking data from the future
When filling out the questionnaire, the client may not fill in the optional fields. If the underwriter sees that the credit history is good and you can approve the loan, he can insure and further clarify by phone the data that the client has not filled out. As a result, datasainist works with a training kit, in which good clients usually have the most complete and complete questionnaire. In this case, the signs of the type “filled in the optional field X” will be strong and will characterize the borrower as good. However, in the mode of automatic scoring for good clients, these fields will be blank. In the best case, it will result in an overestimation of the quality of the model during offline validation. At worst, the quality of the model is lower compared to the option not to use these features. The solution to the problem is to work more closely with the underwriting department. Monitoring, analysis and improvement of the data collection process.
All of these problems formed the basis of a system for monitoring data quality and sustainability of scoring models.
In conclusion, I would like to give a few recommendations to specialists who dare to build scoring models.
I hope the examples described in the article will be useful. They are based on combat experience and real disbursement of loans in large volumes over a long period.
Dmitry Gorelov, Devim
I'll tell you about the problems and how to solve them when developing scoring models. These examples may be of interest to professionals working in the field of lending and simply to readers of Habr who are interested in the features of development in machine learning / credit scoring projects.
Consider two scenarios:
')
- You already have a scoring model and you want to break it.
- You know that soon the company will want to develop its scoring model and in no case can this be allowed.
So, here are some ways to break the scoring model.
Scenario 1
Method number 1 - make changes to the site
- Change the design of the loan amount and maturity page
- Change the default value of the loan amount / term when entering the site
Method number 2 - create a marketing department
It is necessary that a marketing department be created in the MFI. With the very frequent appearance of new credit products, changes in interest rates, marketing campaigns “first loan for free”, scoring models will not be able to adequately work for a long period.
Scenario 2
Method number 3 - destroy data (preferably paid)
- Retrace customer’s credit history data from previous downloads
- Retrace client data from previous downloads
Method # 4 - make a different data entry interface in different application channels and devices (online, offline, Android, Iphone)
Method # 5 - add a script to populate the database field and do not document it.
In the database, you must create a field FIRSTLOAN with the comment "requested loan amount". When approving a loan, rewrite the value of this field with an amount that was ultimately approved.
Method # 6 - Hire a Data Science Specialist
He will convince everyone that the scoring bureau ball sucks. Prod stacking is good. Selection of hyperparameters and cool models - this is what you need to spend most of the time. And if you find gold seed, you can get a small increase in quality.
Let us examine in more detail each method.
Design page selection amount and term of the loan
Here is the main page of the site, where the client selects the amount and term of the loan. Pay attention to the number of tabs and the range of amounts on each tab.
| Before the changes | After change |
 |  |
After the first and second tabs were combined into one, part of the applications from the 2-10k range moved to the 11-20k range. For business it is good from the point of view of the average check.
Distribution of requested amounts before and after changes
Right - large scale
According to historical data collected during the operation of the old version of the site, there is a linearly negative relationship between the requested loan amount and the probability of default. For customers who have requested a sum of 11-20k, the probability of no return is less. Even with manual underwriting, there is a higher level of approval. This confirms the hypothesis that borrowers who applied for from the second tab, on average, are better. For a trained model, this means that a request for a sum of 11-20k characterizes the borrower as good. However, after the tabs were merged, the level of approval for manual review of such applications decreased, and the probability of non-return increased. The model continued to consider such borrowers as good, which led to a decrease in the quality of scoring in this range. The solution to the problem was to rebuild the model on the same data, but without the sign "sum".
For loans, which managed to be issued by the old model on the new version of the site, analysis of model errors was carried out. Most of them were related to the fact that a borrower with a very bad credit history should have been refused, but having indicated the amount of 20,000, he received a “cheat” soon and received approval of a minimum amount of 2-3k.
The connection between the large amount requested and the low probability of no return is odd. There is an assumption that large sums are requested by people with higher income levels. And on a separate tab 11-20k (perhaps) people went who really needed just such a sum and they knew that they could repay it.
The default value of the amount / term of the loan when entering the site
Let's look at how the value of the “amount” slider affects the distribution of the requested amounts. When entering the site, the value of the amount slider is set to 7000 p. - The picture on the left, 8000 p. - the picture on the right.
It can be seen that the number of requests for a loan of a certain amount (7k or 8k) greatly increases, if you set the default slider to this value.
If there is a relationship between the slider shift (the deliberate choice of the amount needed by the borrower) and the risk of non-return, a tree-based model will find this relationship in the data in the characteristic loan amount. Even without creating a special feature, “Does the selected amount match the slider's default value?” The algorithm creates the rule "if the amount is more than 6k, but less than 8k - the borrower is bad." In case of changing the default value of the slider on the site, this rule will not work correctly. The solution to the problem is to refuse to use this feature, or to create an additional feature - “does the selected amount match the slider's default value”.
When analyzing a new model that does not use the “loan amount” feature, we constructed the dependence of the average rate on the loan amount.
The model, not knowing what the default value of the slider is set on the site, and not using the sign of the requested loan amount, still assigns to borrowers who do not move the slider, less quickly, relying on other signs. This interesting finding allows us to argue that the choice of the amount and term of the loan by default is a sign of a bad borrower.
Retrace customer credit history data
When applying for a loan, a paid inquiry is sent to the credit bureau. The response contains detailed information on how the customer paid other loans, whether there were delays, size, type of loans, etc. Quite often, clients take a loan to an MFI more than once. When you contact the bureau again, a request is also sent, since The borrower's financial position may have changed. The database architect, underwriters, and other individuals who work with credit history in any way decide that it’s not worthwhile to keep a credit history of previous applications. it takes up space on the hard drive, and no one will watch it. Create two tables ORDERS and CLIENTS. The order data is written to ORDERS, and the client is written to CLIENTS. KI is placed in the table CLIENTS. With each new circulation, the CI is overwritten. For a datasaentist, this means that he receives an offset sample for learning. In the database are KI about customers who either took a loan once and did not return. Or they took it once and did not become regular customers. Information about the first application of the most valuable customers who have become permanent is not available.
The situation with the questionnaire data is similar. The CLIENTS table stores information about income, marital status, place of work, etc. These data are also overwritten. However, a person’s income and marital status, as is known, may change over time.
Data entry interface in different application channels
When applying for a loan, the client fills out a questionnaire in which he indicates his monthly income. Let's look at how the distribution of income values depends on the application channel. On x - application id, on y - income.
The site has a drop-down list. And when the application comes from the affiliate network, the field can be filled with an arbitrary value. A similar situation occurs when filling out the application in the offline - office. If you do not notice this fact when developing a scoring model, the model will estimate the probability of no return using the “revenue” attribute depending on the ratio of the given partners / site / offline channels in the training set. The solution to the problem is not to use the sign “income”. Either do a discretization of the characteristic value for the channel “partners” and “offline” at the same intervals as indicated on the site (which is not very good, since the input method is different). Or do the input field on the site and wait for the accumulated data.
Marketing department
There are several products in the company:
PDL loans - loans in the amount of 2 to 20k, which need to be closed in one payment.
Installment loans - loans in the amount of 21 to 100k. At the moment when the client makes an application, depending on whether the client is new or repeated, on the region and other factors, marketing determines which product he can and should be given. Product parameters include minimum / maximum loan amounts and terms. Initially, the product definition was carried out after scoring. Those. In the scoring model the amounts and the period specified by the client were submitted. At some point, the definition of the product began to occur before scoring. And the data specified by the client were automatically replaced by the "necessary" ones and were scored. This has led to a deterioration in the quality of scoring. The solution to the problem is a return to the previous logic of product definition.
Data science specialist errors
The data analyst wants to use the “loan target” text box as a sign. Uploads data, groups loan goals into categories. Analyzes the percentage of bad in each category. The percentage of bad, or WOE - the logarithm of the ratio of good to bad.
Analysis of the level of overdue (the number of unpaid loans divided by the number of loans issued) for each category. However, the data for which the analysis was carried out include online and offline applications.
The procedure for filling the questionnaire offline is significantly different, because The questionnaire is filled in by the office manager according to the client, or the client with the prompts of the manager
Let's see what the frequency distribution of the loan target looks like in online / offline sections.
Online customers do not fill out the purpose of the loan. Taking into account the fact that the ratio of applications towards online is constantly growing, it is possible to use a sign only after setting the field “loan target” for the mandatory and additional data collection cycle.
Let's return to the sign "loan amount". The data analyst decides to use the loan amount from the loan application. An algorithm based on decision trees (random forest / gradient boosting) was chosen as the method. After the first experiments with models on the schedule feature importances, it turned out that the “loan amount” sign is the strongest. Intuitively stronger signs did not reach the top. After analyzing the possible causes, it was found that the “loan amount” field is overwritten after the loan is approved. This happens in cases where a loan officer approves a smaller and “uneven” loan amount. Thus, data leak in the data crept in, which is so common in data analysis competitions. The solution to the problem is an additional field in the database in which the initially specified amount is written.
But that's not all. Let's look at the frequency of “uneven” loan amounts depending on the application channel.
| application source | share of bids with an uneven amount |
| Android app | 0 |
| Iphone app | 0 |
| Offline | 0 |
| Partners | 0.13 |
| Site | 0 |
Applications coming from partners have uneven amounts. What in our case creates illogical connections in the tree and makes the model less resistant to the emergence of new channels of applications. The problem is aggravated by the fact that in the flow of applications the percentage of partnership in some periods can reach 80-90%. In this case, the problem is solved by abandoning the use of the feature or by discretization up to 1000 r or more.
Leaking data from the future
When filling out the questionnaire, the client may not fill in the optional fields. If the underwriter sees that the credit history is good and you can approve the loan, he can insure and further clarify by phone the data that the client has not filled out. As a result, datasainist works with a training kit, in which good clients usually have the most complete and complete questionnaire. In this case, the signs of the type “filled in the optional field X” will be strong and will characterize the borrower as good. However, in the mode of automatic scoring for good clients, these fields will be blank. In the best case, it will result in an overestimation of the quality of the model during offline validation. At worst, the quality of the model is lower compared to the option not to use these features. The solution to the problem is to work more closely with the underwriting department. Monitoring, analysis and improvement of the data collection process.
All of these problems formed the basis of a system for monitoring data quality and sustainability of scoring models.
Conclusion
In conclusion, I would like to give a few recommendations to specialists who dare to build scoring models.
- Take data under complete control, try to build an end-to-end system. The shorter the path from the source data source to your service with the scoring model, the better. Any layer in the form of additional services of preprocessing / data storage only hurts.
- Perform feature analysis over time. This can be done using the scatter plot, the x axis of the record id. And also by analyzing the average value of the characteristic in time. Train and test are better divided both in time and in objects (clients).
- Pay attention to illogically strong signs. Perhaps they leak.
- Analyze the linear relationship between the feature and the target variable (even when building non-linear models). The direction of the trend should be logical.
- If you want to get a logical relationship and a stable model, discretize monetary variables to integer values. It happens that the correlation with other signs creeps in “uneven sums” or in pennies.
- Analyze the data and quality of models in different sections. Amount range, customer segment, application source - online / offline. Try to achieve approximately the same quality model in each slice. In the case of significant changes in the ratios of slices in traffic, there will be a deterioration in performance, since The quality of the model was initially optimized for larger segments.
- Avoid auto-update models when new data is available. In this case, it will be easier to carry out a retro analysis of the causes of model errors (it is not disclosed in the article, possibly in the future).
- The use of questionnaire data does not give a strong increase in quality to the option of using only bureau data. Therefore, it is better to use this source in the latter stages, when the internal infrastructure for data collection and storage is built.
- Establish communication with other departments. Each department (not only programmers-developers) should have a change log in which all changes with a brief description and date are reflected. Even those that at first glance seem to be absolutely unimportant for scoring. A change log will help identify cause-effect relationships.
I hope the examples described in the article will be useful. They are based on combat experience and real disbursement of loans in large volumes over a long period.
Dmitry Gorelov, Devim
Source: https://habr.com/ru/post/455551/
All Articles