The complete guide to Prometheus in 2019

DevOps and SRE engineers have probably heard more than once about Prometheus .
Prometheus was created at SoundCloud in 2012 and has since become the standard for system monitoring . It has a completely open source code, it provides dozens of different exporters, with which you can set up monitoring of the entire infrastructure in minutes .
Prometheus has obvious value and is already being used by innovators in the industry, such as DigitalOcean or Docker, as part of a full monitoring system.
What is Prometheus?
Why is it needed?
How is it different from other systems?
If you know absolutely nothing about Prometheus or want to better understand it, its ecosystem and all interactions, this article is for you .
We divided this guide into 3 parts, as we did with InfluxDB .
- First comes a full review of Prometheus , its ecosystem and the main aspects of the rapidly developing technology.
- This is followed by an explanation of the technical terms of Prometheus with illustrations . If you do not know what metrics, labels, instances or exporters are, go here.
- Finally, we describe various real-world scenarios for using Prometheus . Here you will be inspired by examples of successful companies.
Part I. What is Prometheus?
Prometheus is a time series database. If you do not know what a time series database is, read the first part of the InfluxDB manual .
But Prometheus is not just a time series database.
You can attach a whole ecosystem of tools to it to expand its functionality.
Prometheus monitors a variety of systems : servers, databases, individual virtual machines, and almost anything.
For this, Prometheus periodically scrubs its target objects .
What is scraping?
Prometheus retrieves metrics via HTTP calls to specific endpoints specified in the Prometheus configuration.
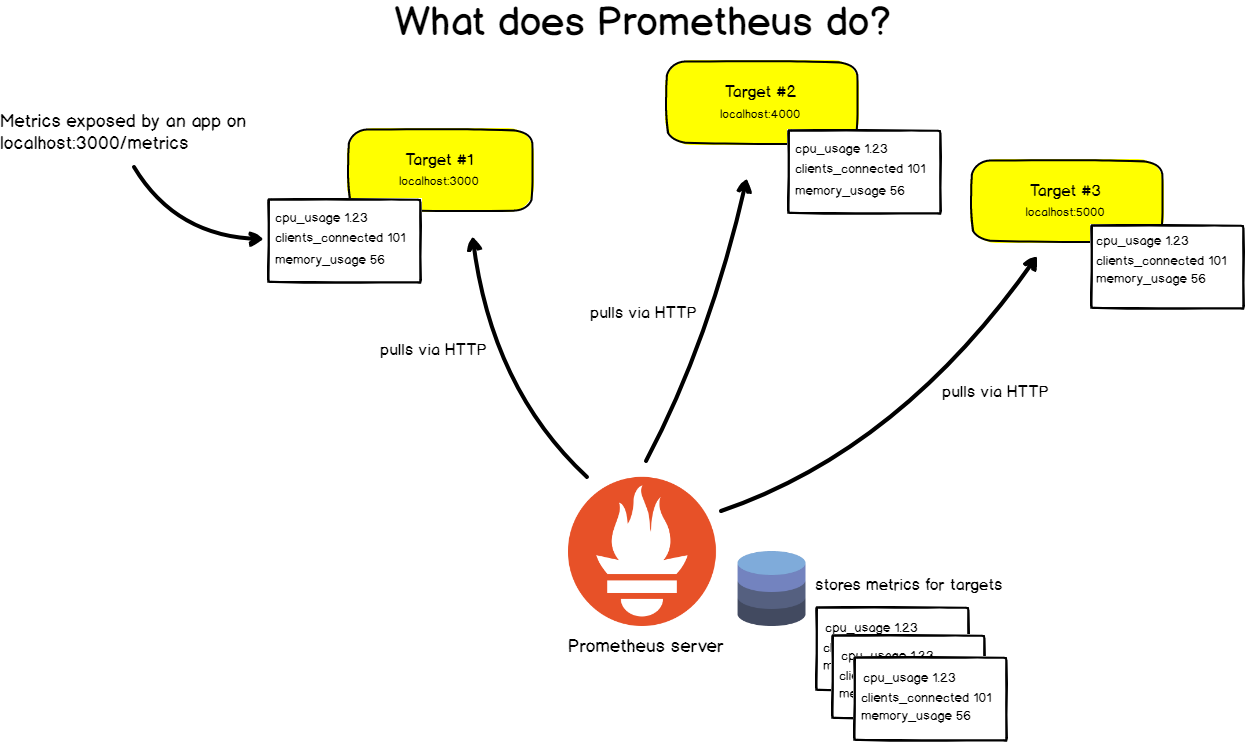
Take, for example, a web application located at http: // localhost: 3000 . The application sends the metrics in text format to some URL. Suppose http: // localhost: 3000 / metrics .
At this address, Prometheus extracts data from the target object at regular intervals.
1. How does Prometheus work?
As we have said, Prometheus consists of a wide variety of components.
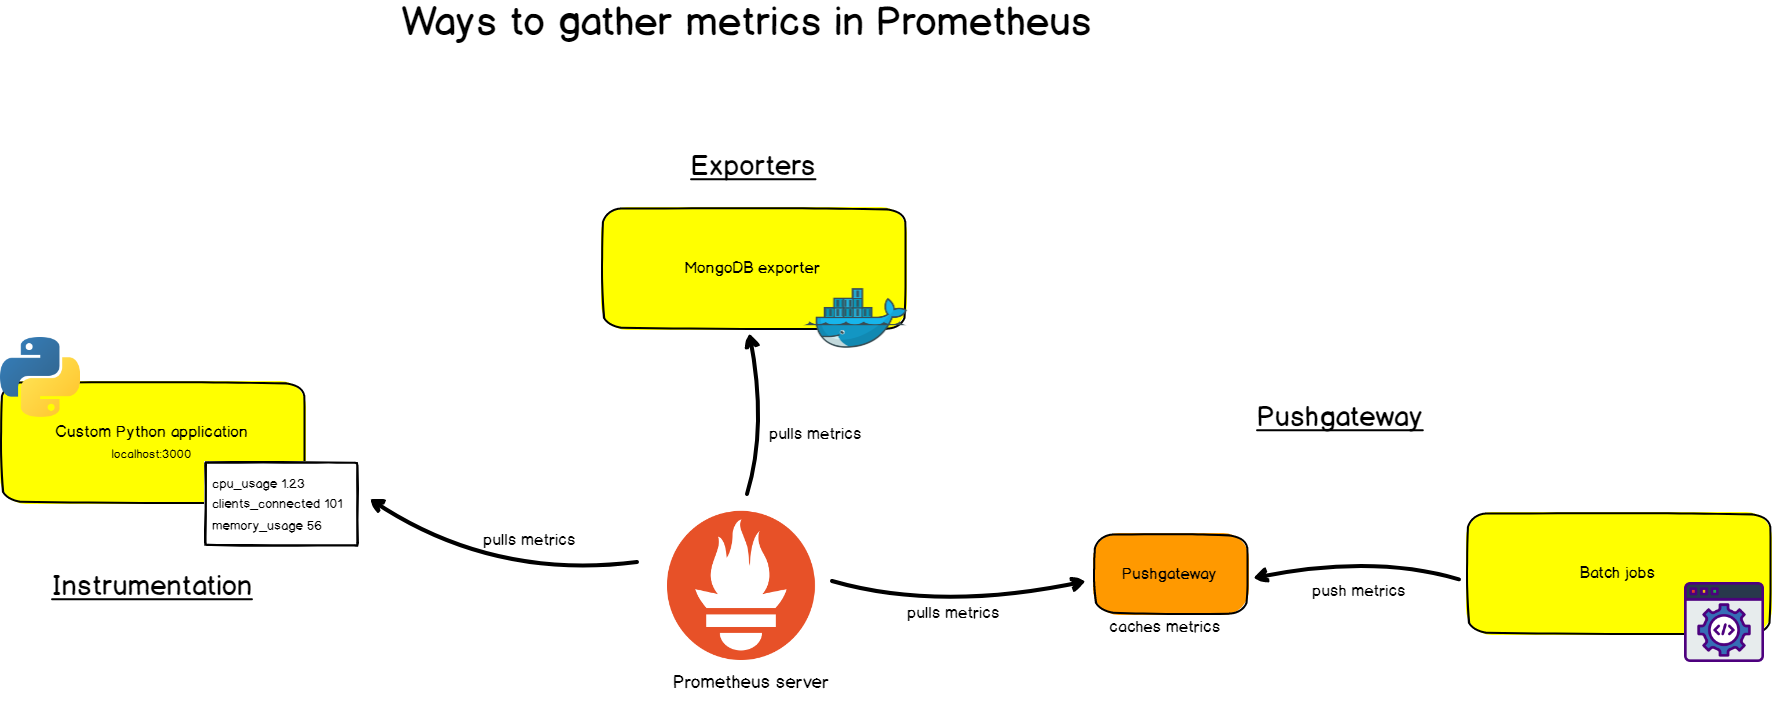
First, you need it to retrieve metrics from your systems. There are different ways:
- Instrumentation of the application, that is, your application will provide metrics compatible with Prometheus at a given URL. Prometheus will identify it as a target and will scrap at a specified interval.
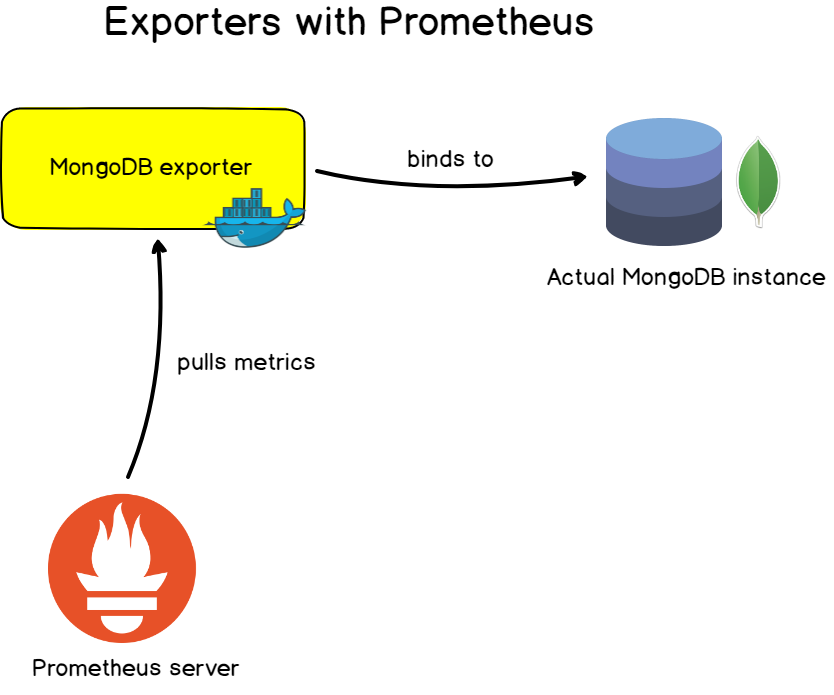
- Use of ready-made exporters . Prometheus has a whole collection of exporters for existing technologies. For example, ready-made exporters for monitoring Linux machines ( Node Exporter ), for common databases ( SQL Exporter or MongoDB Exporter ), and even for HTTP load balancers (for example, HAProxy Exporter ).
- Use Pushgateway . Sometimes applications or tasks do not provide metrics directly. They may not be designed for this (for example, batch jobs) or you yourself decided not to provide metrics directly through the application.
As you already understood, Prometheus itself collects data (except in rare cases when we use Pushgateway).
What does it mean?
Why do you need it?
2. Collect vs. sending
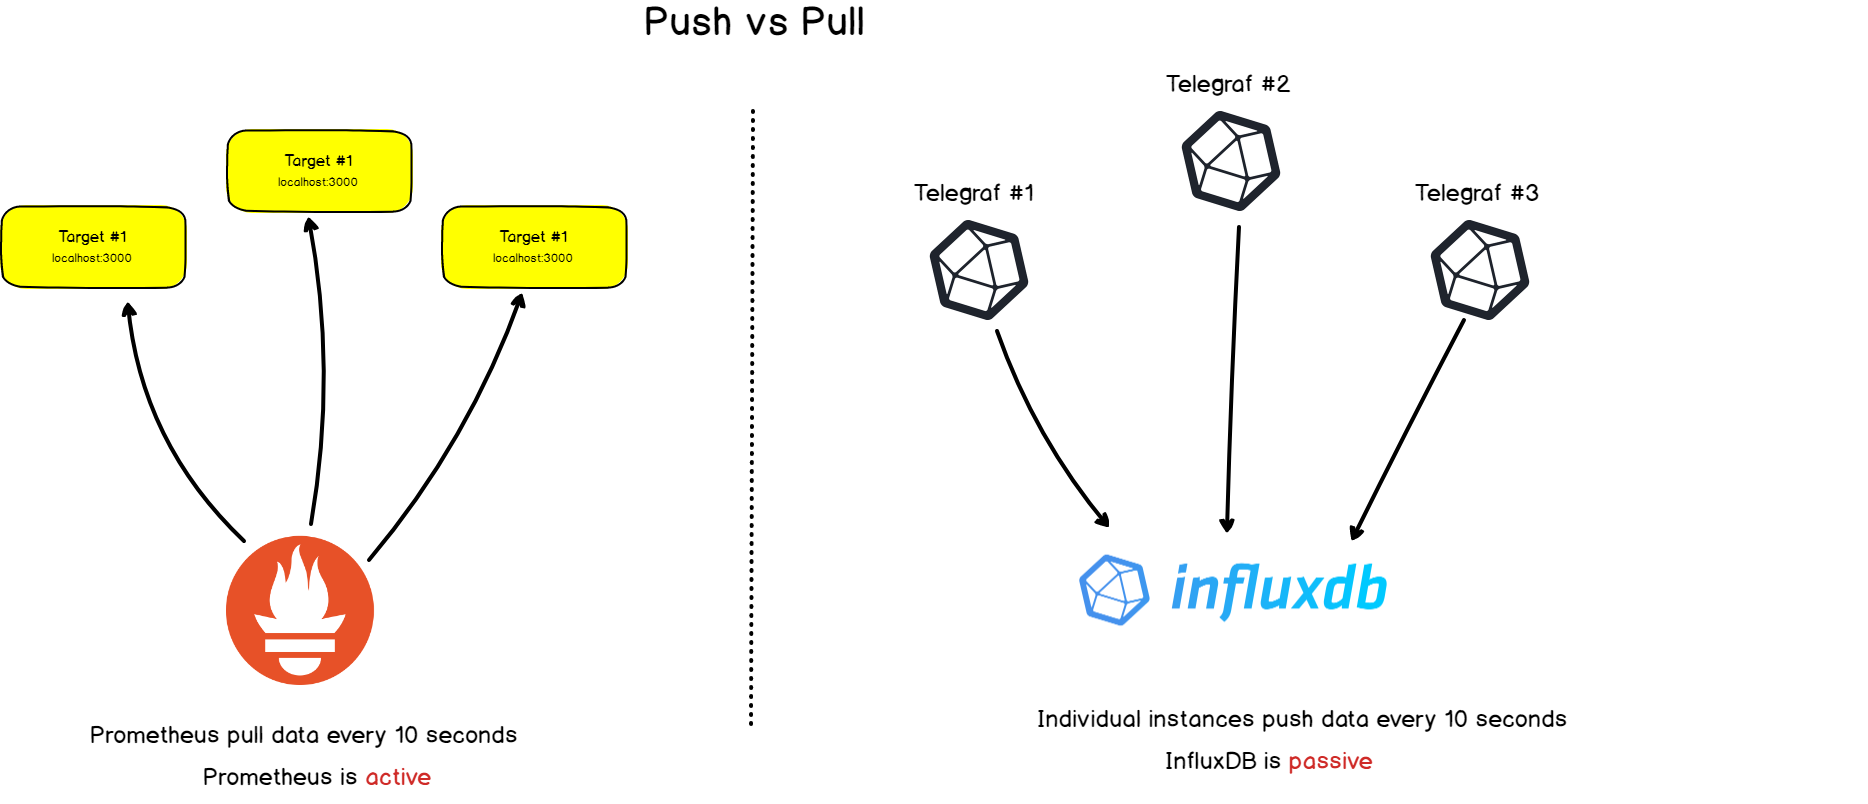
Prometheus has a noticeable difference from other time series databases: it actively scans target objects to get metrics from them .
InfluxDB, for example, works differently: you directly send data to it .
Both approaches have their pros and cons. Based on the available documentation, we have compiled a list of reasons why the creators of Prometheus chose this architecture:
- Centralized control . If Prometheus sends requests to target objects, we do all the configuration on the side of Prometheus, not on individual systems.
Prometheus decides where and how often to scrape.
If the objects themselves send data, there is a risk that there will be too much such data, and the server will fail. When the system collects data, you can control the frequency of collection and create several scrapping configurations to select different frequencies for different objects .
- Prometheus stores aggregated metrics .
This is an addition to the first part, where we discussed the role of Prometheus.
Prometheus is not event based and this is very different from other time series databases. It does not intercept individual events with a time reference (for example, service interruptions), but collects pre-aggregated metrics about your services .
Unless specifically, the web service does not send a 404 error message and a message with the cause of the error. A message is sent about the fact that the service received a 404 error message in the last five minutes.
This is the main difference between time-series databases that collect aggregated metrics and those that collect raw metrics.
3. Developed Prometheus Ecosystem
Prometheus is essentially a time series database.
But when working with such databases, it is often necessary to visualize the data, analyze it and set up alerts on it.
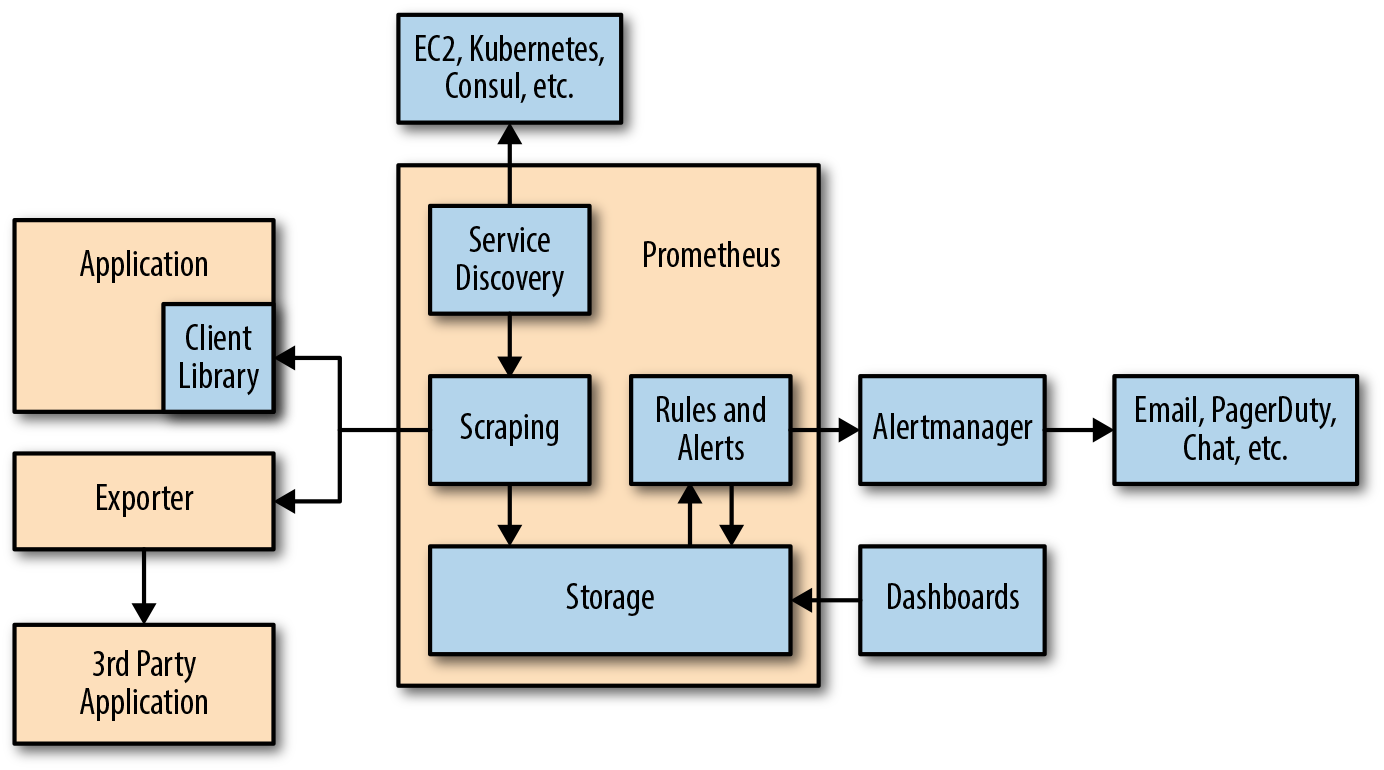
Prometheus supports the following tools that extend its functionality:
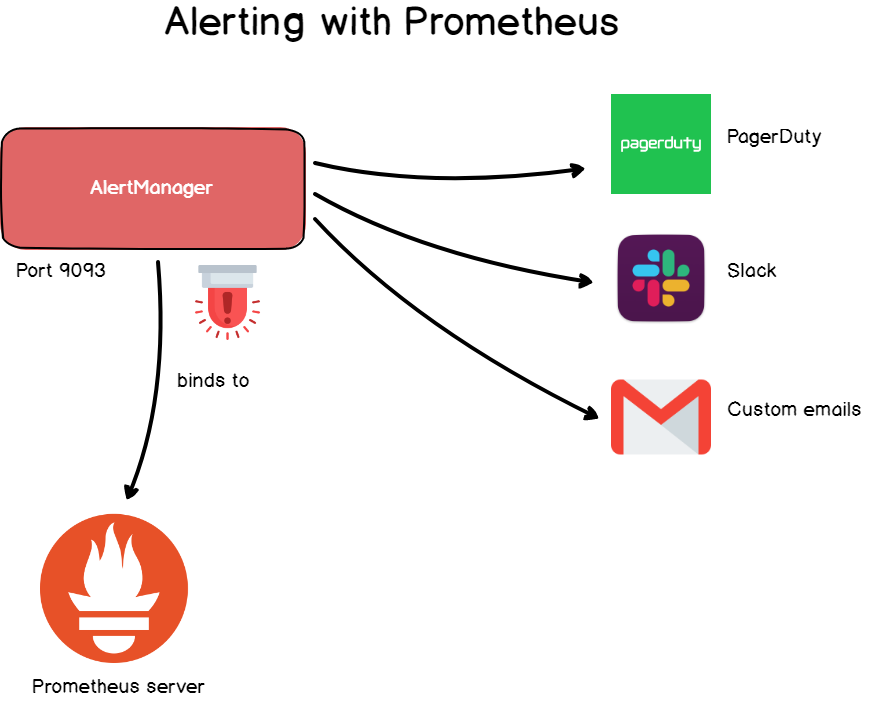
- Alertmanager . Prometheus sends alerts to Alertmanager based on custom rules defined in configuration files. From there, they can be exported to different endpoints (for example, Pagerduty or Slack).
- Data visualization . As in Grafana, you can visualize time series directly in the Prometheus web user interface. You can filter data and make specific reviews of what is happening in different target objects.
- Service discovery Prometheus dynamically detects targets and automatically scrubs new targets on demand. This is especially useful if you work with containers that dynamically change addresses depending on demand.

Part II. Prometheus Concepts
As with the InfluxDB manual, we will explain in detail the technical terms associated with Prometheus.
1. Key-value data model
Before turning to Prometheus tools, it is important to fully understand this data model.
Prometheus works with key-value pairs . The key describes what we measure, and the value stores the actual value as a number.
Remember: Prometheus is not made to store raw information, such as plain text. It stores metrics aggregated over a period of time.
The key in this case is the metric . This, for example, processor speed or occupied memory.
But what if you need more details about the metric?
For example, the processor has 4 cores, and we need 4 separate metrics?
And here labels come to the rescue. Labels provide more information about metrics by adding additional fields. For example, you describe not just the speed of the processor, but the speed of a single core at a specific IP.
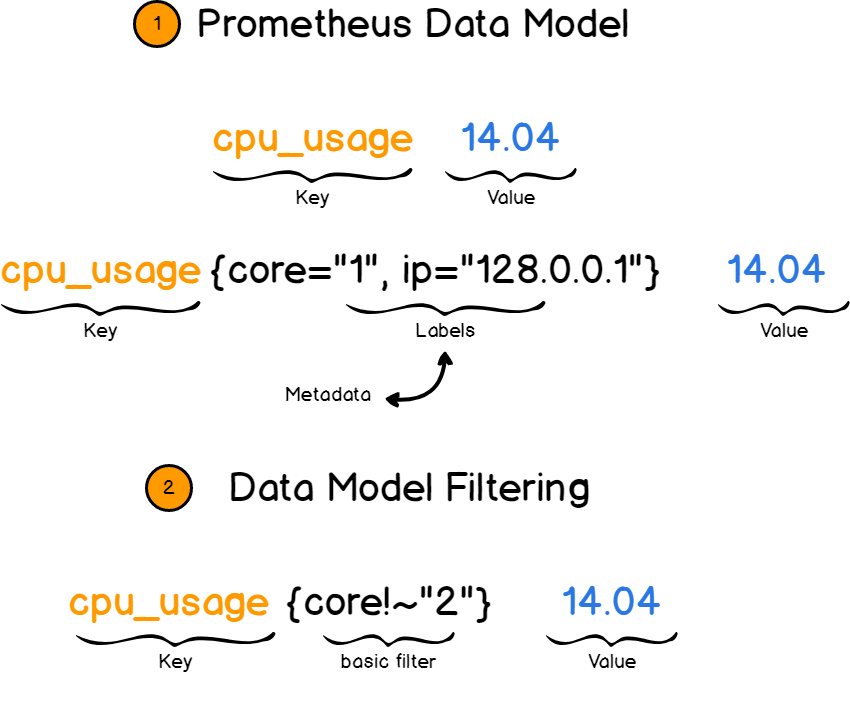
Then you can filter metrics by labels and view only the necessary information.
2. Types of metrics
When monitored with Prometheus, metrics can be described in four ways. Better read to the end, because there are pitfalls here.
Counter
This is probably the easiest type of metrics. The counter, as the name implies, counts the elements for a period of time .
If you want to calculate, for example, HTTP errors on servers or visiting a website, use a counter .
And logically, of course, the counter can only increase or reset the number , so it is not suitable for values that can decrease, or for negative values.
It is especially convenient to use it to count the number of occurrences of a certain event over a period of time, i.e., the rate of change of a metric with time.
And if you need to measure, say, the memory used for a certain period?
This value may decrease. How to calculate it with Prometheus?
Gauges
Meet the Meters!
Meters deal with values that may decrease over time . They can be compared with thermometers - if you look at a thermometer, you will see the current temperature.
But if meters can increase and decrease and take positive and negative values, then it turns out they are better than counters?
So counters are useless?
At first I thought so. Once they can do anything, let's use them everywhere. Is it logical
And no.
Meters are ideal for measuring the current metric value, which may decrease over time.
It is here that lies the very pitfalls: the meter does not show the development of the metric over a period of time. Using gauges, you can miss the irregular metric changes over time .
Why? This is what / u / justinDavidow says :
“The meter displays the average delta counter value for a unit over a period of time.
The counter takes into account each unit used (if it is a processor, then operations, cycles or clock cycles), and then you can choose which indicators for which period you need.
If you use a meter, the sampling rate must be accurate. If the frequency differs by at least a few microseconds, the value will be unreliable. This is even more noticeable with a large load, where the time between measurements increases exponentially, because the system scheduler does not have time to pay attention to the monitoring application. ”
If the system sends metrics every 5 seconds, and Prometheus scraps the target object every 15, you may lose some metrics in the process. If you perform additional calculations with these metrics, the accuracy of the results will be even lower.
At the counter, each value is aggregated. When Prometheus collects it, he realizes that the value has been sent at a certain interval.
Now do not get confused.
bar chart
A histogram is a more complex metric type. It provides additional information. For example, the sum of measurements and their quantity.
Values are collected in a region with a custom upper bound. Therefore, a histogram can:
- Calculate the mean values , that is, the sum of the values divided by the number of values.
- Calculate the relative measurement of values , and it is very convenient if you need to know how many values in a particular area meet the specified criteria. This is especially useful if you need to track proportions or set quality indicators.
In the real world, I would like to receive an alert if 20% of my servers have a response of more than 300 ms or a response of servers of more than 300 ms more than 20% of the time.
If you are dealing with proportions, you need bar charts .
Reports
Reports are extended histograms . They also show the amount and number of measurements, and also quantiles for a sliding period .
Quantiles, if that, is the division of the probability density into segments of equal probability.
So: histograms or reports?
It all depends on the intention .
Histograms combine the values over a period of time, providing the amount and quantity, which can be used to track the development of a specific metric.
Reports, on the other hand, show quantiles for a sliding period (i.e., continuous development over time).
This is especially useful if you need to know a value that represents 95% of the values recorded for the period.
3. Assignments and copies
Given the recent advances in distributed architectures and the popularity of cloud solutions, you are unlikely to use a single server that works by itself.
Servers are replicated and distributed worldwide.
To illustrate this, let's look at the classic architecture of two HAProxy servers, which redistribute the load across nine back-end web servers ( No, no, no Stackoverflow stacks. )
In this real-life example, we’ll track the number of HTTP errors returned by the web servers .
In the language of Prometheus, a single web server is called an instance . The task is the fact that you measure the number of HTTP errors on all instances.
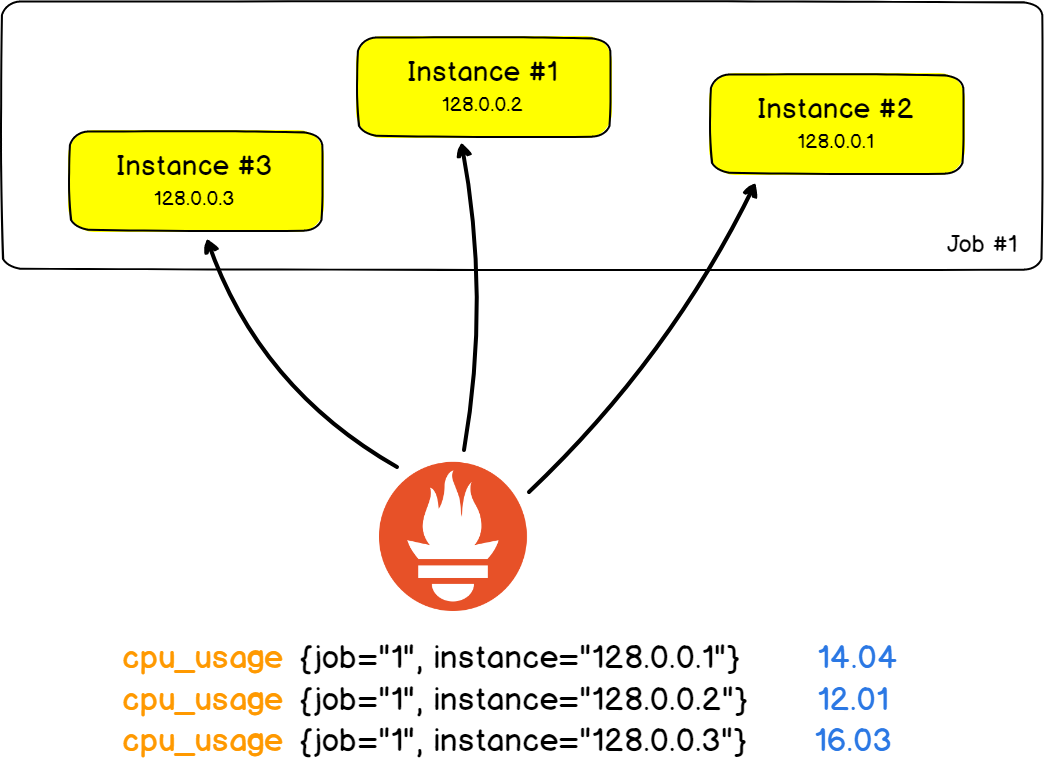
The beauty is that tasks and instances are fields in labels, and you can filter the results by a specific instance or task.
Is it convenient?
4. PromQL
If you use InfluxDB-based databases, you are probably already familiar with InfluxQL . Or use SQL in TimescaleDB .
Prometheus also has its own language for querying and retrieving data from servers: PromQL .
As we already know, the data is presented in the form of key-value pairs. PromQL uses the same syntax and returns the results in the form of vectors.
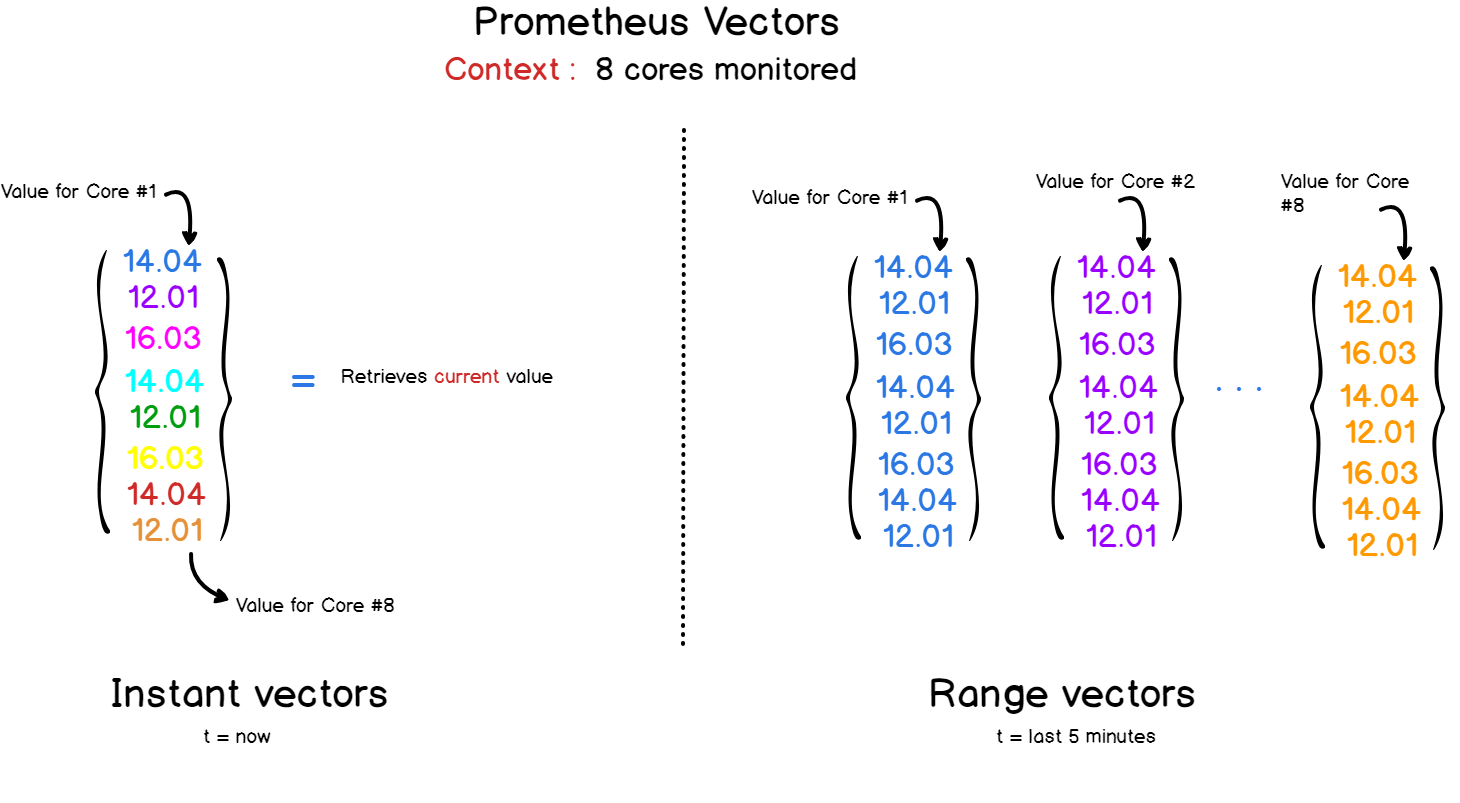
What are the vectors?
There are two types of vectors in Prometheus and PromQL:
- Instant vectors that represent all metrics on the last timestamp.
- Time Range Vectors : If you need to see the development of a metric over time, you can specify a time range in a query to Prometheus. As a result, get a vector that combines all the values recorded for the selected period.
The PromQL API provides a set of functions for handling data in queries.
You can sort values, apply mathematical functions to them (for example, calculate derivatives or exponents), and even make predictions (for example, using the Holt-Winters model).
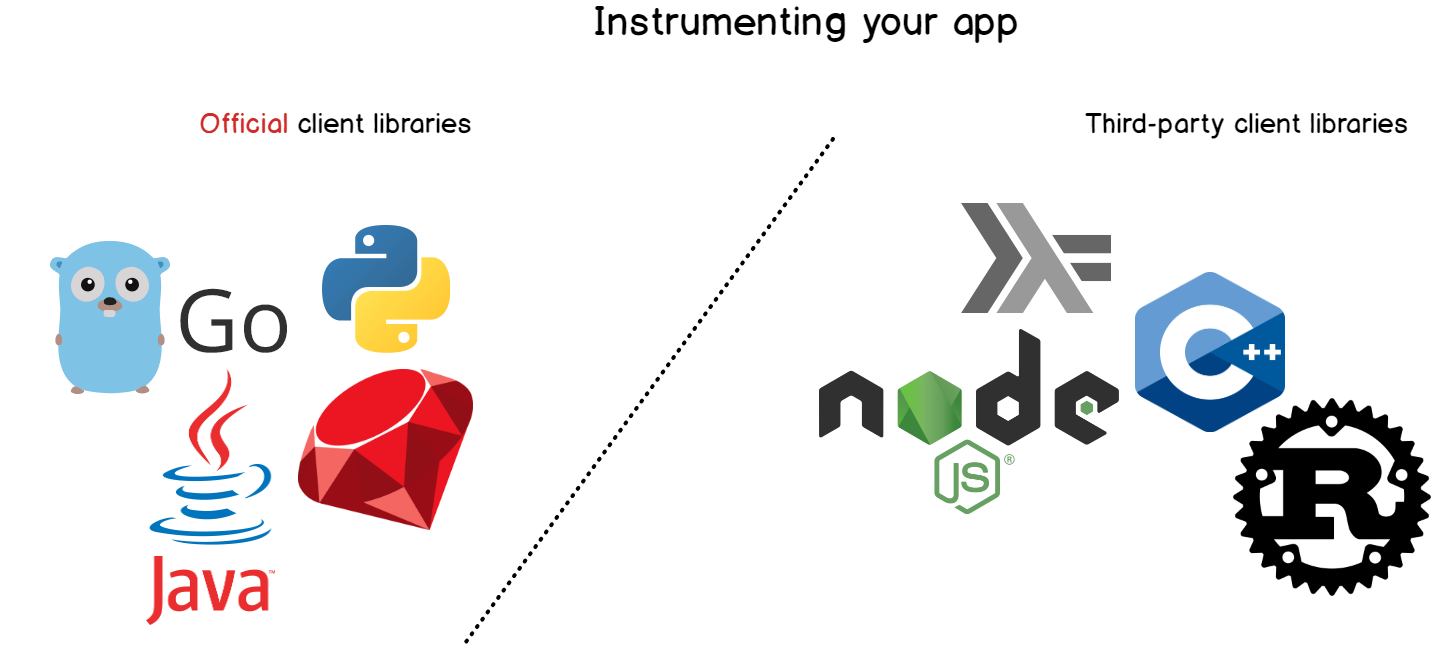
5. Instrumentation
Instrumentation is another important part of Prometheus. You tool applications before extracting data from them.
In Prometheus language, instrumentation means adding client libraries to an application to provide Prometheus metrics.
Instrumentation is available for most common programming languages: for example, Python, Java, Ruby, Go, and even Node or C # .
Essentially, you create memory objects (for example, meters or counters) that will dynamically increase or decrease the value.
Then you choose where to provide the metrics. Prometheus will take it from there and save it to its time series database.
6. Exporters
In the applications you have written, it is very convenient to customize the metrics provided and their change over time using instrumentation.
For well-known applications, servers and databases, Prometheus offers exporters with which you can monitor target objects .
These exporters are usually presented as Docker images and are easily customizable. They provide a ready-made set of metrics and often ready-made dashboards with which you can set up monitoring in minutes.
Examples of exporters:
- Database exporters : for MongoDB databases, SQL servers and MySQL.
- HTTP Exporters : for HAProxy, Apache or NGINX servers.
- Unix Exporters : System performance can be monitored using built-in node exporters, which provide all system metrics without additional configuration.
A couple of words about mutual compatibility
Most time series databases support mutual compatibility for their systems.
Prometheus is not the only monitoring system with its own metric requirements. For example, InfluxDB (via Telegraf), CollectD , StatsD and Nagios also have their own standards.
Therefore, for the interaction of different systems are exporters. Even if Telegraf sends metrics not in the format that Prometheus accepts, Telegraf can send these metrics to the exporter of InfluxDB, from where Prometheus will then take them.
7. Alerts
When working with time-series databases, you need feedback from the data, and alert managers are responsible for this.
In Grafana, alerts are common, but they are available in Prometheus through the alert manager.
The alert manager is a separate tool that joins Prometheus and launches custom annunciators .
Alerts are defined in the configuration file and define a set of rules for metrics. If the time series meets the rule, an alert is initiated and sent to the specified recipients.
As in Grafana, you can specify the email address, Slack weblog, PagerDuty, and custom HTTP objects as the recipient.
Part III. Prometheus Usage Examples

And, of course, there should be practical examples in each manual. As I like to say, technology is not an end in itself and should perform a specific task.
About this and talk.
1. DevOps
With all these exporters for different systems, databases and servers, it is obvious that Prometheus is intended primarily for the DevOps realm .
We know that in this area there are many competing suppliers and personalized solutions.
Prometheus is perfect for DevOps.
It takes almost no effort to set up and launch instances, and any auxiliary tool can be easily activated and configured.
By detecting targets — for example, through a file exporter — this is an excellent solution for stacks where containers and distributed architectures are widely used.
In an environment where instances are now and again created and deleted, not a single DevOps stack can do without the discovery of services .
2. Health
Today, monitoring solutions are needed not only in IT. They are also used in large industries that provide flexible and scalable architectures for healthcare.
Demand is growing, and IT architectures are required to comply. If you do not have a reliable tool to monitor the entire infrastructure, you run the risk of serious interruptions in service . Already in the field of health care, such a danger should definitely be minimized.
This example was discussed at opensource.com in the next article .
3. Financial services
The last example was cited at the InfoQ conference, where the use of Prometheus in financial institutions was discussed.
Jamie Christian and Alan Strader showed how they use Prometheus to monitor their infrastructure in the Northern Trust. Very informative, I advise you to look.
Part X. What's next?

It's time to move from theory to practice .
Today you have learned the basics of Prometheus, what functions it performs, what tools and systems it works with, and what terms it uses.
Now you have everything you need to create your monitoring solution .
To get started with Prometheus, explore all available exporters .
Then install the necessary tools, create your first dashboard - and go!
If you need inspiration, read my article on how to monitor a Linux machine with Prometheus and Grafana . There are instructions for setting up tools and the first dashboard.
I hope you learned something new.
If you have a topic for my next article, share it.
Happily stay!
')
Source: https://habr.com/ru/post/455290/
All Articles