Top errors from the development side when working with PostgreSQL
HighLoad ++ has been around for a long time, and we talk about working with PostgreSQL regularly. But developers are still from month to month, from year to year there are the same problems. When in small companies without DBA in the state there are errors in working with databases, this is not surprising. In large companies, databases are also needed, and even with established processes, errors still occur, and the bases are falling. It doesn’t matter what size a company is - errors still happen, the database periodically collapses, collapses.
Of course, this will never happen to you, but it is not difficult to check the checklist, and it can save the future nerves very well. Under the cut, we list the top common mistakes that developers make when working with PostgreSQL, let's figure out why you don’t need to do this and find out how to do it.
')
About speaker: Alexey Lesovsky ( lesovsky ) started as a Linux system administrator. From the tasks of virtualization and monitoring systems gradually came to PostgreSQL. Now PostgreSQL DBA in Data Egret is a consulting company that works with a large number of different projects and sees many examples of recurring problems. This is a link to the presentation of the report on HighLoad ++ 2018.
For a warm-up, a few stories about how errors occur.
One of the problems is what features the company uses when working with PostgreSQL. Everything begins simply: PostgreSQL, data sets, simple queries with JOIN. We take the data, we do SELECT - everything is simple.
Then we start to use additional functionality of PostgreSQL, we add new functions, extensions. Fitch becomes more. We connect stream replication, shardirovaniye. Different utilities and body kits appear around - pgbouncer, pgpool, patroni. Like that.
The way we store data is also a source of errors.
When the project has just appeared, there is quite a bit of data and tables in it. Simple queries are enough to receive and record data. But then the tables get bigger. The data is selected from different places, there are JOIN. Requests are complicated and include CTE constructs, SUBQUERY, IN-lists, LATERAL. To make a mistake and write a curve request becomes much easier.
And this is only the tip of the iceberg - somewhere on the side there may be another 400 tables, partitions, from which data is also occasionally read.
The story of how the product is followed. Data always needs to be stored somewhere, so there is always a database. How does a database develop when a product develops?
On the one hand, there are developers who are busy with programming languages. They write their applications and develop skills in software development, not paying attention to the services. Often they are not interested in how Kafka or PostgreSQL works - they develop new features in their application, and they don’t care about the rest.

On the other hand - admins . They bring up new instances in Amazon on Bare-metal and are busy with automation: they set up a layout so that the display works well, and the configs so that the services interact well with each other.
There is a situation when there is no time or desire for fine tuning of components, including the database. Bases work with default configs, and then forget about them at all - “it works, don't touch”.
As a result, rakes are scattered in various places, which continually fly in front of the developers. In this article we will try to collect all these rakes into one shed so that you know about them and do not step on them when working with PostgreSQL.
At first we will present that we have a new project - it is always active development, testing hypotheses and implementing new features. At the moment when the application just appeared and develops, it has little traffic, users and clients, and they all generate small amounts of data. Simple queries work in the database and are quickly processed. No need for large amounts of data, there is no problem.
But there are more users, traffic comes: new data appears, databases grow and old queries stop working. It is necessary to complete indexes, rewrite and optimize queries. There are performance problems. All this leads to alerts at 4 am, stress for admins and management discontent.
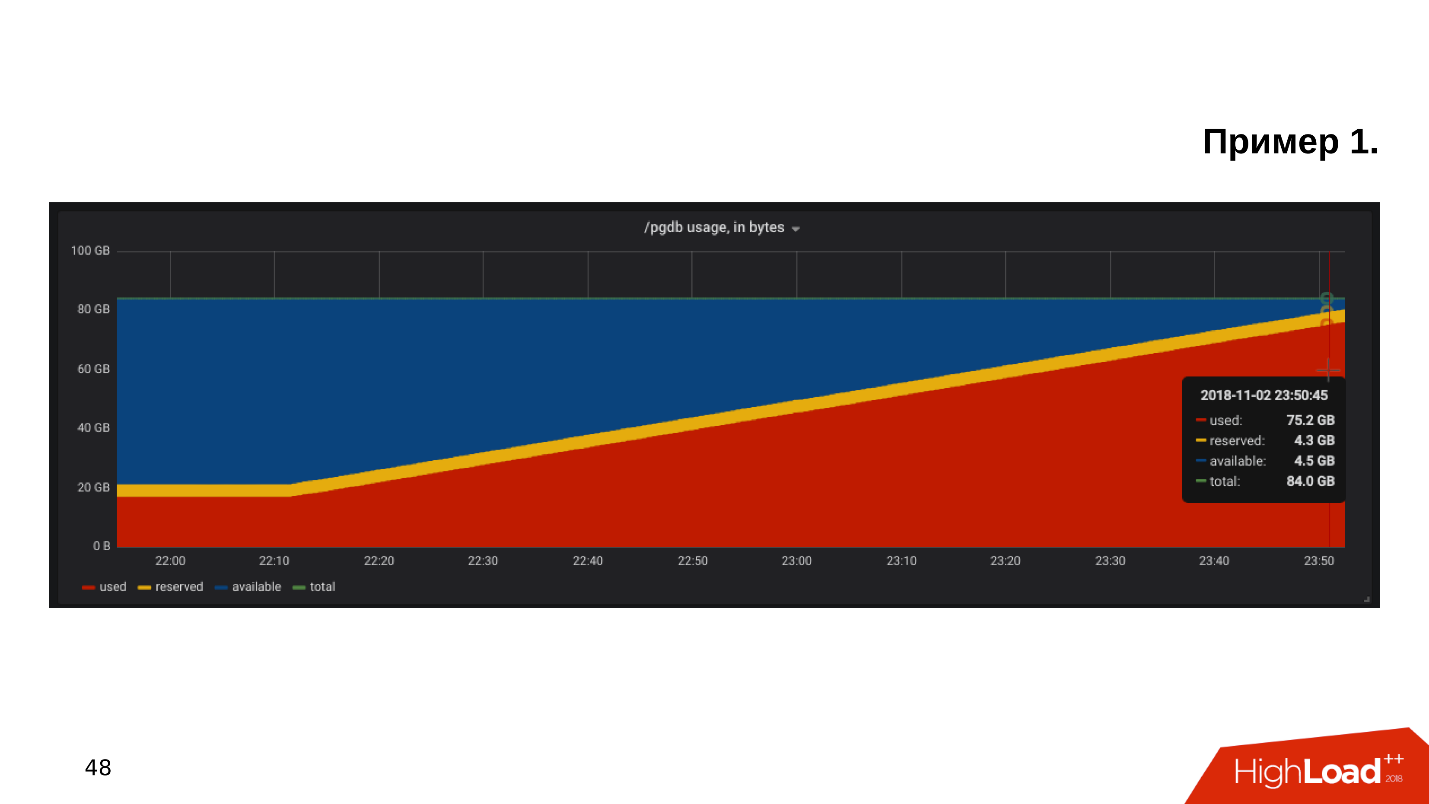
First example . We open the disk utilization monitoring schedule, and we see that the free space on the disk is running out .
We look at how much space and what is eaten - it turns out there is a pg_xlog directory:
Database administrators usually know what this directory is, and do not touch it - it exists and it exists. But the developer, especially if he looks at staging, scratches his head and thinks:
- Some logs ... Let's remove pg_xlog!
Removes a directory, the base stops working . Immediately you have to google how to raise the base after you deleted the transaction logs.

The second example . Again we open monitoring and see that there is not enough space. This time the place is occupied by some kind of base.
We are looking for which database takes up the most space, which tables and indexes.

It turns out that this is a table with historical logs. We never needed historical logs. They are written just in case, and if it were not a problem with the place, no one would have looked at them until the second coming:
- Let's clean out all that mm ... older than October!
Create an update query, run it, it will work out and delete some of the lines.
The query works 10 minutes, but the table still takes the same place.
PostgreSQL deletes the rows from the table - everything is correct, but it does not return space to the operating system. This behavior of PostgreSQL is unknown to most developers and can be very surprising.
The third example . For example, ORM made an interesting query. Usually everyone blames the ORM for making “bad” queries that read several tables.
Suppose there are several JOIN operations that read tables in parallel in several threads. PostgreSQL can parallel data manipulation operations and can read tables in several threads. But, given that we have several application servers, this query reads all the tables several thousand times per second. It turns out that the database server is overloaded, the disks do not cope, and all this leads to error 502 Bad Gateway from the backend - the database is unavailable.
But that is not all. We can recall the other features of PostgerSQL.
How to be? Need monitoring and planning! It would seem obvious, but for some reason in most cases no one plans a base, and monitoring does not cover everything that needs to be monitored during the operation of PostgreSQL. There is a set of clear rules, under which everything will work well, and not “at random”.
Place the database on the SSD without hesitation . SSDs have long been reliable, stable and productive. Enterprise SSD models have been around for years.
Always plan your data schema . Do not write in the database that you doubt what is needed - guaranteed not needed. A simple example is a slightly modified table of one of our clients.
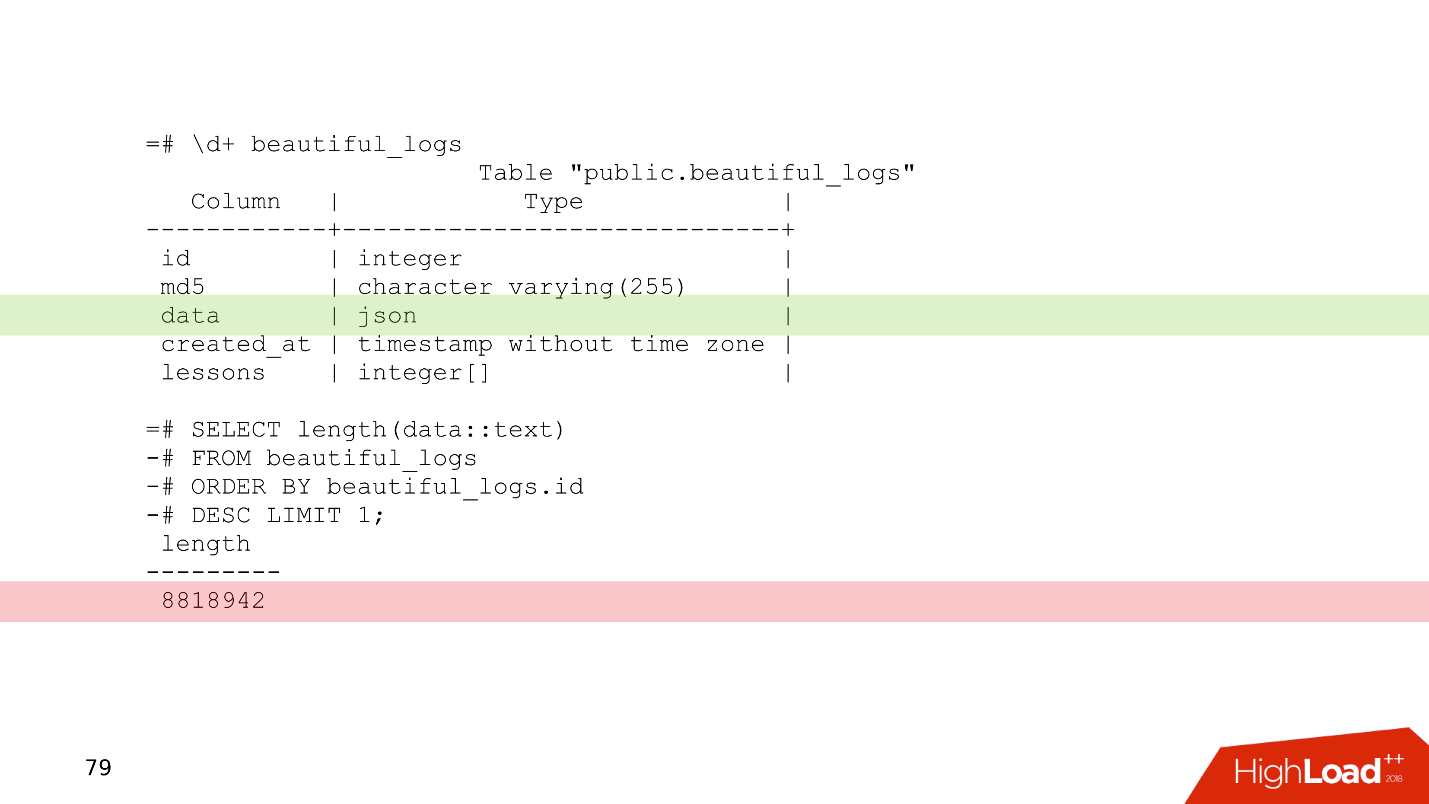
This is a log table, in which there is a data column with a json type. Relatively speaking, anything can be written in this column. From the last entry of this table it is clear that the logs occupy 8 MB. PostgreSQL has no problem storing records of this length. PostgreSQL has very good storage that chews such records.
But the problem is that when the application servers read data from this table, they will easily clog up the entire bandwidth of the network, and other requests will suffer. This is the problem of scheduling data.
Use partitioning for any hints on history that need to be stored for more than two years . Partitioning sometimes seems difficult - you need to bother with triggers, with functions that will create partitions. In the new versions of PostgreSQL, the situation is better and now the setting of partitioning is much easier - once done, and it works.
In the above example of deleting data in 10 minutes,
When the data is sorted into partitions, the partition is deleted in just a few milliseconds, and the OS is given immediately. Managing historical data is easier, easier and safer.
Monitoring is a separate large topic, but from the point of view of the database, there are recommendations that can fit in one section of the article.
By default, many monitoring systems provide monitoring of processors, memory, network, disk space, but, as a rule, there is no utilization of disk devices . Information about how loaded the disks are, how much bandwidth is currently on the disks and the latency value should always be added to the monitoring. This will help to quickly assess how the discs are loaded.
There are a lot of PostgreSQL monitoring options for every taste. Here are some points that must be present.
For more information, see the PostgreSQL Monitoring Basics report from HighLoad ++ Siberia and the Monitoring page in the PostgreSQL Wiki.
When we planned and monitored everything, we could still face some problems.
Usually the developer sees the database line in the config. He is not particularly interested in how it is arranged inside - how checkpoint, replication, and scheduler work. A developer already has something to do - there are many interesting things in todo that he wants to try.
Ignorance of the subject leads to quite interesting consequences when the developer starts writing queries that work in this database. Fantasies when writing queries sometimes give stunning effects.
There are two types of transactions. OLTP transactions are fast, short, lightweight, and can be performed in fractions of milliseconds. They work very quickly, and there are a lot of them. OLAP - analytical queries - slow, long, heavy, read large arrays of tables and count statistics.
The last 2-3 years often sounds abbreviation HTAP - Hybrid Transaction / Analytical Processing or hybrid transaction-analytical processing . If you have no time to think about scaling and separation of OLAP and OLTP requests, you can say: “We have HTAP!” But experience and the pain of errors show that, after all, different types of requests should live separately from each other, because long OLAP requests are blocked by light OLTP requests.
So we come to the question of how to scale PostgreSQL so that the load is spread, and everyone was happy.
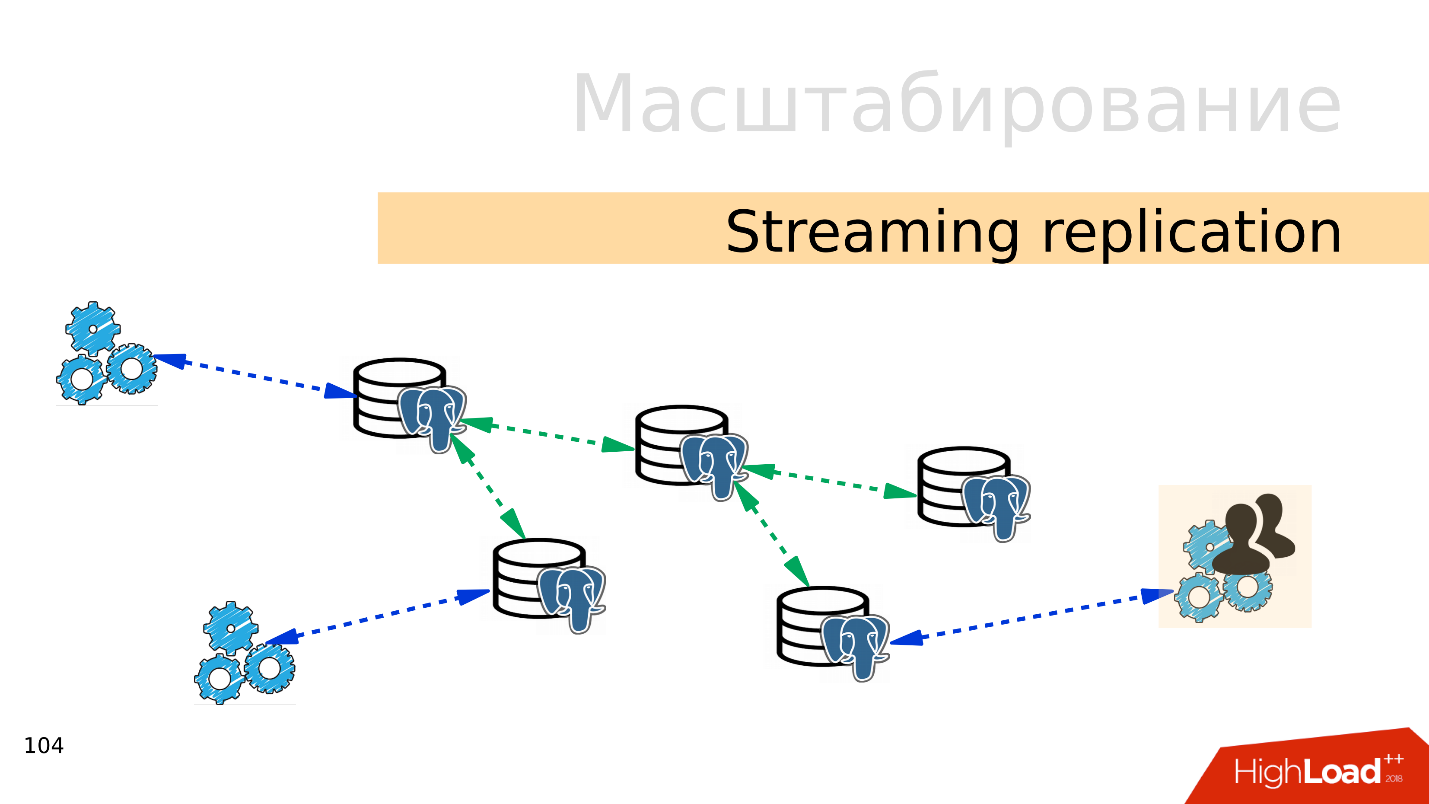
Streaming replication . The easiest option is stream replication . When the application works with the database, we connect several replicas to this database and distribute the load. Recording still goes to the master database, and reading replicas. This method allows you to scale very widely.
Plus, to individual replicas, you can connect more replicas and get cascade replication . Individual groups of users or applications that, for example, read analytics, can be put on a separate replica.
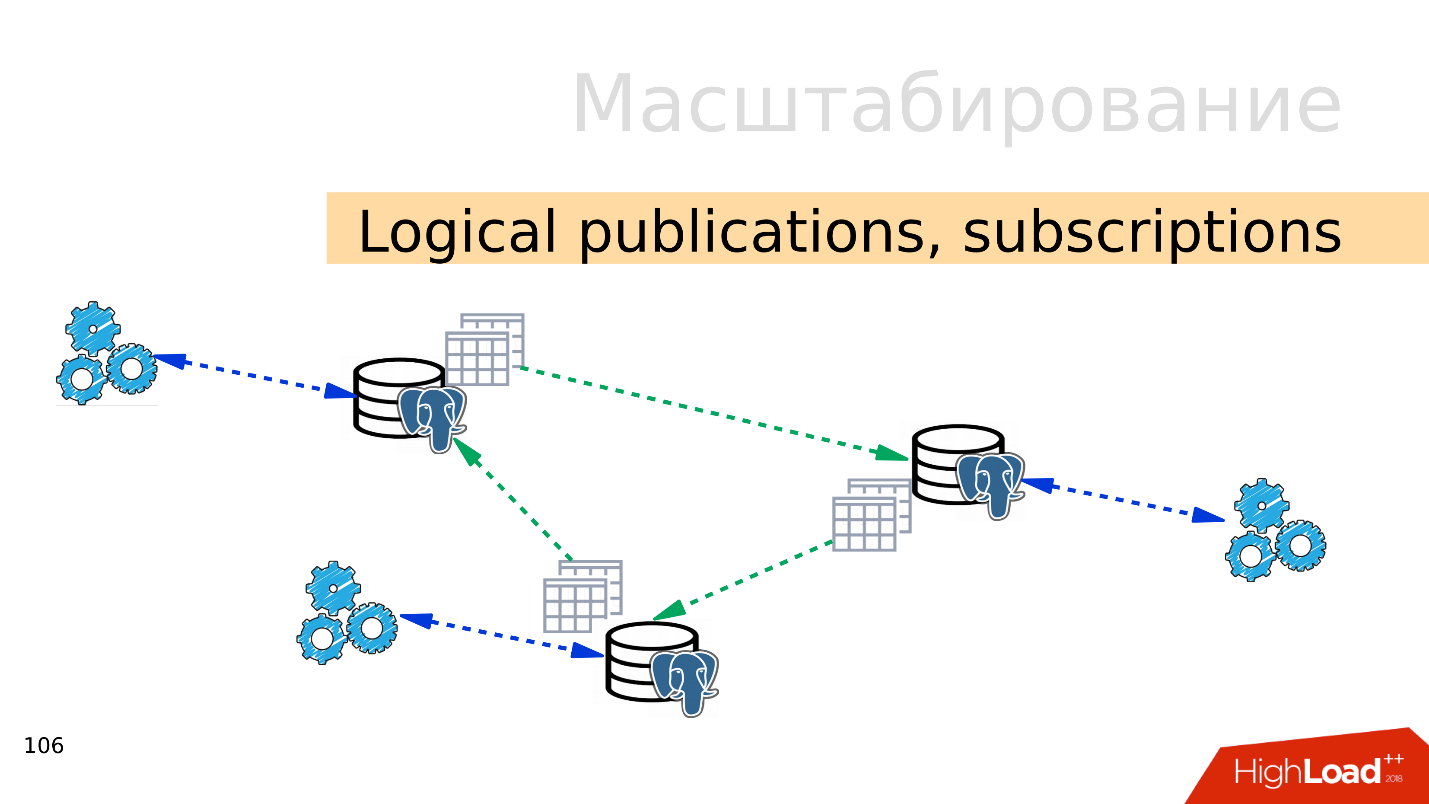
Logical publications, subscriptions - the mechanism of logical publications and subscriptions assumes the existence of several independent PostgreSQL-servers with separate databases and sets of tables. These sets of tables can be connected to neighboring databases, they will be visible to applications that can use them normally. That is, all changes that occur in the source are replicated to the destination base and visible there. Works great with PostgreSQL 10.
Foreign tables, Declarative Partitioning - declarative partitioning and external tables . You can take several PostgreSQL and create there several sets of tables that will store the desired ranges of data. This may be data for a particular year or data collected over any range.
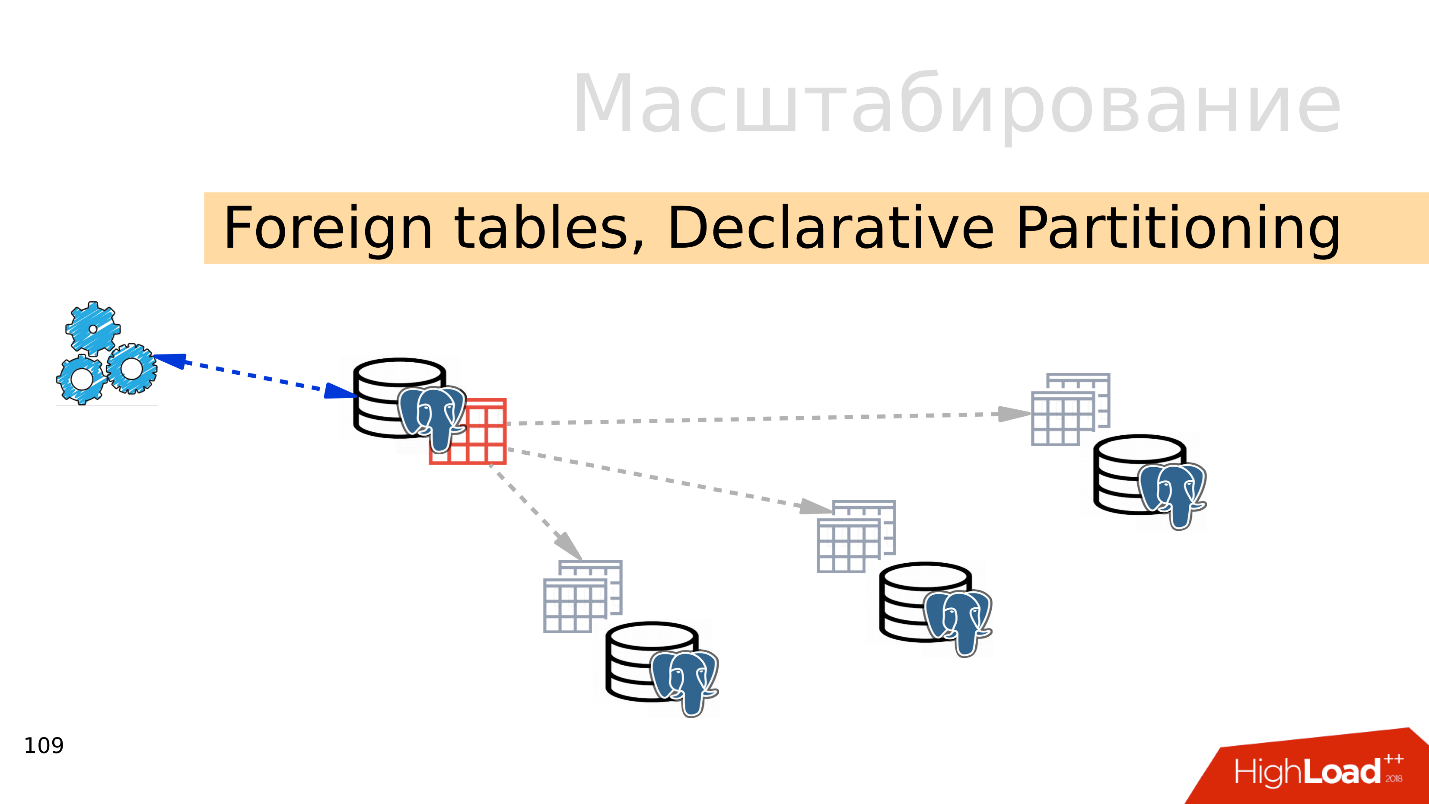
Using the mechanism of external tables, you can combine all these databases in the form of a partitioned table in a separate PostgreSQL. An application may already work with this partitioned table, but in fact it will read data from remote partitions. When data volumes are more than the capabilities of a single server, then this is a sharding.

All this can be combined into spread configurations, come up with different PostgreSQL replication topologies, but how it will work and how to manage it is a topic for a separate report.
The easiest option is with replication . The first step is to spread the load on the read and write. That is, write to the master, and read from the replicas. So we scale the load and take out reading from the master. In addition, do not forget about analysts. Analytical queries work for a long time, they need a separate replica with separate settings, so that long analytical queries can not interfere with the rest.
The next step is balancing . We still have the same line in the config that the developer operates on. He needs a place where he will write and read. There are several options here.
Ideal - implement balancing at the application level , when the application itself knows where to read data from, and knows how to choose a replica. Suppose an account balance always needs an up-to-date one and needs to be read from a master, and a picture of a product or information about it can be read with some delay and done with a replica.
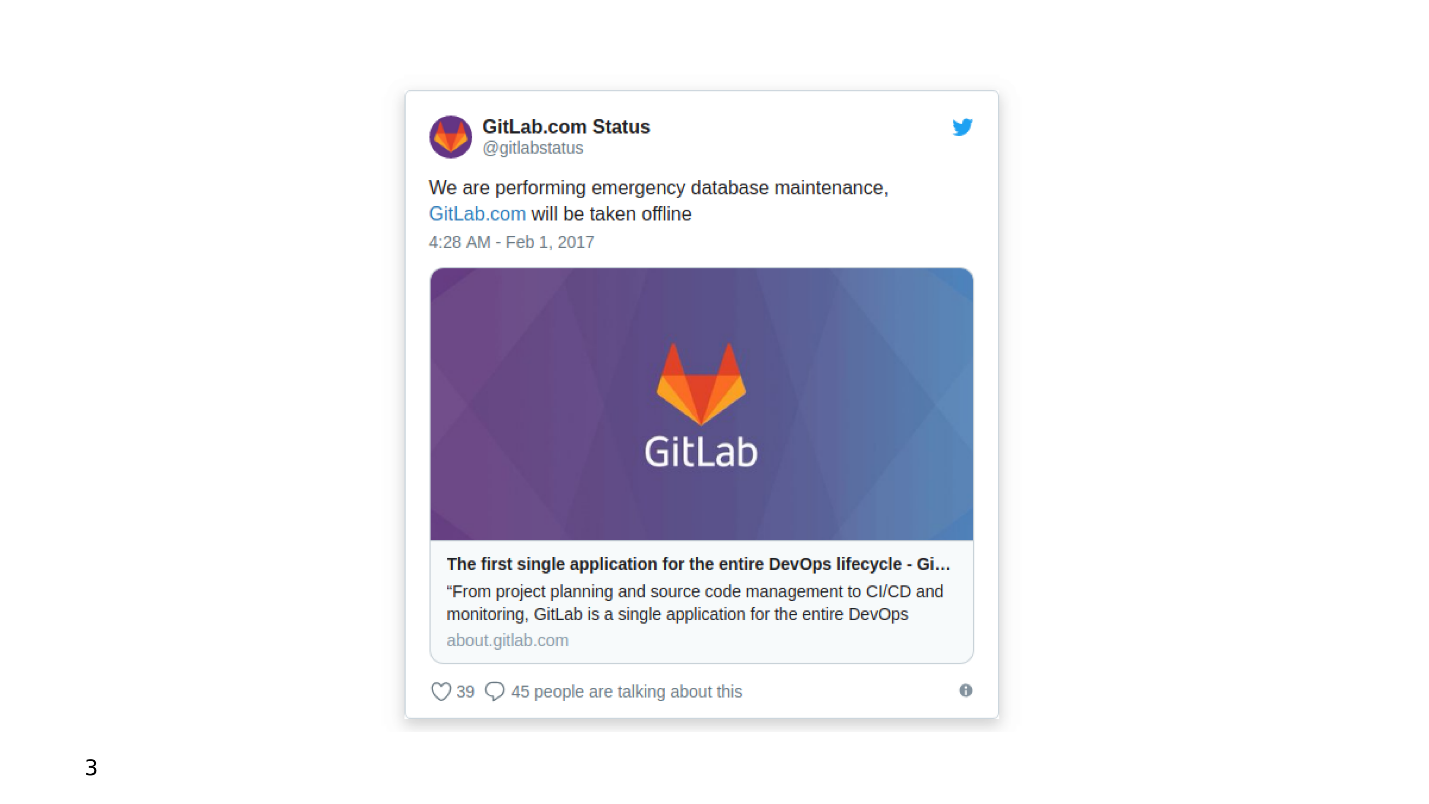
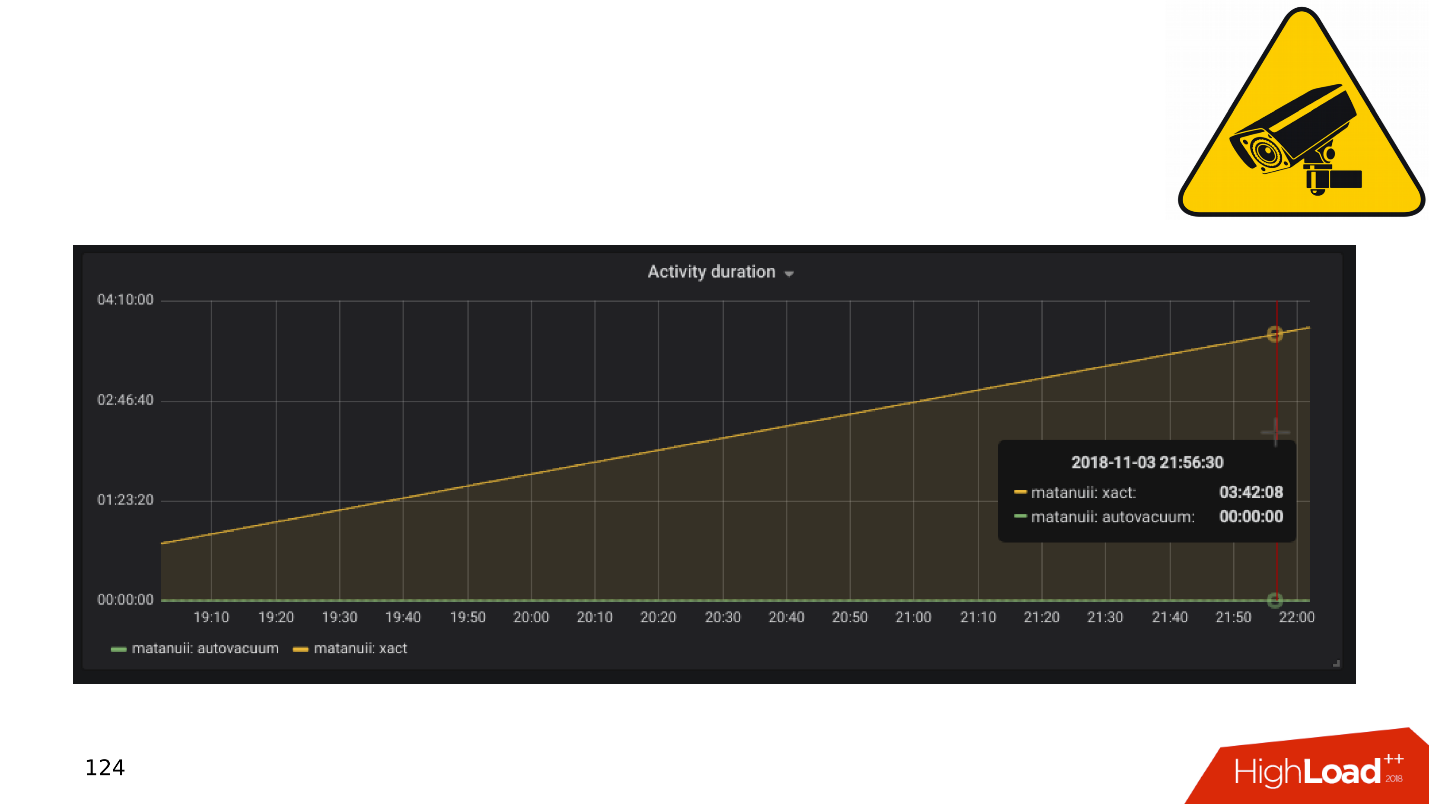
And with replication there are nuances, the most frequent of them is the lag of replication . You can do it like GitLab, and when lag has accumulated, just drop the base. But we have a comprehensive monitoring - we watch it and see long transactions.
In general, transactions that are slow and do nothing result in:
Let's consider a little theory about how these problems arise, and why the mechanism of long and idle transactions (idle transactions) is harmful.
In PostgreSQL there is MVCC - relatively speaking, the database engine. It allows customers to work competitively with data without interfering with each other: readers do not interfere with readers, and writers do not interfere with writers. Of course, there are some exceptions, but in this case they are not important.
It turns out that in the database for one line there can be several versions for different transactions. Clients connect, the database gives them snapshots of data, and within these snapshots there may be different versions of the same row. Accordingly, in the life cycle of the database, transactions are shifted, replace each other, and versions of strings appear that are no longer needed by anyone.
So there is a need for a garbage collector - auto vacuum . Long transactions exist and prevent the auto vacuum from cleaning up unnecessary versions of rows. This garbage data starts to migrate from memory to disk, from disk to memory. It takes CPU and memory resources to store this garbage.
From the point of view of “Who is to blame?”, It is the application that is responsible for the appearance of long transactions. If the base will exist by itself, the long, doing nothing transactions will not take anywhere. In practice, there are the following options for the emergence of idle transactions.
"Let's go to an external source . " The application opens a transaction, does something in the database, then decides to contact an external source, for example, Memcached or Redis, in the hope that it will then return to the database, continue work and close the transaction. But if an error occurs in the external source, the application crashes and the transaction remains open until someone notices and kills it.
No error handling . On the other hand, there may be an error handling problem. When, again, the application opened a transaction, solved some problems in the database, returned to code execution, performed some functions and calculations, in order to continue working in the transaction and close it. When the application was interrupted with an error on these calculations, the code returned to the beginning of the cycle, and the transaction again remained unclosed.
The human factor . For example, admin, developer, analyst, works in some pgAdmin or in DBeaver - opened a transaction, does something in it. Then the person was distracted, he switched to another task, then the third, forgot about the transaction, left for the weekend, and the transaction continues to hang. Base performance suffers.
Let's take a look at what to do in these cases.
Everything becomes even more interesting when there are pending tasks, for example, you need to carefully calculate the units. And we come to the issue of cycling.
Sensitive subject. The business of the application needs to perform background event processing. For example, counting aggregates: minimum, maximum, average, send notifications to users, bill customers, set up a user account after registration, or register with neighboring services — do deferred processing.
The essence of such tasks is the same - they are postponed for later. In the database there are tables that just carry out the queue.

There is a task identifier, the time when the task was created, when it was updated, the handler that took it, the number of attempts to perform it. If you have a table that even remotely resembles this, it means that you have samopisnye queues .
It all works fine until long transactions appear. After this, the tables that work with queues swell in size . New jobs are added all the time, old ones are deleted, updates occur - a table with an intensive record is obtained. It should be regularly cleaned from obsolete versions of the lines so that performance does not suffer.
Processing time grows - a long transaction keeps the lock on obsolete versions of rows or prevents vacuum from cleaning it. When the table grows in size, the processing time also increases, since you need to read many pages of garbage. Time increases, and the queue at some point stops working altogether .
Below is an example of the top of one of our customers, who had a handwritten queue. All requests are related to the queue.
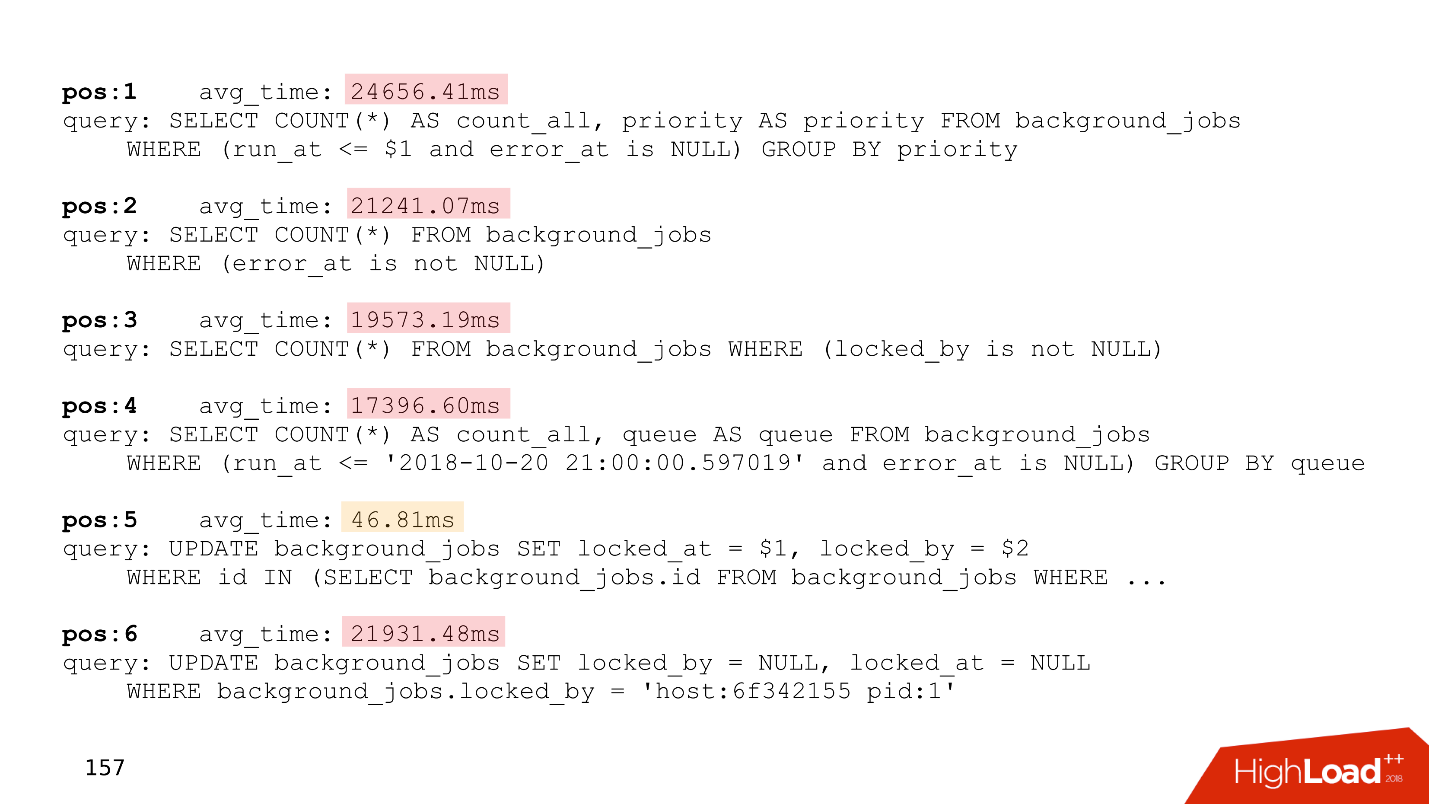
Pay attention to the execution time of these requests - all but one work for more than twenty seconds.
To solve these problems, Skytools PgQ , the queue manager for PostgreSQL, was invented long ago. Do not reinvent your bike - take PgQ, set up once and forget the queues.
True, and he has features. Skytools PgQ has little documentation . After reading the official page, it seems that I did not understand anything. The feeling grows when you try to do something. Everything works, but how it works is not clear . Some kind of Jedi magic. But a lot of information can be obtained in Mailing-lists . This is not a very convenient format, but many interesting things are there, and these sheets will have to be read.
Despite the disadvantages, Skytools PgQ works on the principle of "set up and forget." , , , . PgQ , . PgQ , .
PgQ. , PostgreSQL, , , PgQ . , .
, . , , , - , , , . , , , alter.
auto-failover — PostgreSQL - , , . , auto-failover.
Split-brain . PostgreSQL , , — . , . PostgreSQL fencing, Kubernets . - , . Split-brain.

. GitHub Split-brain, .
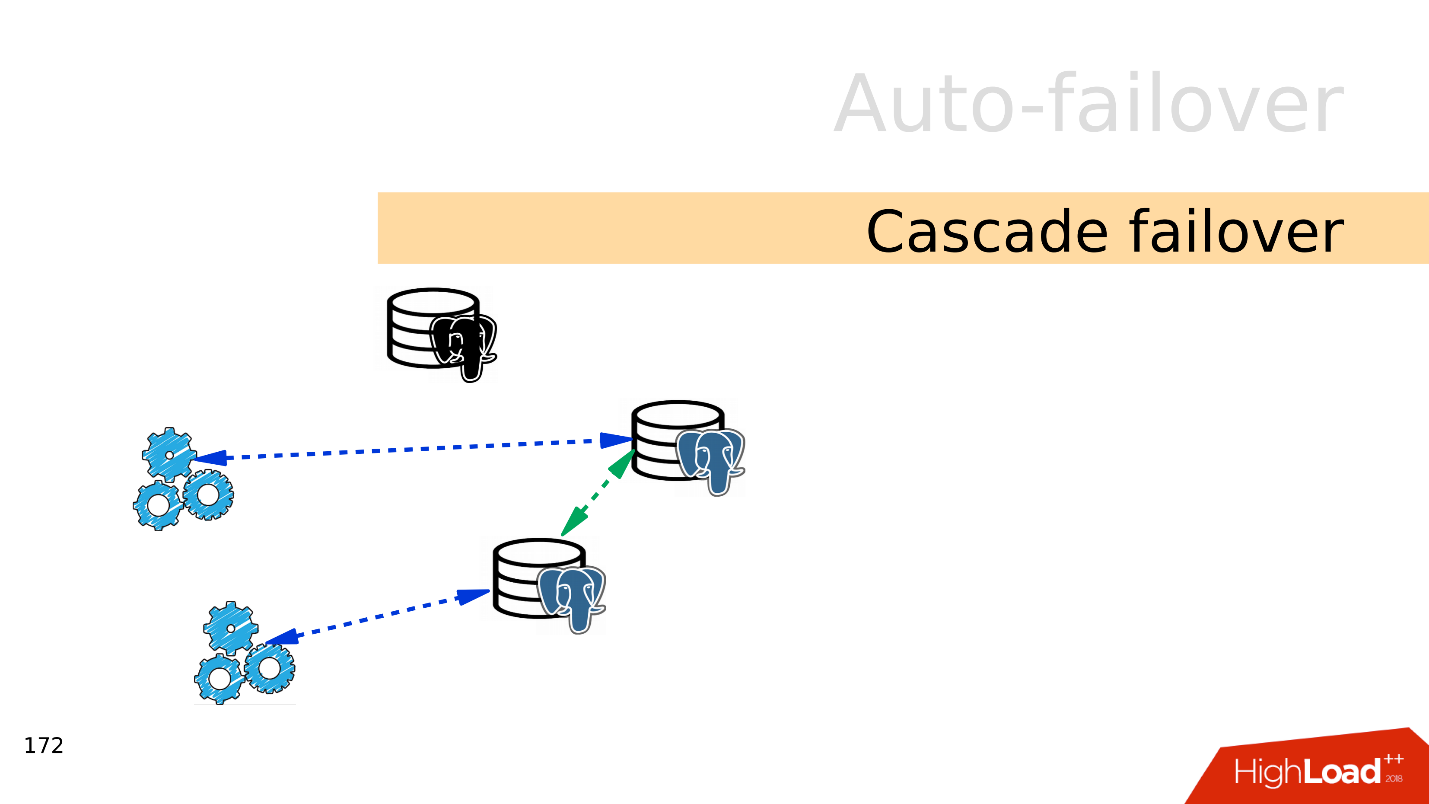
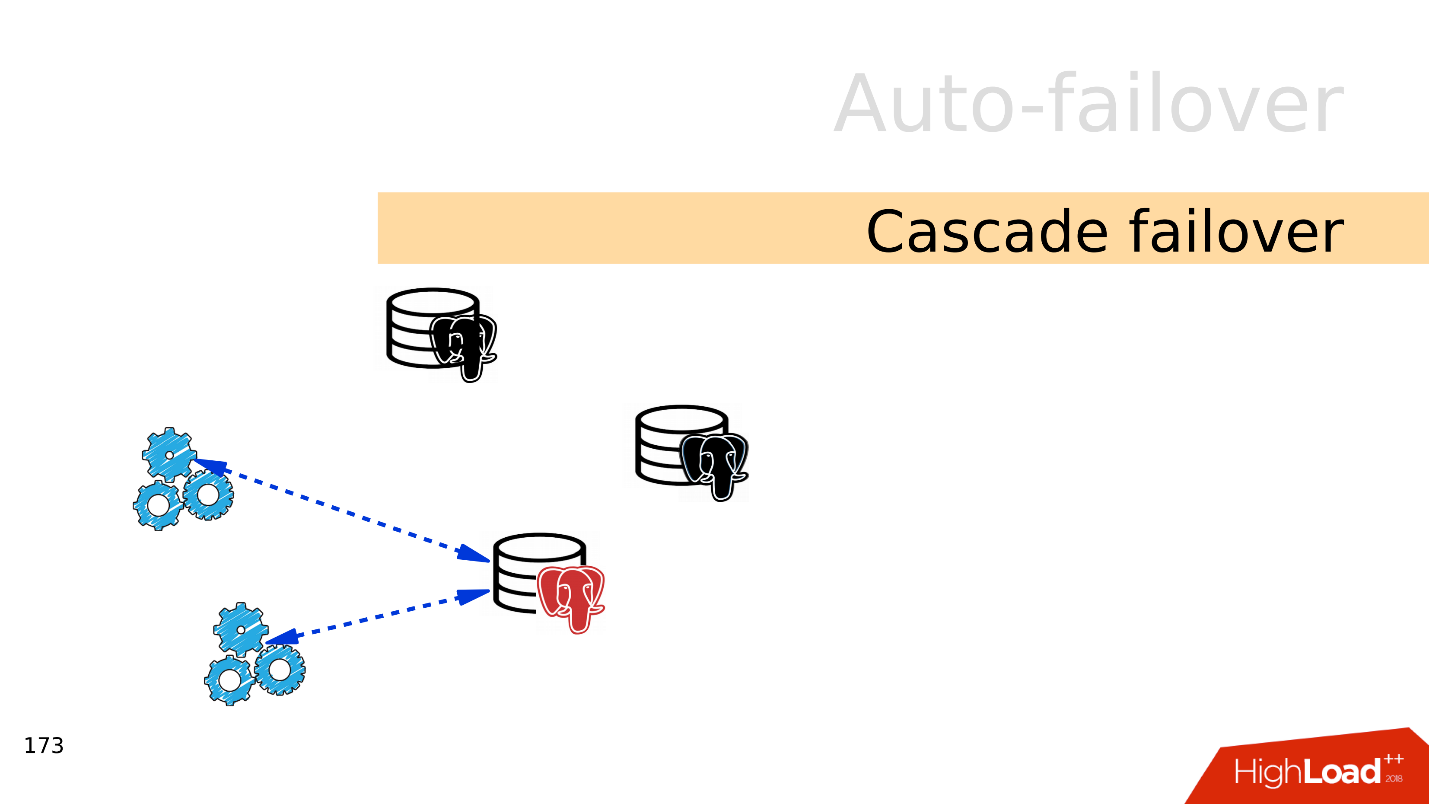
Cascade failover . , . , .
, . , .
— failover.
auto-failover, .
Bash — , . , , . - , , . .
Ansible playbooks — bash- . , , .
Patroni — , , auto-failover, , service discovery.
PAF — Pacemaker . auto-failover PostgreSQL, Pacemaker.
Stolon . Kubernetes, . Stolon Patroni, .
Docker Kubernetes . , .
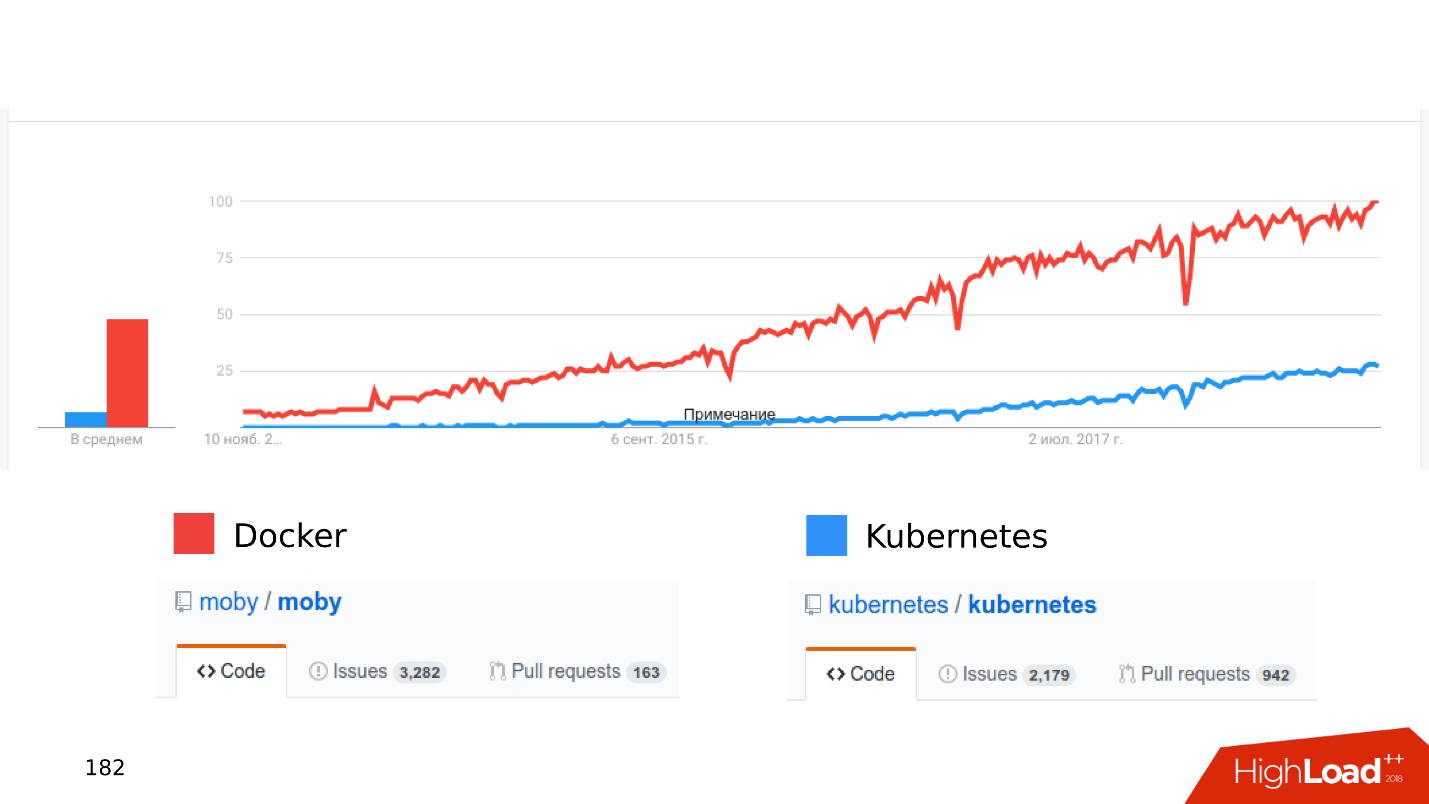
, . « Kubernetes...» .
— stateful , - . Where? . Open Source: CEPH, GlusterFS, LinStor DRBD. , , , .
— . , Kubernetes, CEPH. — . , .
, Kubernetes Docker staging dev- . , , Kubernetes .
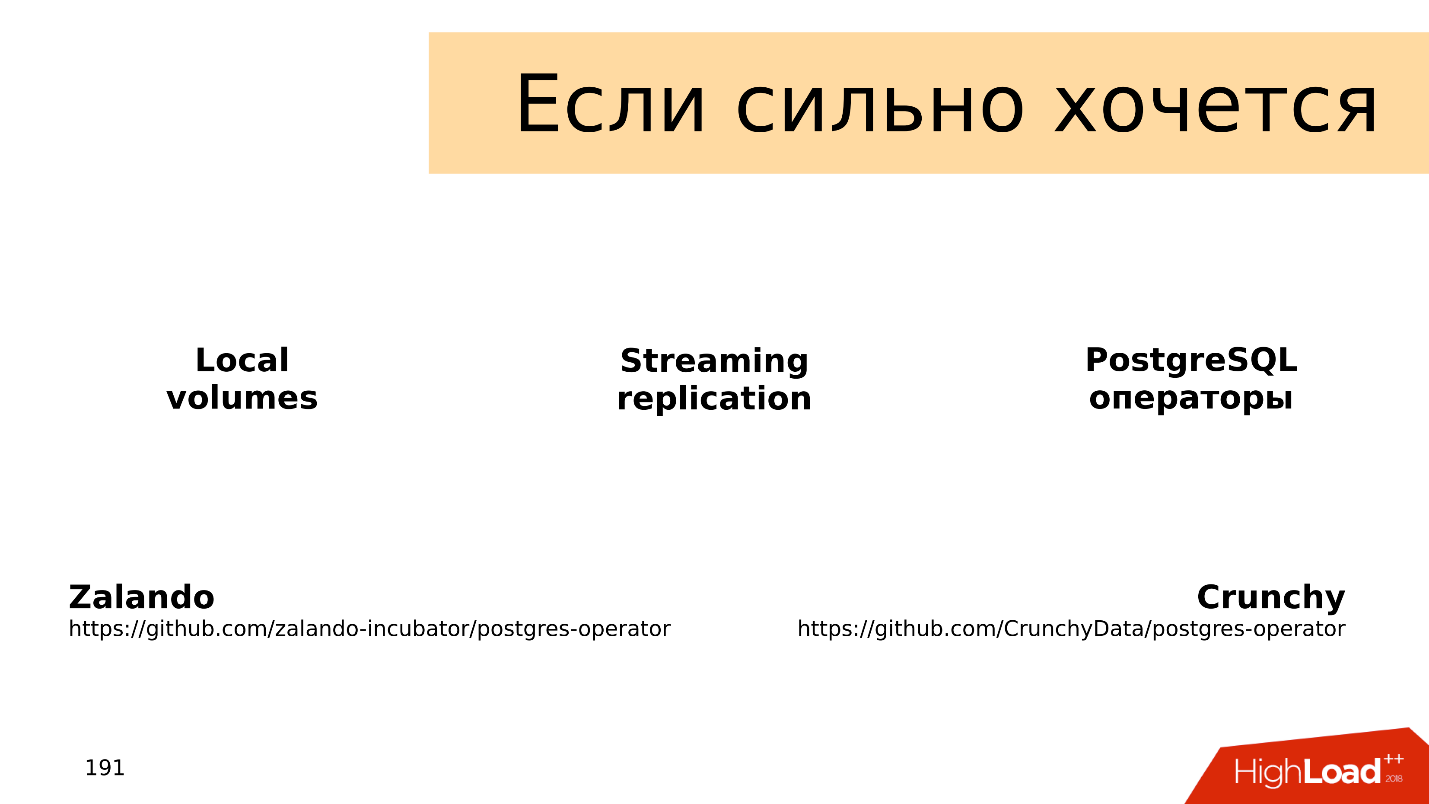
, local volumes — , streaming replication — , PostgreSQL- , — , . : Zalando Crunchy .
, . issues pull requests. , , .
SSD — , .
. JSON 8 — , .
, . PostgreSQL, .
— Postgres is ready . . PostgreSQL , . : streaming replication; publications, subscriptions; foreign Tables; declarative partitioning .
. , .
-, , — . . , Skytools PgQ!
Kubernetes, local volumes, streaming replication PostgreSQL . - , , .
Of course, this will never happen to you, but it is not difficult to check the checklist, and it can save the future nerves very well. Under the cut, we list the top common mistakes that developers make when working with PostgreSQL, let's figure out why you don’t need to do this and find out how to do it.
')
About speaker: Alexey Lesovsky ( lesovsky ) started as a Linux system administrator. From the tasks of virtualization and monitoring systems gradually came to PostgreSQL. Now PostgreSQL DBA in Data Egret is a consulting company that works with a large number of different projects and sees many examples of recurring problems. This is a link to the presentation of the report on HighLoad ++ 2018.
Where the problems come from
For a warm-up, a few stories about how errors occur.
Story 1. Features
One of the problems is what features the company uses when working with PostgreSQL. Everything begins simply: PostgreSQL, data sets, simple queries with JOIN. We take the data, we do SELECT - everything is simple.
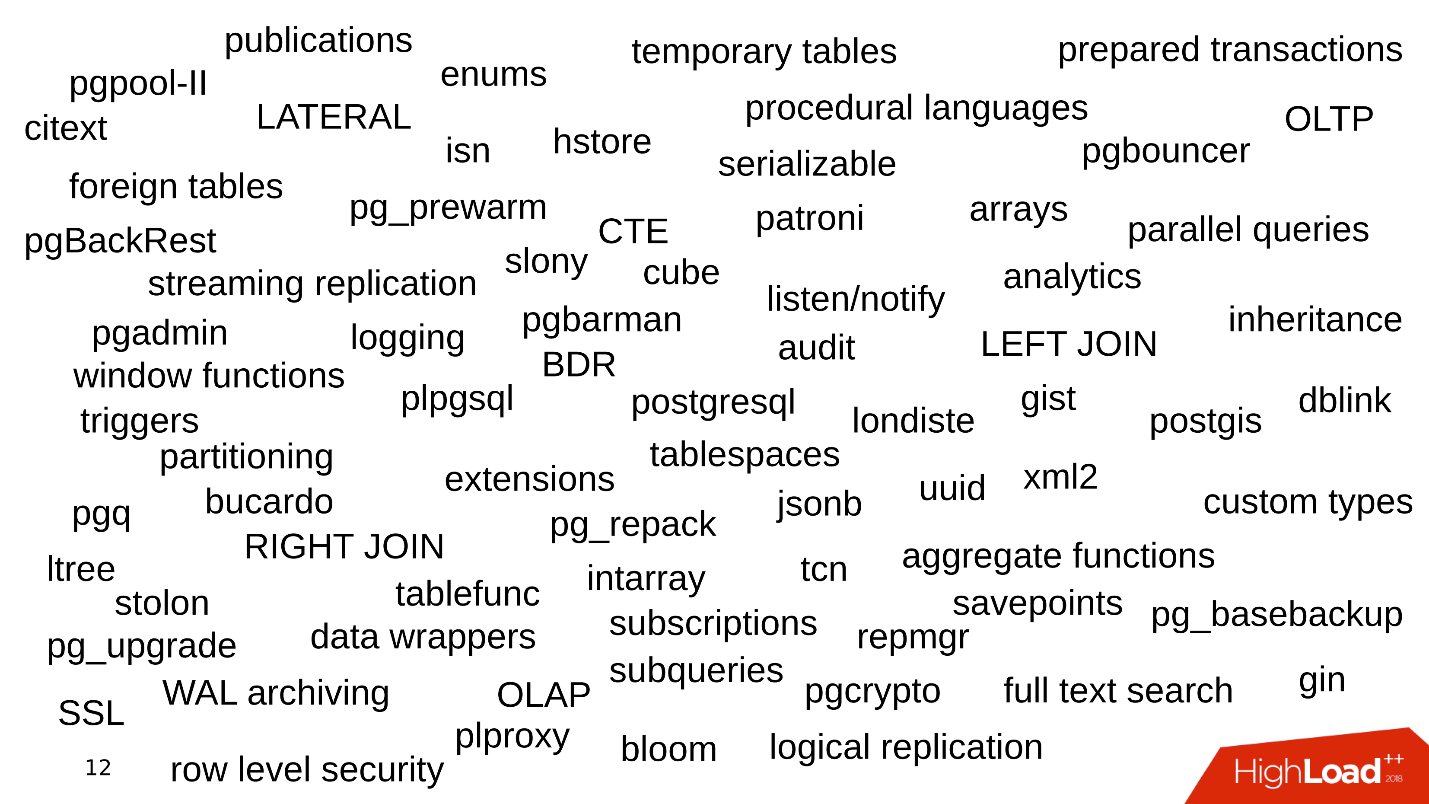
Then we start to use additional functionality of PostgreSQL, we add new functions, extensions. Fitch becomes more. We connect stream replication, shardirovaniye. Different utilities and body kits appear around - pgbouncer, pgpool, patroni. Like that.
Each keyword is an occasion to appear an error.
History 2. Data Storage
The way we store data is also a source of errors.
When the project has just appeared, there is quite a bit of data and tables in it. Simple queries are enough to receive and record data. But then the tables get bigger. The data is selected from different places, there are JOIN. Requests are complicated and include CTE constructs, SUBQUERY, IN-lists, LATERAL. To make a mistake and write a curve request becomes much easier.
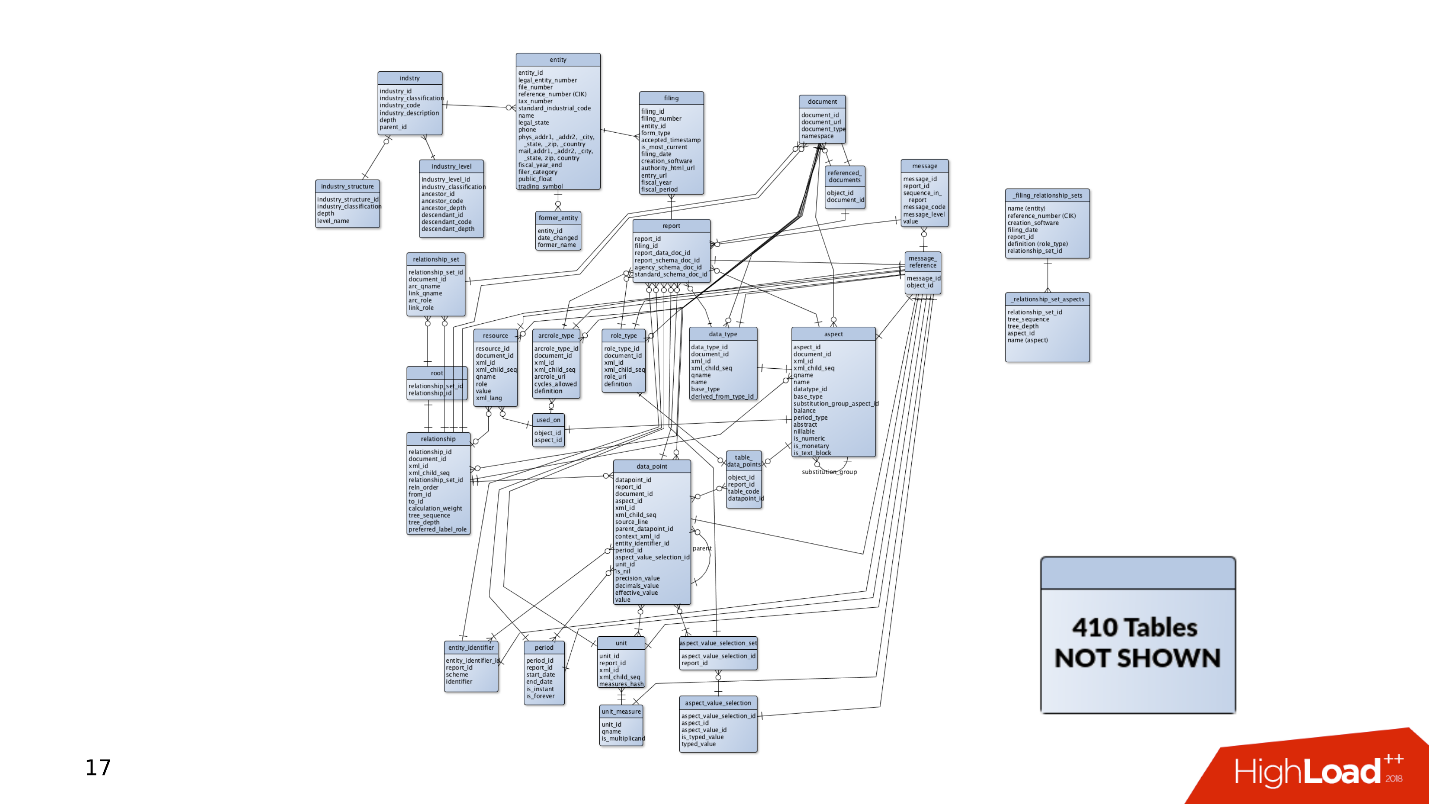
And this is only the tip of the iceberg - somewhere on the side there may be another 400 tables, partitions, from which data is also occasionally read.
Story 3. Life Cycle
The story of how the product is followed. Data always needs to be stored somewhere, so there is always a database. How does a database develop when a product develops?
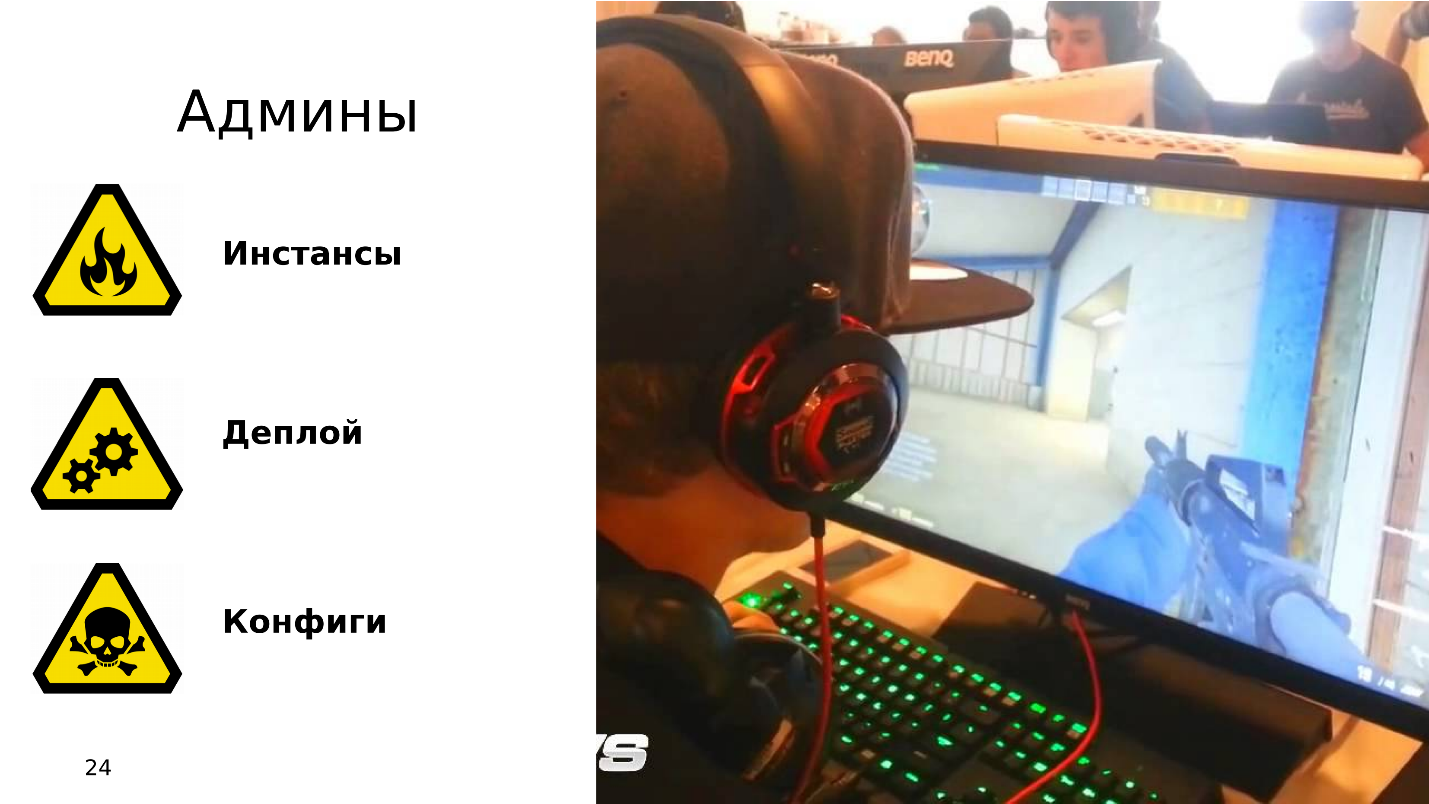
On the one hand, there are developers who are busy with programming languages. They write their applications and develop skills in software development, not paying attention to the services. Often they are not interested in how Kafka or PostgreSQL works - they develop new features in their application, and they don’t care about the rest.
On the other hand - admins . They bring up new instances in Amazon on Bare-metal and are busy with automation: they set up a layout so that the display works well, and the configs so that the services interact well with each other.
There is a situation when there is no time or desire for fine tuning of components, including the database. Bases work with default configs, and then forget about them at all - “it works, don't touch”.
As a result, rakes are scattered in various places, which continually fly in front of the developers. In this article we will try to collect all these rakes into one shed so that you know about them and do not step on them when working with PostgreSQL.
Planning and Monitoring
At first we will present that we have a new project - it is always active development, testing hypotheses and implementing new features. At the moment when the application just appeared and develops, it has little traffic, users and clients, and they all generate small amounts of data. Simple queries work in the database and are quickly processed. No need for large amounts of data, there is no problem.
But there are more users, traffic comes: new data appears, databases grow and old queries stop working. It is necessary to complete indexes, rewrite and optimize queries. There are performance problems. All this leads to alerts at 4 am, stress for admins and management discontent.
What's wrong?
In my experience, most often not enough drives.
First example . We open the disk utilization monitoring schedule, and we see that the free space on the disk is running out .
We look at how much space and what is eaten - it turns out there is a pg_xlog directory:
$ du -csh -t 100M /pgdb/9.6/main/* 15G /pgdb/9.6/main/base 58G /pgdb/9.6/main/pg_xlog 72G Database administrators usually know what this directory is, and do not touch it - it exists and it exists. But the developer, especially if he looks at staging, scratches his head and thinks:
- Some logs ... Let's remove pg_xlog!
Removes a directory, the base stops working . Immediately you have to google how to raise the base after you deleted the transaction logs.
The second example . Again we open monitoring and see that there is not enough space. This time the place is occupied by some kind of base.
$ du -csh -t 100M /pgdb/9.6/main/* 70G /pgdb/9.6/main/base 2G /pgdb/9.6/main/pg_xlog 72G We are looking for which database takes up the most space, which tables and indexes.
It turns out that this is a table with historical logs. We never needed historical logs. They are written just in case, and if it were not a problem with the place, no one would have looked at them until the second coming:
- Let's clean out all that mm ... older than October!
Create an update query, run it, it will work out and delete some of the lines.
=# DELETE FROM history_log -# WHERE created_at < «2018-10-01»; DELETE 165517399 Time: 585478.451 ms The query works 10 minutes, but the table still takes the same place.
PostgreSQL deletes the rows from the table - everything is correct, but it does not return space to the operating system. This behavior of PostgreSQL is unknown to most developers and can be very surprising.
The third example . For example, ORM made an interesting query. Usually everyone blames the ORM for making “bad” queries that read several tables.
Suppose there are several JOIN operations that read tables in parallel in several threads. PostgreSQL can parallel data manipulation operations and can read tables in several threads. But, given that we have several application servers, this query reads all the tables several thousand times per second. It turns out that the database server is overloaded, the disks do not cope, and all this leads to error 502 Bad Gateway from the backend - the database is unavailable.
But that is not all. We can recall the other features of PostgerSQL.
- Brakes of background processes of a DBMS - in PostgreSQL there are all sorts of checkpoints, vacuumes, replication.
- Overhead from virtualization . When the database is running on a virtual machine, there are still virtual machines on the same piece of hardware on the side, and they may conflict for resources.
- The storage from the Chinese manufacturer NoName , whose performance depends on the Moon in Capricorn or the position of Saturn, and to understand why it works that way, there is no possibility. The base suffers.
- Default configurations . This is my favorite topic: the customer says that his base is slowing down - you look, and he has a default config. The fact is that the default PostgreSQL config is designed to run on the weakest teapot . The base starts, it works, but when it already works on a medium-level hardware, this config is not enough, it needs to be tyunted.
Most often, PostgreSQL lacks either disk space or disk performance. Fortunately, with processors, memory, network, as a rule, everything is more or less in order.
How to be? Need monitoring and planning! It would seem obvious, but for some reason in most cases no one plans a base, and monitoring does not cover everything that needs to be monitored during the operation of PostgreSQL. There is a set of clear rules, under which everything will work well, and not “at random”.
Planning
Place the database on the SSD without hesitation . SSDs have long been reliable, stable and productive. Enterprise SSD models have been around for years.
Always plan your data schema . Do not write in the database that you doubt what is needed - guaranteed not needed. A simple example is a slightly modified table of one of our clients.
This is a log table, in which there is a data column with a json type. Relatively speaking, anything can be written in this column. From the last entry of this table it is clear that the logs occupy 8 MB. PostgreSQL has no problem storing records of this length. PostgreSQL has very good storage that chews such records.
But the problem is that when the application servers read data from this table, they will easily clog up the entire bandwidth of the network, and other requests will suffer. This is the problem of scheduling data.
Use partitioning for any hints on history that need to be stored for more than two years . Partitioning sometimes seems difficult - you need to bother with triggers, with functions that will create partitions. In the new versions of PostgreSQL, the situation is better and now the setting of partitioning is much easier - once done, and it works.
In the above example of deleting data in 10 minutes,
DELETE can be replaced with DROP TABLE - such an operation in similar circumstances will take only a few milliseconds.When the data is sorted into partitions, the partition is deleted in just a few milliseconds, and the OS is given immediately. Managing historical data is easier, easier and safer.
Monitoring
Monitoring is a separate large topic, but from the point of view of the database, there are recommendations that can fit in one section of the article.
By default, many monitoring systems provide monitoring of processors, memory, network, disk space, but, as a rule, there is no utilization of disk devices . Information about how loaded the disks are, how much bandwidth is currently on the disks and the latency value should always be added to the monitoring. This will help to quickly assess how the discs are loaded.
There are a lot of PostgreSQL monitoring options for every taste. Here are some points that must be present.
- Connected clients . It is necessary to keep track of what statuses they work with, quickly find “harmful” clients that harm the database, and turn them off.
- Errors . It is necessary to monitor errors in order to track how well the database works: there are no errors — great, errors appeared — an excuse to look at the logs and start to figure out what is going wrong.
- Queries (statements) . We monitor the quantitative and qualitative characteristics of requests in order to roughly assess whether we have slow, long or resource-intensive requests.
For more information, see the PostgreSQL Monitoring Basics report from HighLoad ++ Siberia and the Monitoring page in the PostgreSQL Wiki.
When we planned and monitored everything, we could still face some problems.
Scaling
Usually the developer sees the database line in the config. He is not particularly interested in how it is arranged inside - how checkpoint, replication, and scheduler work. A developer already has something to do - there are many interesting things in todo that he wants to try.
"Give me the address of the base, then I myself." © Anonymous developer.
Ignorance of the subject leads to quite interesting consequences when the developer starts writing queries that work in this database. Fantasies when writing queries sometimes give stunning effects.
There are two types of transactions. OLTP transactions are fast, short, lightweight, and can be performed in fractions of milliseconds. They work very quickly, and there are a lot of them. OLAP - analytical queries - slow, long, heavy, read large arrays of tables and count statistics.
The last 2-3 years often sounds abbreviation HTAP - Hybrid Transaction / Analytical Processing or hybrid transaction-analytical processing . If you have no time to think about scaling and separation of OLAP and OLTP requests, you can say: “We have HTAP!” But experience and the pain of errors show that, after all, different types of requests should live separately from each other, because long OLAP requests are blocked by light OLTP requests.
So we come to the question of how to scale PostgreSQL so that the load is spread, and everyone was happy.
Streaming replication . The easiest option is stream replication . When the application works with the database, we connect several replicas to this database and distribute the load. Recording still goes to the master database, and reading replicas. This method allows you to scale very widely.
Plus, to individual replicas, you can connect more replicas and get cascade replication . Individual groups of users or applications that, for example, read analytics, can be put on a separate replica.
Logical publications, subscriptions - the mechanism of logical publications and subscriptions assumes the existence of several independent PostgreSQL-servers with separate databases and sets of tables. These sets of tables can be connected to neighboring databases, they will be visible to applications that can use them normally. That is, all changes that occur in the source are replicated to the destination base and visible there. Works great with PostgreSQL 10.
Foreign tables, Declarative Partitioning - declarative partitioning and external tables . You can take several PostgreSQL and create there several sets of tables that will store the desired ranges of data. This may be data for a particular year or data collected over any range.
Using the mechanism of external tables, you can combine all these databases in the form of a partitioned table in a separate PostgreSQL. An application may already work with this partitioned table, but in fact it will read data from remote partitions. When data volumes are more than the capabilities of a single server, then this is a sharding.
All this can be combined into spread configurations, come up with different PostgreSQL replication topologies, but how it will work and how to manage it is a topic for a separate report.
Where to begin?
The easiest option is with replication . The first step is to spread the load on the read and write. That is, write to the master, and read from the replicas. So we scale the load and take out reading from the master. In addition, do not forget about analysts. Analytical queries work for a long time, they need a separate replica with separate settings, so that long analytical queries can not interfere with the rest.
The next step is balancing . We still have the same line in the config that the developer operates on. He needs a place where he will write and read. There are several options here.
Ideal - implement balancing at the application level , when the application itself knows where to read data from, and knows how to choose a replica. Suppose an account balance always needs an up-to-date one and needs to be read from a master, and a picture of a product or information about it can be read with some delay and done with a replica.
- DNS Round Robin , in my opinion, is not a very convenient implementation, because sometimes it takes a long time and does not give the required time when switching master roles between servers in failover cases.
- A more interesting option is to use Keepalived and HAProxy . Virtual addresses for the master and the replica set are swapped between the HAProxy servers, and HAProxy is already balancing traffic.
- Patroni, DCS in conjunction with something like ZooKeeper, etcd, Consul - the most interesting option, in my opinion. That is, service discovery is responsible for the information, who is now the master, and who is the replica. Patroni manages the PostgreSQL cluster, performs the switch — if the topology has changed, this information will appear in the service discovery, and applications can quickly find out the current topology.
And with replication there are nuances, the most frequent of them is the lag of replication . You can do it like GitLab, and when lag has accumulated, just drop the base. But we have a comprehensive monitoring - we watch it and see long transactions.
Applications and DBMS Transactions
In general, transactions that are slow and do nothing result in:
- decrease in productivity - not to a sharp jump, but smooth;
- locks and deadlocks , because long transactions hold locks on rows and prevent other transactions from working;
- HTTP 50 * errors on the backend , to errors in the interface or somewhere else.
Let's consider a little theory about how these problems arise, and why the mechanism of long and idle transactions (idle transactions) is harmful.
In PostgreSQL there is MVCC - relatively speaking, the database engine. It allows customers to work competitively with data without interfering with each other: readers do not interfere with readers, and writers do not interfere with writers. Of course, there are some exceptions, but in this case they are not important.
It turns out that in the database for one line there can be several versions for different transactions. Clients connect, the database gives them snapshots of data, and within these snapshots there may be different versions of the same row. Accordingly, in the life cycle of the database, transactions are shifted, replace each other, and versions of strings appear that are no longer needed by anyone.
So there is a need for a garbage collector - auto vacuum . Long transactions exist and prevent the auto vacuum from cleaning up unnecessary versions of rows. This garbage data starts to migrate from memory to disk, from disk to memory. It takes CPU and memory resources to store this garbage.
The longer the transaction - the more debris and lower productivity.
From the point of view of “Who is to blame?”, It is the application that is responsible for the appearance of long transactions. If the base will exist by itself, the long, doing nothing transactions will not take anywhere. In practice, there are the following options for the emergence of idle transactions.
"Let's go to an external source . " The application opens a transaction, does something in the database, then decides to contact an external source, for example, Memcached or Redis, in the hope that it will then return to the database, continue work and close the transaction. But if an error occurs in the external source, the application crashes and the transaction remains open until someone notices and kills it.
No error handling . On the other hand, there may be an error handling problem. When, again, the application opened a transaction, solved some problems in the database, returned to code execution, performed some functions and calculations, in order to continue working in the transaction and close it. When the application was interrupted with an error on these calculations, the code returned to the beginning of the cycle, and the transaction again remained unclosed.
The human factor . For example, admin, developer, analyst, works in some pgAdmin or in DBeaver - opened a transaction, does something in it. Then the person was distracted, he switched to another task, then the third, forgot about the transaction, left for the weekend, and the transaction continues to hang. Base performance suffers.
Let's take a look at what to do in these cases.
- We have monitoring, respectively, we need alerts in monitoring . Any transaction that hangs for more than an hour and does nothing - a reason to see where it came from, and to understand what is wrong.
- The next step is to shoot such transactions through a task in the crown (pg_terminate_backend (pid)) or setting in the PostgreSQL config. Thresholds of 10–30 minutes are needed, after which transactions are automatically completed.
- Refactoring the application . Of course, you need to figure out where idle transactions come from, why they are happening and eliminate such places.
Avoid long transactions at any cost, because they have a huge impact on database performance.
Everything becomes even more interesting when there are pending tasks, for example, you need to carefully calculate the units. And we come to the issue of cycling.
Cycling
Sensitive subject. The business of the application needs to perform background event processing. For example, counting aggregates: minimum, maximum, average, send notifications to users, bill customers, set up a user account after registration, or register with neighboring services — do deferred processing.
The essence of such tasks is the same - they are postponed for later. In the database there are tables that just carry out the queue.
There is a task identifier, the time when the task was created, when it was updated, the handler that took it, the number of attempts to perform it. If you have a table that even remotely resembles this, it means that you have samopisnye queues .
It all works fine until long transactions appear. After this, the tables that work with queues swell in size . New jobs are added all the time, old ones are deleted, updates occur - a table with an intensive record is obtained. It should be regularly cleaned from obsolete versions of the lines so that performance does not suffer.
Processing time grows - a long transaction keeps the lock on obsolete versions of rows or prevents vacuum from cleaning it. When the table grows in size, the processing time also increases, since you need to read many pages of garbage. Time increases, and the queue at some point stops working altogether .
Below is an example of the top of one of our customers, who had a handwritten queue. All requests are related to the queue.
Pay attention to the execution time of these requests - all but one work for more than twenty seconds.
To solve these problems, Skytools PgQ , the queue manager for PostgreSQL, was invented long ago. Do not reinvent your bike - take PgQ, set up once and forget the queues.
True, and he has features. Skytools PgQ has little documentation . After reading the official page, it seems that I did not understand anything. The feeling grows when you try to do something. Everything works, but how it works is not clear . Some kind of Jedi magic. But a lot of information can be obtained in Mailing-lists . This is not a very convenient format, but many interesting things are there, and these sheets will have to be read.
Despite the disadvantages, Skytools PgQ works on the principle of "set up and forget." , , , . PgQ , . PgQ , .
, - — , . .
PgQ. , PostgreSQL, , , PgQ . , .
Automation
, . , , , - , , , . , , , alter.
auto-failover — PostgreSQL - , , . , auto-failover.
Split-brain . PostgreSQL , , — . , . PostgreSQL fencing, Kubernets . - , . Split-brain.
. GitHub Split-brain, .
Cascade failover . , . , .
, . , .
— failover.
auto-failover, .
Bash — , . , , . - , , . .
Ansible playbooks — bash- . , , .
Patroni — , , auto-failover, , service discovery.
PAF — Pacemaker . auto-failover PostgreSQL, Pacemaker.
Stolon . Kubernetes, . Stolon Patroni, .
Docker Kubernetes . , .
, . « Kubernetes...» .
— stateful , - . Where? . Open Source: CEPH, GlusterFS, LinStor DRBD. , , , .
— . , Kubernetes, CEPH. — . , .
- , .
- latency . latency — .
- . Kubernetes , - . , shared storage Kubernetes, . - .
, Kubernetes Docker staging dev- . , , Kubernetes .
, local volumes — , streaming replication — , PostgreSQL- , — , . : Zalando Crunchy .
, . issues pull requests. , , .
Results
SSD — , .
. JSON 8 — , .
, . PostgreSQL, .
— Postgres is ready . . PostgreSQL , . : streaming replication; publications, subscriptions; foreign Tables; declarative partitioning .
. , .
-, , — . . , Skytools PgQ!
Kubernetes, local volumes, streaming replication PostgreSQL . - , , .
. , 24 25 HighLoad++ Siberia , , . 38 — !
Source: https://habr.com/ru/post/455248/
All Articles