Big data in hotel management: use cannot be ignored

source
The long-awaited summer holiday season is approaching, and many have already chosen the most desirable tourist destination, which has given strength to wade through the jungle of deadlines and overtime for months. The cherished “journey of a dream”, which will be so pleasant to later recall in autumn and winter evenings, is already very close.
When choosing a holiday home, many will probably use the Booking.com system. The article proposes to look at the Booking.com system “from the other side of the interface,” through the eyes of those who run the hotel and set prices for accommodation. More specifically, we considered the Booking.com Analytics tools and the possibility of applying the data to sales management at the hotel. As an example, there are cases for a mini-hotel located in Cambodia, which I had the honor and pleasure to manage.
Why cambodia

')
As a short introduction, I will try to explain why the hotel of my dreams ended up in Cambodia. The most important thing is loyal business conditions in this country. Today it is the only country in Asia in which a foreigner can legally register a business in his own name, and at the same time stay in Cambodia unlimitedly on an unlimited business visa. The cost of ALL permits for a mini-hotel, for example, is about $ 400 per year (including a license from the Ministry of Commerce, a license from the local city hall, a tax patent and an individual work permit in the country). When executing the above documents, there are no particular difficulties, and during business checks by government agencies, the availability of permits is a necessary and sufficient condition for avoiding any kind of extortion.
Extra buns are all the pleasures of life in Asia. Affordable prices, non-aggressive population, sea and beautiful nature, warm climate, including a fairly mild monsoon period, year-round fresh fruits, vegetables and seafood, “simple life”, which does not require heating, investment in winter or branded clothes and shoes, in apartment renovation, in expensive cars and other attributes of "successful life".
There are also disadvantages: “fools and roads”, expensive electricity ($ 0.20 per kilowatt-hour), the almost complete absence of medicine and other infrastructural aspects (problems with the work of the police, fire services, education systems, public services, etc. ), problems with garbage (however, this is typical for many Asian countries, and during periods of garbage wars, and for European ones).
On Habré there are several articles ( tyts and tyts ), objectively, in my opinion, reflecting the state of affairs and living conditions in Cambodia, therefore, I will not further develop this topic.
So, Cambodia, the resort town of Kep , the hotel Chateau Puss in Boots , 2019.
Introductory remarks and restrictions
For sales at the moment we use only Booking.com and AirB & B. You can talk a lot about the advantages and disadvantages of these and other services, but in this case it is important that customers come and come to us from these services, but not from others. Before Kep, my wife and I had a hotel in Sihanoukville, and even earlier - in Morjim, in Goa, and there was the same picture through sales channels. AirB & B analytics is still in its infancy, so only Booking.com is considered. And here we have only one main lever of sales management - this is the price per room per night.
Of course, other factors also affect sales. For example, a rating based on guest reviews. Statistics on a rating is present in analytics of Booking.com, and we will consider it slightly below.
Much depends on the tourist situation of the place. Kep , for example, is a small village with a medium-developed resort infrastructure. For many, this is just a transit point on the border between Cambodia and Vietnam. However, the energy of the colonial French Riviera, the sea and islands, mountains and caves, pagodas and national parks are doing their job, and the constant flow of tourists in the season confidently fills the local hotels.
The important moment that influences sales is the concept and the “chips” of the hotel, which help the client to make the right choice and stimulate the intuitive “recognition” of the place where he would be comfortable. This question is connected with the goal setting, mission and worldview of the business owner and is beyond the scope of this article.
In addition, several important assumptions are needed to understand the limitations of the study:
- it will be about a private mini-hotel (among the definitions I found it is indicated that a mini-hotel can have up to 15 rooms), in which there are no corporate procedures, and everything is simplified to the limit in order to reduce overhead costs; therefore, all operating activities are concentrated in the hands of the owners without the participation of any structural units; for example, only a cleaner works in our hotel, my wife and I do everything else with an outsourcing of only complex repair and construction works; if you need to leave for 1-2 days, then there is an agreement with the incoming administrator;
- the structure of the price per room, expenditure part and additional earning opportunities (bar and restaurant, rental of bicycles and motorbikes, sale of tickets and excursions, etc.) is not considered,
- not considered a general approach to hotel management; however, this is an interesting framework, which I wrote about in a slightly different format ; if the topic is of interest, I will also post on the topic of management in a mini-hotel.
Functional Booking.com Analytics
Booking.com Analytics was launched in 2016 as a tool to help hotel managers analyze booking and sales statistics. The system supports the Russified interface, but, in my opinion, it is important to refer to the original source so as not to distort the basic terminology.
Booking.com Analytics includes the following sections:
- Analytics Dashboard aggregates data for a review of performance achieved, including the number of nights booked by room category, income from a room (total amount paid by guests), and Average Daily Rate (ADR), which is income from a room divided by the number of nights paid. ; Analytics Dashboard also contains links to the main reports, briefly discussed below.
- Pace Report allows you to compare your sales on Booking.com with similar periods of the previous year, as well as compare sales with aggregated data by your competitors;
- Sales Statistics provides a slice of sales for any period of the last year;
- Booker Insights provides detailed information about hotel guests, including the country, the device used for booking, and the purpose of the trip;
- Bookwindow Information shows how well Booking.com customers book their rooms in advance;
- Cancelation Characteristics contains information on the percentage of canceled reservations;
- Guest Review Score contains data related to hotel guest reviews and hotel ratings on a 10-point scale given by guests;
- Manage Competitive Set allows you to select up to ten hotels in your region in order to compare your own key performance indicators (Key Performance Indicator, KPI) with your nearest competitor KPI;
- Genius Report shows the percentage of bookings made in accordance with the Genius program (discounts for frequent travelers);
- The Ranking Dashboard demonstrates how effective hotel sales are when guests are looking for accommodation in the region.
For data analysis, date ranges of 7, 14, 30, 60, 90 or 365 days can be selected. In addition, there are additional features for analyzing data by comparing:
- own results with last year indicators;
- own results with indicators of a group of competitors, including up to ten hotels, appointed by choice;
- own results with market indicators, which includes all the objects in the location of the hotel.
Examples of using big data in Booking.com Analytics
This section does not pretend to any generalizations, especially since the picture may change from month to month. These are just examples of using built-in tools for Booking.com Analytics.
For example, in Booker Insights you can see the statistics by countries, tourists from whom book hotel rooms. National features of tourists is a separate topic, which can be discussed for a very long time. Therefore, the statistics on countries is also quite fascinating. Each country has its own preferences, and this affects the distribution of the target audience of the hotel. Although, sometimes there are unexpected statistical outliers. For example, at the height of the tourist season, we got this picture. Our hotel is highlighted by a brighter color, and the market situation is brighter.

Data Booking.com Analytics: Distribution of hotel guests by country
Tourists from Cambodia and France represent about 50% of the tourist market in Kep, however, in our hotel they made up only 15% and 14% respectively. This can be explained by the conservatism of Cambodian tourists who like to stay in hotels managed by Cambodian owners. The same thing is explained by the low percentage of French tourists, many of whom speak poorly or do not speak English at all. Russian tourists also like it when the hotel staff speaks Russian, and this explains why they make up more than 10% of guests against 1.4% of the market. As for New Zealand (10% of bookings at our hotel versus 0.6% of the market) and Swiss (8.7% of bookings at our hotel against 2.4% of the market) of tourists, a higher percentage can be explained by a good price-quality ratio , because tourists from these countries are conservative in terms of avoiding unnecessary costs. The detailed Booker Insights report also contains information divided by country regarding the average daily room rate, average length of stay, and frequency of cancellations. These data are important for predicting the behavior of tourists depending on the country. For example, guests from Cambodia most often cancel reservations.
The following diagram from the Bookwindow Information section provides information on the distribution of the size of the booking window, i.e. how many days before arrival, guests book rooms.
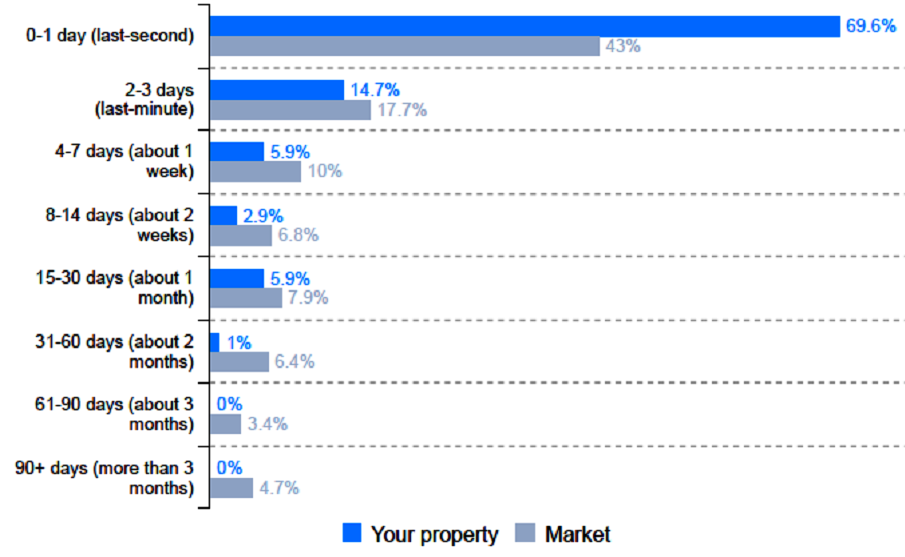
Data Booking.com Analytics: Reservation Window Size Distribution
A large booking window provides more options in terms of determining the daily room rate. In addition, room rates must take into account local and global holidays in order to set holiday prices in advance. Statistics say that only a few guests book a room for more than 30 days. Moreover, about 70% of all bookings were made immediately prior to arrival. This is not very good, as the risk that the rooms will remain unfilled increases, and, moreover, a more careful adjustment of the daily room rate for the actual date is required.
An important indicator affecting any hotel business is the percentage of cancellation of bookings, data on which are available in the section Cancelation Characteristics (see the diagram below). Here, at the top of each of the lanes, our hotel is highlighted in a more vivid color, and the market situation is highlighted by a paler one.
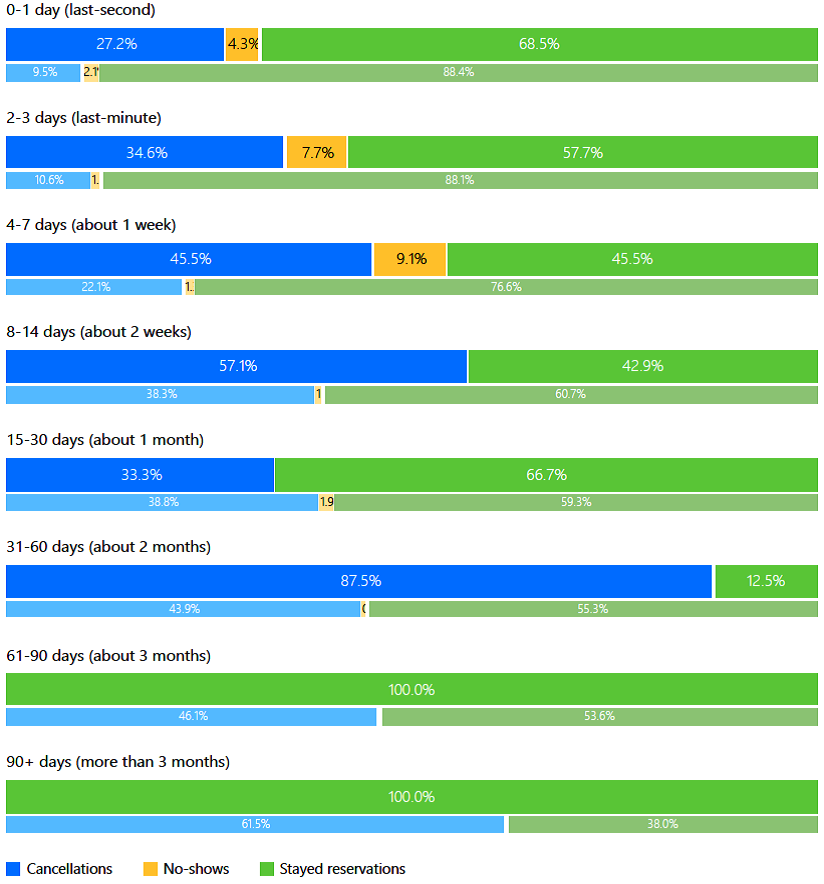
Data Booking.com Analytics: Distribution of frequency of cancellations
Last-minute cancellation is usually stressful, as it significantly reduces the booking window and increases the risk that the canceled room will not be sold out. Unfortunately, for the analyzed example, we have canceled 34% of bookings, while the cancellation rate for the market in question is 28%. Most of the cancellations due to the booking window for more than one month. It is difficult to develop an effective strategy to reduce the number of cancellations. People often change plans, or they may find that the offer of some other hotel is more attractive to them. We try to communicate with the guest as soon as we receive the reservation, but this strategy is also not always successful.
The hotel business is highly dependent on the reputation that is determined on Booking.com based on guest reviews. Grades range from 2.5 to 10 for the following hotel features: cleanliness, comfort, location, facilities, staff, and value for money. Section Guest Review Score contains the details of each of the reviews, and also presents the aggregated values of the hotel rating. The chart presents data on the number of reviews received in each of the months, and the graph shows the final rating value for the results of each of the months. The results of our hotel (a brighter chart and a histogram) are compared with the average results of the ten closest competitors.

Data Booking.com Analytics: Hotel rating based on guest reviews
Booking.com supports the Genius loyalty program. Registered Genius users on Booking.com receive discounts on reservations from 10% or more. To attract Genius travelers, the hotel must support this program. The problem for the hotel is that the price reduction occurs solely by reducing their own income. This means that the price for guests with a Genius status is only 90% (sometimes even 85%) of the stated daily room rate on Booking.com. On the other hand, many Booking.com users participate in the Genius program, and these users appreciate when the hotel supports the program. Thus, the participation of the hotel in the Genius program can increase the total income of the hotel, despite the fact that the daily room rate is reduced. It is important to remember that the daily room rate must take into account the risk of reducing the room rate by 10% or 15% for Genius guests. Genius guests make up more than 50% of all customers, which demonstrates the effectiveness of hotel participation in the program. This information is available in the Genius Report section.
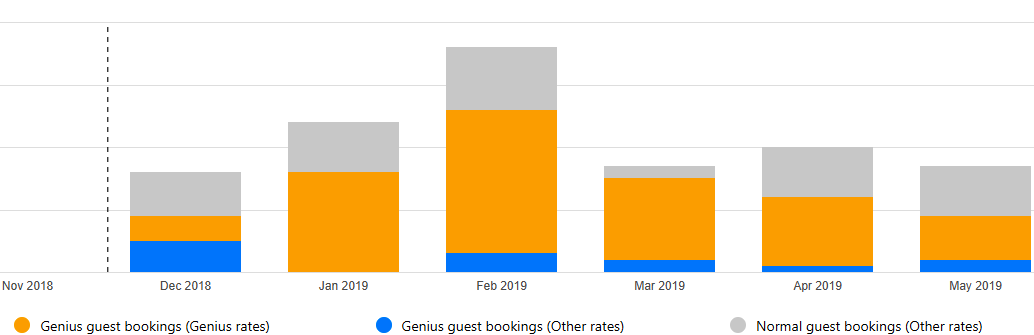
Data from Booking.com Analytics: Genius Reservations Ratio
Integral data on the activities of the hotel are available in the Ranking Dashboard, which presents a number of indicators that, according to Booking.com, affect the hotel’s income.
The data are compared between our hotel and the average result for the market:
- Conversion is the percentage of hotel page views converted to reservations (the ratio of the number of bookings to the number of page views of the hotel on Booking.com);
- Average Daily Rate, the combined income received from the sold numbers divided by the number of numbers sold;
- Cancelations show the percentage of all bookings that have been canceled;
- The Review Score is calculated using guest ratings for the hotel;
- Property Page Score shows how full the hotel page is in terms of information and photos;
- Reply Score takes into account how quickly the hotel responds to guests.
Taking into account the above six factors that may affect the hotel’s income, it makes sense to consider the appropriate dependencies. However, part of the indicators (cancellations, guest rating, hotel page rating, rating answers) can only indirectly affect income. Therefore, it is impossible to find a relationship between hotel income and indirect factors. Promising, in terms of analyzing big data, are the percentage of conversion and the daily price of the number. In the next section, we will consider hypotheses related to the dependencies of income on conversion and the daily price.
Hypotheses for managing the price of a number based on big data
So, using Booking.com Analytics, we have access to big data reflecting the state of sales at the hotel. I would like to understand how the use of these data can help in the formation of the optimal price per room.
Economic science suggests that there are demand and supply curves, and consequently, a certain optimal price that allows you to extract the maximum profit from the sale of a product or service. Errors of the first kind (price increases above the optimum) lead to customers rejecting the purchase, while errors of the second kind (lowering the price below the optimal one) lead to a decrease in profits, and it’s not a fact that the number of sales increases.
Thus, we propose Hypothesis 1 (G1) : There is a relationship between the sales of S numbers and the cost of a room per night C.
Formally, for each calendar day for each of the numbers, this can be described by the following minimax criterion:
S = max (C) ˄ f = 1, where S is the turnover from the sale of a number numerically equal to the cost of living in a room C = {Cmin ... Cmax} (the cost value belongs to a certain range); f = {0; 1} - binary number sale indicator: f = 0 if the number is not sold and f = 1 if the number is sold.
If there are several numbers of the same type, then not all numbers may be sold every day, in addition, the price Ci for the same number may change during the sales window, and the minimax criterion looks like:
S = max ( Ci) ˄ F = fi, where Ci is the price of a single number (the price of a number of the same category can vary), fi = {0; 1} is a binary indicator of the sale of a number, F = {0..N} is the number of sold numbers of one category, the total number which is N.
If the hotel has several categories of rooms, then each of them applies the above criterion, and the total turnover of the hotel is formed as the sum of sales of all categories of rooms, or everything can be reduced to a general formula, if you increase the dimension by adding another index.
Let us analyze the mutual dependence of sales volume and room cost (hypothesis G1 ). I will not give detailed economic data, I will show only a general result. To analyze the relationship between the two data series, we use the Pearson correlation coefficient, calculated as the ratio of the covariance to the product of the standard deviations:

MS Excel is used for calculation, in which monthly hotel records are kept. Therefore, the correlation coefficient is convenient to count by the month. It is recommended that the number of observations is not less than 10 times the number of factors, and the number of days (observations) per month fits into this recommendation. We launched the hotel literally before the New Year 2019, so for June 2019 we have accumulated statistics for only 5 months (150 days of observation). The month of the month is different, and the values of the correlation coefficient vary considerably, from 0.51 in March to 0.93 in February. This means that in some months the hypothesis G1 is not confirmed, and there is no connection between the cost of the number and the volume of sales. However, for those months in which r> 0.75, one can speak of the existence of a dependence of one random variable on another, i.e. G1 hypothesis is confirmed. It is best to analyze the entire set of data, because if we have the number of observations hundreds of times greater than the number of factors, then we are approaching the law of large numbers. For five months, hypothesis G1 was also confirmed (r = 0.80). Below are the values of the correlation coefficient for each of the past months of the current year, as well as the integral value for 5 months. Let me remind you that we investigate the dependence of the value of daily sales on the value of the average room rate for the given day.
The values of the correlation coefficient r (S, C)

Obviously, the sales volume depends on the number of sold numbers. However, no correlation could be found between the number of numbers sold per day and the average daily cost of a number (r = 0.51 for the entire data sample).
MS Excel can also build a scatterplot, add a graph and a linear regression equation to it, and determine the accuracy of the approximation R 2 for the regression. Regression can give reliable results if R 2 > 0.8 for it. For the full sample, this reliable regression could not be obtained, since the accuracy of the approximation was R 2 = 0.64. However, this is possible for those months when r> 0.9. For example, for February we got R 2 = 0.86. February is notable for the most significant sales volume of the year due to the Chinese New Year, which lasts more than a week and ensures full occupancy of the hotel at elevated holiday prices.
Linear regression does not make sense in terms of optimization, since it says that the higher the price, the higher the profit. However, the price should be in a reasonable range, comparable to the price of the closest competitors.
From the point of view of sales management, the most critical is the area in which daily sales were less than 30 USD, and it is especially critical when sales were 0 USD. However, our statistics do not give an answer to the question, what value of the daily price is optimal, since at a price in the range of 12 to 20 USD sales ranged from 0 to 6 numbers per day, and this did not depend on other calendar factors (for example, the day of the week or the approach of holidays).
Another assumption is that the more tourists are looking for accommodation in your area and the more tourists browsing your hotel page, the more reservations you will receive. Booking.com Analytics provides such data. For example, in the diagram below, the search results for the city of Kep (Cambodia) are broken down by day. Conversion is 132/79 377 = 0.16%, that is, for 10,000 tourists seeking accommodation, we get 16 bookings.
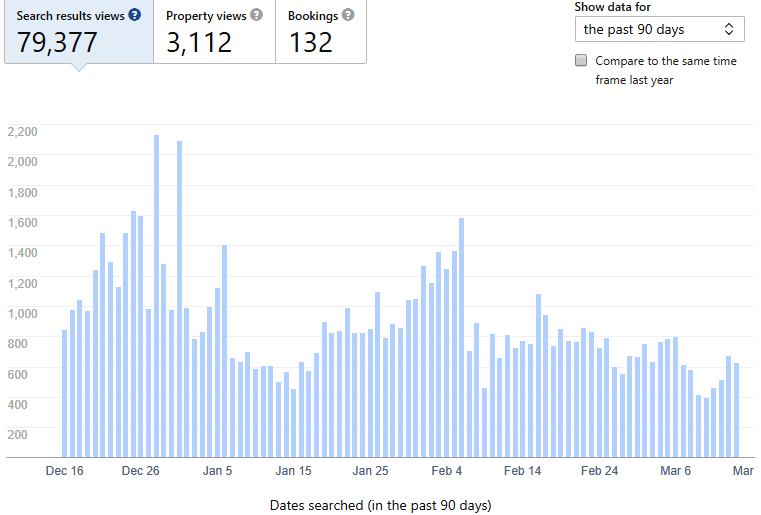
Data Booking.com Analytics: the number of searches for the region
We formulate Hypothesis 2 (H2) : There is a relationship between the sales of S numbers and the number of search queries per day R.
However, the correlation coefficients obtained for both a full sample of data for 5 months and monthly did not exceed 0.5, which indicates the absence of a relationship between two random variables. This applies both to the number of searches in the region, and to the number of page views of the hotel on Booking.com.
Conclusion
The article discusses the capabilities of Booking.com Analytics tools for analyzing big data related to sales of hotel rooms. Based on the available information, two hypotheses were put forward.
Hypothesis 1 (G1) was confirmed: There is a relationship between the sales of S numbers and the cost of a room per night C.
To analyze the hypothesis reliability, the Pearson correlation coefficient r (S, C) was determined for the data for the first five months of 2019 (r = 0.80) and monthly (maximum value r = 0.93 in February), which indicates that there is a relationship between the two in rows of data. The regression is linear (the higher the price, the higher the profit), which makes it impossible to optimize the value of the daily room rate. However, the price per day should be within a reasonable range, comparable to the price of the closest competitors. It was also not possible to determine the optimal value of the room rate by a numerical method, based on a scatterplot.
Hypothesis 2 (H2) was not confirmed: There is a relationship between the sales of S numbers and the number of search queries per day R.
Despite the availability of big data, at the moment it is not possible to form a sales management strategy based solely on statistical indicators. Perhaps these patterns depend on such energies over which statistics do not have power. The wave theory of business is known, and, from my point of view, it makes sense. If we construct a simple dependence of the sales volume on the calendar date, we will clearly see alternating peaks and dips. Thus, it is necessary to “catch the wave”, using, among other things, experience and intuition.
This article does not claim to be the ultimate truth, it’s just my experience that I wanted to share.
And I can only wish the readers maximum enjoyment from the use of booking services and unforgettable travel!

Source: https://habr.com/ru/post/455202/
All Articles