Solve decision-making tasks based on data.

Now many and very many people (usually called analysts, but in general this can be any kind of specialty) prepare various beautiful tables and graphs, on the basis of which important decisions should ideally be made.
Concepts that begin with the words Data Driven, now on hearing.
But decisions are not always made on the basis of data. And sometimes there are objective problems with making decisions.
')
There is enough material on how to generate good data, store and beautifully enough.
Anyone who wants to practice a little in making decisions based on somehow received and somehow decorated data - welcome under cat.
Before the start
We will make decisions on the basis of tasks (“cases”).
It's simple:
- Context (who are we? Where are we? What do we want?),
- Given (data set, what is, such is),
- Variants of decisions which can be made on their basis,
- Information for consideration
- Possible answers with comments.
The level of complexity of all tasks - at the level of Captain Obvious. The task is not to build a “theory of everything”, but to talk in terms of decision making based on data.
These exercises are recommended.
- to analysts as an entertainment read,
- decision makers as a light workout
- and also to those who need an urgent discussion of the candidate in an hour, and the tasks “about gnomes” cause bewilderment and / or disgust.
No special programs were used to create this article; any part of this article can be used by anyone for any legitimate purpose.
And a few more simple but important thoughts:
- Any example taken out of the context of a particular business model may be unsuccessful and even completely wrong.
- I strongly recommend treating all examples as a learning tool, and not as a recommendation for action in the real world.
- even with a slight change in the wording of the conditions and the goals set in advance, the recommended solution may change (and we will see)
- there are no “correct” answers for most of the tasks, at the end of each task there will be thoughts and only possible solutions
- and, of course, all the data are random numbers that have no relation to any real indicators, all the similarities are coincidences
And now - let's go.
Task number 1
ROI
Context
Imagine that you have money. And you invested this money in assets.
Perhaps this is your online store and then assets are marketing channels. Perhaps you are a venture investor and then the assets are any startups. There may be many options.
It is important that you have invested money with a clearly stated goal - to pay off in 1 calendar year.
This year has passed, and it's time to look at the financial result.
It looks like this:

Monthly average figures are given in order not to take into account the different seasonality of assets.
And an additional schedule:

ROI - (return of investments) is an indicator of investment efficiency, counted as (revenue-costs) / cost. If ROI = 0, then we are “zero”, if ROI> 0, then we are “positive”, i.e. earned more than they spent.
Let's pretend that
- our market is stable, i.e. he is not thrown up and down (suppress a nervous laugh, a training example)
- a well-established market, no tectonic shifts (for example, from offline to online) occur,
- the market is big enough
Task statement
Specify the number of assets in which you would invest with a similar purpose for the next year.
Information for consideration
Watch if you are ready
A stable large market assumes that the situation will not change much from year to year.
In tasks at this level of detail it is logical to assume that the costs for the next year in each asset will be about the same.
In tasks at this level of detail it is logical to assume that the costs for the next year in each asset will be about the same.
Possible answers
Watch if you are ready
Answer 1:
If the level of complexity is declared as “captain obvious”, then we neglect everything and stupidly indicate all the assets that have paid off, i.e. from which ROI> 0:
1,2,5,9,10,11,12
Answer 2:
Year for a year is not necessary, you can invest in assets with a light minus, perhaps next year will be better. In addition to 1,2,5,9,10,11,12 you can add 3, 6,7,13,14
Answer 3:
Let's go back to the first schedule (income and expenses), look at it and understand that in terms of expenses, our assets are divided into 3 categories: expensive, medium and cheap.
Other things being equal, it makes sense to invest in cheaper assets. The risks (the probability of losing the investment) are the same, but we risk smaller amounts. The assets with numbers 3, 7 and 14 have the same ROI (-4%). Of these, it is better to take the number 14 in the portfolio (we take risks with smaller amounts).
Problem number 2
Effectiveness of the action
Context
Now let's imagine that we have not just money, but some kind of stable business. For example, an online service for the sale of services ( tutors, barbershop, any blog that hosts ads, anything ). We have a subordinate marketer. He decided to conduct a marketing campaign in October. You insisted that the action should have a clear goal.
After discussions, we formulated it as simply as possible: make money right now. ( A rare case in real life, most often the goal is to make money sometime afterwards, to stimulate repeat sales, tie to the brand or eliminate stock balance ).
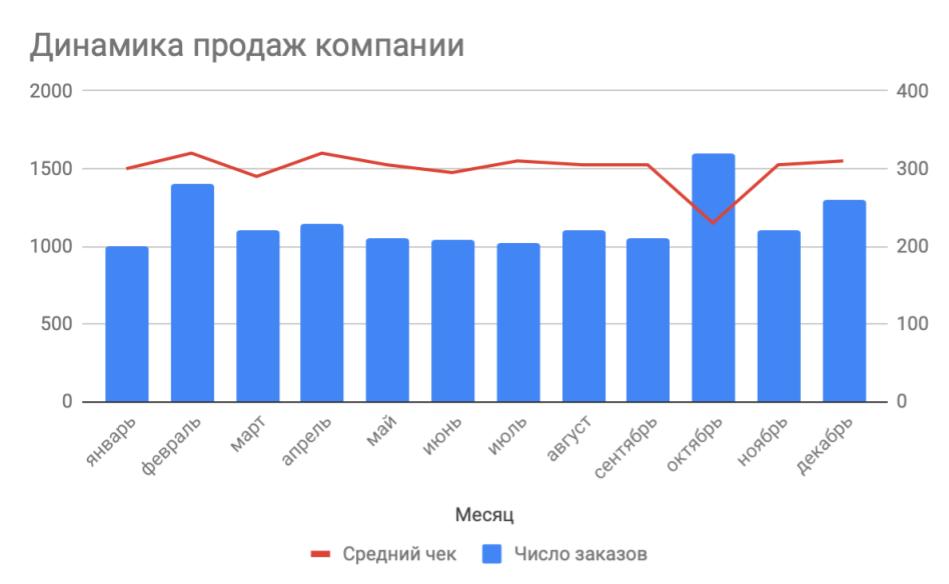
According to the results of the promotion, we see the following sales schedule:
Let's assume that we are “in the market” with respect to our competitors in terms of price and quality, our sphere is quite large, stable and did not appear yesterday, there have not been major external changes in recent months. In addition, there are no changes in the structure of goods sold.
Your actions?
1. Dismiss the marketer
2. Leave the marketer without premium
3. Give the marketer a standard premium.
4. Give the marketer a double premium.
5. Not enough data to make a decision.
Information for consideration
Watch if you are ready
Evaluate the actions of a marketer need to achieve the goal.
Services (as opposed to the classic “buy cheaper, sell more expensive”) suggest a business model where the cost of services can be neglected.
In contrast to real life, in this example we do not know the specifics of the business, and it may be important. But often with the specifics can be found using the data, the main thing to ask a question correctly.
Possible answers
Watch if you are ready
In order to evaluate the effectiveness of the action, we need to be sure that the reason for the growth in sales is precisely our actions in marketing.
There is a version that the usual sale works here (dropped prices - increased demand), but there is not enough data to confirm this thought.
Additionally, the stated conditions exclude such a change in demand as an expected change in demand (for example, fashion) or the actions of competitors.
But it is quite possible that in October we may have a natural seasonal growth (a small peak in demand in February with rising prices shows that this is possible).
therefore
5. There is not enough data to make a decision - we want to know the seasonality.
Ideally, there would be more - similar graphics for our main competitors (to dream, of course, is not harmful, okay, we can do without this information).
Comments
We see a “zero” on the vertical axis on the graph, i.e. There is no manipulation of the scale.
The values that affect revenue (sales and average bill) are reflected in one graph, which means it is easy to see their interaction. Scenarios where one value decreases with the growth of another are sufficient. On two graphs alongside, less obvious cases could be invisible.
In the current task, we are not interested in exact figures, but in dynamics, therefore there is a minimum of captions on the graphs.
Task number 2a
The effectiveness of the action (and we are given seasonality)
Context
All the conditions of the previous task remain in force, but we are given the data for the last year and, as a bonus, the gains:
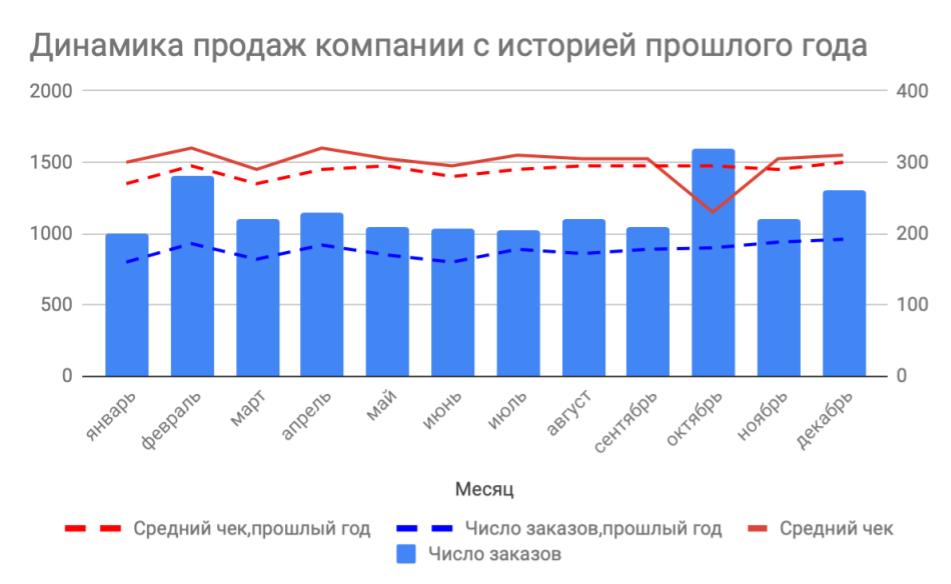
Orders:
growth
- to the same month last year: + 77%
- to last month: + 52%
Average bill:
growth
- to the same month last year: -22%
- to last month: -25%
Your actions?
1. Dismiss the marketer
2. Leave the marketer without premium
3. Give the marketer a standard premium.
4. Give the marketer a double premium.
5. Not enough data to make a decision.
Information for consideration
Watch if you are ready
Seasonality is clearly there, albeit small. Clearly there is no peak seasonality in October.
Other significant factors besides marketing action are hard to come up with (although it is possible).
Other significant factors besides marketing action are hard to come up with (although it is possible).
Possible answers
Watch if you are ready
To remove all doubts, one would, of course, want to do an A / B test, but this is not always and not always possible. And even more often not justified (the benefits of accurate information may be less than the loss of time on the test itself).
By the way, in this case we don’t even need a history of past marketing campaigns. If we saw sales growth in October (especially with falling prices) - it is logical to assume that last year there was already a similar action at the same time.
In real life, the history of sales last year is usually much easier to obtain than the history of changes in the product, large promotions in the past, etc.
So, the reason for the growth is the change in price.
Because we neglect the cost price; a successful action is such an action with which we have earned more in comparison with the situation when we would not do anything.
You can calculate the exact values, or you can simply compare the growth of checks and falling prices. In this case, we see that our revenue has increased this month (sales have grown more than the average check has decreased), so the action is successful.
You can choose one of the options.
2. Leave the marketer without a premium (“He just did his job”)
3. Give the marketer a standard premium (“Some percentage of additional revenue”)
4. Give the marketer a double premium (“Wow! Marketing works! But it’s not a shame to pour it out of your heart”)
depending on prior arrangements and our management style
Comments
When everything is clear with trends and something needs to be accurately calculated, it is better to give specific figures in an explicit form, rather than read them from the graphs.
As a bonus to this task, we see the inflation rate for the year: this is the average difference between the average check of the current and last year (excluding the action month).
Task number 3
The effectiveness of the action (and we have a different business model)
Context
All the conditions of the previous task remain the same, but we do not sell services, but goods. (Bought cheaper - sold more expensive).
Orders:
growth
- to the same month last year: + 77%
- to last month: + 52%
Average bill:
growth
- to the same month last year: -22%
- to last month: -25%
Your actions?
1. Dismiss the marketer
2. Leave the marketer without premium
3. Give the marketer a standard premium.
4. Give the marketer a double premium.
5. Not enough data to make a decision.
Possible answers
Watch if you are ready
There is no cost here without cost.
5. Not enough data to make a decision.
5. Not enough data to make a decision.
Comments
Changing one word in a problem statement leads to a completely different solution. Details can often be important.
Task number 3a
The effectiveness of the action (and we have a cost)
Context
All the introductory tasks of the previous task remain, a dynamic costing schedule is added ( suppose that it takes into account storage costs, currency fluctuations, shrinkage, etc. ).
According to the results of the promotion, we see the following sales schedule:

Orders:
growth
- to the same month last year: + 77%
- to last month: + 52%
Average bill:
growth
- to the same month last year: -22%
- to last month: -25%
Your actions?
1. Dismiss the marketer
2. Leave the marketer without premium
3. Give the marketer a standard premium.
4. Give the marketer a double premium.
5. Not enough data to make a decision.
Possible answers
Watch if you are ready
1. Dismiss the marketer (“we are in the red, dismiss!”)
2. Leave the marketer without a premium (“we recognize the experiment as unsuccessful, solve the problems of internal communication and move on”)
Sales “in a minus” at inconsistency of departments is a big trouble. Most often, such shares are more likely to re-sell.
Perhaps the number of lines on the current chart is the maximum that you can afford without losing readability.
2. Leave the marketer without a premium (“we recognize the experiment as unsuccessful, solve the problems of internal communication and move on”)
Comments
Sales “in a minus” at inconsistency of departments is a big trouble. Most often, such shares are more likely to re-sell.
Perhaps the number of lines on the current chart is the maximum that you can afford without losing readability.
Task 4
Summing up the A / B / C test
Context
Imagine that we have a good money-generating business for which we are not ashamed: we have many loyal customers. For example, we have an online store and there is a subscription with a catalog of goods to which a large audience is legally and ethically subscribed. They see in their mailbox a letter from their favorite brand, open it, look at descriptions of goods (stocks, special offers - well, something), at the end of the letter there is a “Buy” button (neutral color like a normal button in the interface) after clicking on which go to the site. There you can already buy something.
The product team had the idea to raise sales by changing the color of the button ( we were lucky again, not psychology, not brand attachment, not long-term forecasts, but sales here and now ). We decided to conduct a test: we divided all our loyal ( who gave consent to the processing of personal data and advertising newsletters ) audience into three groups: control (in which approximately 90% of the audience) and two experimental, with green and red button (approximately 5%).
We are waiting for a fixed time and look at the following test results:
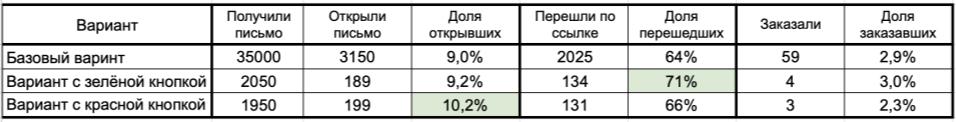
Green highlights those results where the test result is statistically better than the baseline. If it were statistically worse somewhere, it would be highlighted in red.
Because some of the results may cause skepticism, a few proofs from an independent source (one of the many A / B tests online calculator www.evanmiller.org/ab-testing/chi-squared.html ):
Screenshots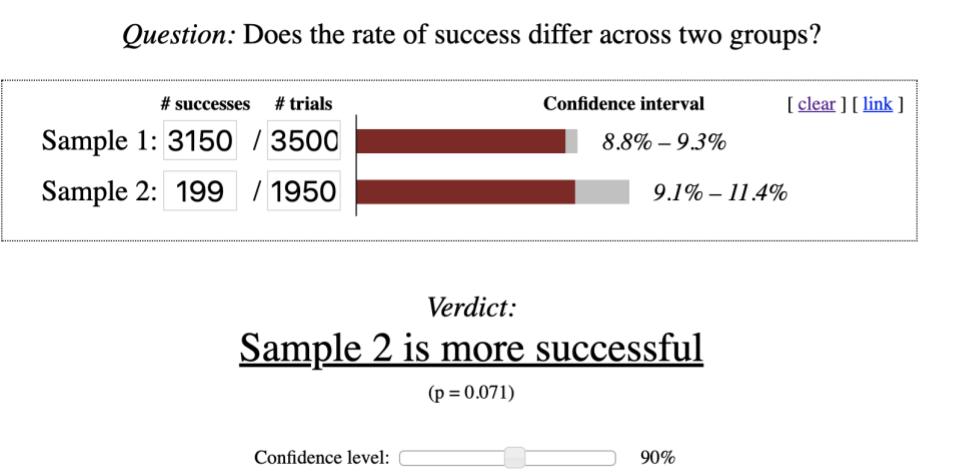


Your next steps
1. Conduct an A / A test
2. Leave the base case
3. Put the option with a green button
4. Put the option with a red button
5. Continue the ABC test in other proportions.
6. Not enough data to make a decision.
Information for consideration
Watch if you are ready
Conducting an A / A test is the same A / B test, in which two parts of the audience are shown the same thing. Of course, the results should be statistically insignificant. If this is not done, we obviously have problems in conducting the test.
The testing mechanism may be imperfect.
The mechanics of the mailing list in this task is important.
Sometimes care is also needed.
The testing mechanism may be imperfect.
The mechanics of the mailing list in this task is important.
Sometimes care is also needed.
Possible answers
Watch if you are ready
At the time of opening the letter, the user does not see the button. Therefore, a statistically significant result on the red button is something unimaginable. Either we have poorly divided users (“bad random”), or the letter has what difference not only in the button, but somewhere else (sending time, sending segment, title, “unequal test”), or 90% significance level for we are insufficient (“we are unlucky”). It is best to conduct an A / A test.
The significant result of the red button is not really about the button. But the green began to press better. This did not affect sales, because sample is small. But the business is not waiting, it is necessary to roll out some kind of result, so we put the green button and move on.
We need sales. There are cases where a high conversion per click leads to low sales (for example, when we promise something good for a penny, and reality turns out to be worse or significantly more expensive). It seems this is not our case, just the color of the button. But in some areas (traffic exams, football, garbage processing, etc.), green can cause unexpected associations and theoretically bring down sales. Because we cannot objectively estimate sales for such samples, it is necessary to continue the test in other proportions: give 90% to the green button, 5% to the red button and the control group.
Comments
The example with the color of the button is very theoretical. Although sometimes small little things can really lead to meaningful results.
The main problem of tests - they take time. Therefore, it is often necessary to make half-hearted decisions: a business will not wait so much, so much is needed for complete confidence.
Task 5
Analyzing changes in audience segments
Context
Let us imagine that we are driving with some kind of highly competitive competitive business, i.e. we can not distribute discounts to everyone left and right, and any of our mistakes will lead to an outflow of the audience to competitors. For example, we are a mobile operator from the big three. Or an internet provider. Or a hairdresser.
Based on general considerations, we form the following segments of our audience:
Beginners are those who have just met the product.
Outflow - those who did not like our product, they stopped using it
Loyal - the coolest, they enjoy and they are happy (maybe even recommend us to friends)
Loyalty outflow - users who are still “with us”, but they are unhappy, are actively looking for an alternative and are happy to move on to those who provide them with a cheaper or more convenient service.
In mobile operators or banks, this segment is particularly large: few people are completely satisfied with their own, but the “relocation” is fraught with high costs and you have to decide on it .
You have the following information on the dynamics of transitions from segment to segment:

The time difference between “was” and “became” was significant for our product.
Your actions:
1. Do nothing
2. Make a discount for beginners
3. Make a discount for those who are now in the “Loyal” segment
4. Make a discount for those who are now in the segment “Loyalty Outflow”
5. Not enough data to make a decision.
Information for consideration
Watch if you are ready
To make a good product, to optimize expenses, to actively promote ourselves - by itself, so we will do it without this information.
Give a discount to all we can not.
To keep the user with the help of a discount is overwhelmingly cheaper than attracting a new user.
Give a discount to all we can not.
To keep the user with the help of a discount is overwhelmingly cheaper than attracting a new user.
Possible answers
Watch if you are ready
It is possible that this behavior is normal. It would be nice to know at least something like the competition.
Beginners to give a discount is not profitable. We have already spent a lot on their attraction, and the transition to the outflow is immediately very large. It’s too late to give the outflow, they have found an alternative. Usually in such cases they give a discount to the outflow of loyalty, if it turns out to quickly isolate this segment before it becomes too late.
Judging by the shares and dynamics in our example, it is too late to give a discount to the outflow. It is not enough of them and they quickly flow away. In the data (we admit, quite rare in the real world) conditions it is better to give a discount to loyal
Comments
In this particular case, it is possible, you should either change the method of dividing into loyal and outflow of loyalty, or introduce intermediate gradations, since it is difficult to work with such a “fluid” segment.
Task 6
We build KPI in marketing
You are engaged in paid promotion in a service that provides paid services online. Your main KPI is the average monthly ROI of the channels you manage.
Task statement
How can you ensure that KPIs are executed in the most reliable way?
1. Work on the quality of promotional materials (banners, landing pages, etc.)
2. Work in the right set of channels and campaigns
3. Prompt response to failed metrics campaigns
4. Work only with cheap channels
5. Work on a narrow but target audience without scaling
Information for consideration
Watch if you are ready
We have no information about the business, about the market, about the structure of the department, the smooth running of processes.
We need a very proven and reliable way.
The question is not how well to do business, the question is how to implement the KPI delivered to us.
We need a very proven and reliable way.
The question is not how well to do business, the question is how to implement the KPI delivered to us.
Possible answers
Watch if you are ready
The work on the quality of advertising and the correct set of channels is good, this is how it should be done, in this direction one should strive. But it does not guarantee anything.
Rapid response is good, but, alas, it does not give any guarantee for the implementation of our KPI.
We draw attention to the fact that ROI does not depend on turnover. ROI at 20% can be on space budgets as well as on tiny ones.
But small budgets (especially if the process is somehow streamlined) are easier to maintain at a level than to scale. On small samples (especially if there is a loyal audience and imperfect attribution), it is much easier to make high ROI.
Therefore, no scaling, no risk, no development. Spend a little, the less the better, only in the most reliable and proven.
Comments
Incorrectly set KPIs can lead to the fact that the natural desire to fulfill them will harm the business and not help it.
Task number 7
We build KPI in the product
You are developing a site that provides paid services.
Your main KPI is the average monthly conversion from visits to paid orders.
Task statement
How can you ensure that KPIs are executed in the most reliable way?
1. Improve site functionality with user experience
2. Introduce new features
3. Improve service quality and feedback time.
4. Giving more free stuff.
5. Reduce product prices
6. Close access to the site to all but the old paying users
Information for consideration
Watch if you are ready
We have no information about the business, about the market, about the structure of the department, the smooth running of processes.
We need a very proven and reliable way.
The question is not how well to do business, the question is how to implement the KPI delivered to us.
We need a very proven and reliable way.
The question is not how well to do business, the question is how to implement the KPI delivered to us.
Possible answers
Watch if you are ready
The situation is similar to the previous one.
Conversion does not depend on the volume.
At low volumes, high conversion is easier. Therefore, the site must expel anyone who has not paid. Then there will be no audience, no development, no market, but there will be a high conversion.
Conversion does not depend on the volume.
At low volumes, high conversion is easier. Therefore, the site must expel anyone who has not paid. Then there will be no audience, no development, no market, but there will be a high conversion.
Comments
Incorrectly set KPIs can lead to the fact that the natural desire to fulfill them will harm the business and not help it.
On this task for today. I will be glad to hear your thoughts and alternative solutions in the comments.
Source: https://habr.com/ru/post/455148/
All Articles