Talent vs. luck: the role of chance in success and failure

Recently, I came across an interesting work by Italian scientists about the highly undervalued role of luck and chance in our lives. Unfortunately, I did not find the full version in Russian (maybe I was looking bad?), But I really wanted to share the read with my non-English-speaking comrades. Therefore, having rolled up his sleeves, he began his handicraft translation. The authors, Alesandro, Alessio and Andrea, were kindly allowed to publish it in the public domain, so if you are interested, welcome to Cat.
The authors
- A. Pluchino - Department of Physics and Astronomy, Catania University and Catania Branch of the National Institute of Nuclear Physics, Italy; alessandro.pluchino@ct.infn.it
- A.E. Biondo - Department of Economics and Business, University of Catania, Italy; ae.biondo@unict.it
- A. Rapisard - Department of Physics and Astronomy, Catania University and Catania Branch of the National Institute of Nuclear Physics, Italy; Center for the Study of Complex Systems, Vienna; andrea.rapisarda@ct.infn.it
annotation
The largely dominant meritocratic ( meritocracy is the principle of management, according to which the most capable people, regardless of their social background and financial wealth ) should occupy leading positions, the model of highly competitive Western cultures originates from the belief that success is, if not completely, depends on personal qualities such as talent, intelligence, skills, resourcefulness, hard work, perseverance, hard work or risk taking. Sometimes we are ready to admit that a certain amount of luck can also play a role in achieving significant material success. But, in truth, the importance of external forces in individual success stories is often underestimated. It is well known that intelligence (or, in general, talent and personal qualities) in a population has a Gaussian distribution, while the distribution of values — often seen as a measure of success — usually follows a power dependence (Pareto law), when the majority are poor and there are negligible number of billionaires. This discrepancy between normally distributed input data, which has a normal level (averaged talent or intelligence) and a constant distribution at the output, suggests that there is an invisible component somewhere behind the scenes. In this paper, based on extremely simple and toy agent-based modeling, we make the assumption that such a component is ordinary randomness. In particular, we show that, although life success does indeed require a certain amount of talent, but the most talented people almost never reach the highest heights of well-being, being surpassed by mediocre, but much more successful individuals. As far as we know, this counterintuitive result — although implicitly assumed between the lines — is a great deal in which literature — it is here that quantified for the first time. This makes it possible to take a fresh look at the effectiveness of the assessment of merit based on the level of success already achieved and underlines the risks of spreading excessive honors or resources to people who, in the end, could simply be luckier than others. With this model, we also examine and compare several behavioral hypotheses in order to show the most effective strategies of state funding of research, with the aim of improving meritocracy, diversity and innovativeness.
')
1. Introduction
The ubiquity of the power dependence in many physical, biological or socio-economic complex systems can be viewed as something like a distinctive mathematical feature of the close relationship of their dynamic characteristics with the unchanged topological structure [1, 2, 3, 4]. In the socio-economic context, the work of Pareto [5, 6, 7, 8, 9], it is well known that the distribution of wealth has the character of a power dependence, whose characteristic strongly elongated shape reflects the depth of the existing gap between the rich and the poor in our society.
A recent report [10] shows that today the gap is much larger than we feared: eight people have the same wealth as the 3.6 billion people who make up the poorest part of humanity. Over the past 20 years, several theoretical models have been developed that calculate the distribution of values in the context of probability theory and physical statistics, often taking the form of multi-agent modeling with simple internal dynamics [11, 12, 13, 14, 15, 16, 17].
Moving further in this direction, if we consider personal wealth as a measure of success, then it can be argued that its deeply asymmetric and unequal distribution among people is the result of their natural differences in talent, skills, competence, intelligence, ability or measure of their perseverance, hard work, or purposefulness. Such an assumption, implicitly, is the basis of the so-called meritocratic paradigm: it affects not only how our society provides employment opportunities, honor and glory, but also the strategies adopted by governments to allocate resources and finance those who are considered the most honored personalities.
However, the previous conclusion seems to be strongly at odds with the confirmed data that the above mentioned properties and qualities of people are normally distributed throughout the population, that is, they correspond to a symmetrical Gaussian distribution with respect to this average. For example, the intelligence, as measured by IQ tests, follows the following pattern: the average IQ is 100, but no one has an IQ of 1000 or 10,000. The same applies to work considered in working hours: someone works more than average, another less, but there is no one who works a billion times more hours than others.
But nowadays, there is more evidence of the fundamental role of chance, luck, or, generally speaking, random factors in determining success or failure in our personal and professional affairs. In particular, it was shown that all scientists have the same chance to publish breakthrough work during a career [18]; that those with the first letter of the surname closer to the beginning of the alphabet are much more likely to get the position of head of department [19]; that the distribution of bibliometric indicators collected by scientists may be accidental and meaningless due to the growing phenomenon associated with the “publish or die” inflation mechanism [20]; that the position of someone in an alphabetically sorted list may be important in determining access to public services that are limited in terms of the number of places [21]; that the initial letter of the patronymic raises the assessment of intellectual abilities [22]; that people with easily pronounced names are rated more positively than those whose names are complex [23]; that those whose names sound more aristocratic, more often than others work as leaders, not subordinates [24]; that women with male nicknames are more successful in the legal profession [25]; that about half of the differences in income among people all over the world are due exclusively to their country of residence and the distribution of wages within the country concerned [26]; that the probability of becoming a director is strongly influenced by your name and month of birth [27, 28, 29]; that innovative ideas are the result of random reactions in the cells of our brain [30]; and that even the likelihood of developing cancer, quite possibly destroying a great career, is largely dependent on failure [31, 32]. Recent work on the topic of reproductive success throughout life contributes to the confirmation of such statements, showing that if the deviations of characters can influence the fate of the population as a whole, then the life of specific individuals is often determined by luck.
In recent years, many authors, among whom are statisticians and risk analyst Nassim Taleb [35, 36], investment strategist Michael Mobussin [37] and economist Robert Frank [38], have investigated in a number of popular books the connection between luck and skill in financial transactions, business, sports, art, music, literature, science and many other fields. They concluded that random events play a much larger role in life than many people could imagine. In fact, they do not assume that success does not depend on talent and effort, as in highly competitive areas or “winner takes all” markets where we live and work at a given time, the most productive people are almost always extraordinarily talented and hardworking. They only concluded that talent and effort are not enough: you also need to be in the right place at the right time. In short, luck also influences, although its role is almost always underestimated by successful people. This is due to the fact that randomness often works in an unobvious way, so it is easy to compare events that will show success as something inevitable. Taleb calls such a tendency “a fairy tale delusion” [36], and sociologist Paul Lazarsfeld suggested the term “biased retrospective”. In his latest book, “Everything is obvious: when you know the answer” [39], the sociologist and pioneer of the science of networks, Duncan Watts suggests that both fabulous delusion and biased retrospective appeal to a special phenomenon in which people who see extraordinarily successful results, They are considered the undoubted product of hard work and talent. However, success mainly arises through complex and intertwined steps, each of which depends on the previous ones: if any of them were different, the whole career or life path would almost certainly also be different. This argument is also based on the results of an innovative experimental study conducted several years earlier by Watts himself, together with other authors [40], in which the success of previously unknown songs in the artificial music market was not shown to correlate with the quality of the work itself. And this, of course, greatly complicates any prediction, as shown in another, more recent study [41].
In this paper, with the help of an agent-based statistical approach, we will try to almost quantitatively determine the role of luck and talent in successful careers. In Section 2, based on the minimum number of assumptions, namely the Gaussian nature of the distribution of talent [42] and the multiplicative dynamics of both success and failure [43], we will present a simple model, which was called the “Talent vs Good Luck” model (TPA), which simulates the development of professional careers of a group of people over the 40-year period of their work. The model shows that in reality, chance plays a fundamental role in determining the most successful individuals. The truth is that, as you might expect, talented people are more likely to become rich, famous or meaningful during their own lives, in relation to the less prepared. But, and this is a less intuitive explanation, ordinary people with an ordinary level of talent are statistically destined to become successful (that is, to be located at the end of some power distribution of success) much more often than the most talented, provided that they became favorites of fortune for own life. This fact is often found, as indicated in the references [35, 36, 38], but, as far as we know, it was first modeled and measured in this work.
The success of people with mediocre talent calls into question the “meritocratic” paradigm and all those strategies and mechanisms that gave more rewards, opportunities, honor, glory and resources to people considered to be the best in their field [44, 45]. The fact is that, in the overwhelming majority of cases, all assessments of someone’s talent were given after the fact, solely by looking at his / her activities, or the results achieved, in a particular area of our society, such as sports, business, finance, art , science, etc. This kind of misleading assessment leads to the substitution of cause and effect, evaluating as the most talented people those who are simply the most successful [46, 47]. In accordance with this view, previous works warned about such types of “near meritocracy” and showed the effectiveness of other strategies based on random samples in many different environments, such as management, politics and finance [48, 49, 50, 51, 52, 53, 54, 55]. In Section 3, we use our approach and make sketches comparing possible schemes for the distribution of public funds in the context of scientific research. We study the consequences of various distribution strategies, among which there is also a “close” meritocratic one, with the goal of exploring new ways to increase, simultaneously, the minimum level of success of the most talented people in society and the final efficiency of public spending. We also explore, in general, how the opportunities offered by the environment, represented as levels of education and income (that is, external factors depending on the country and the social layer from which people come), are important in increasing the likelihood of success. Final remarks are completed.
2. Model
Next, we propose an agent-based model called Talent vs. Luck (TU), based on a small number of assumptions, and the aim is to describe the evolution of the careers of a group of people under the influence of randomly occurring successful and unsuccessful events.
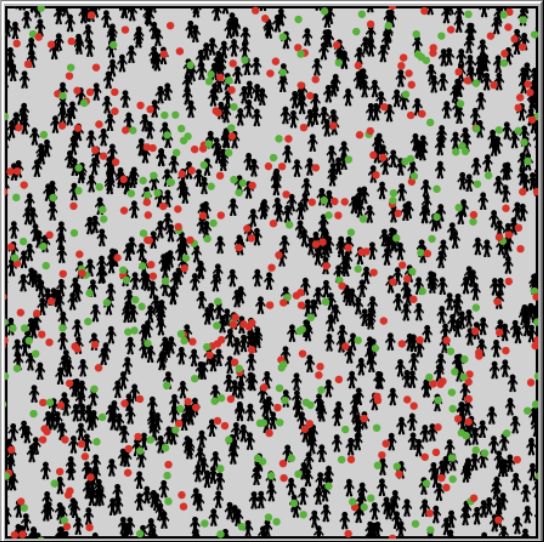
Figure 1: An example of the initial parameters for our simulation. All the simulations presented in this work were carried out in the NetLogo agent modeling environment [56]. N = 1000 people (agents), with varying degrees of talent (intellect, skills, etc.) randomly distributed over fixed positions within the square world of 201 × 201 plots with cyclical boundary conditions. During each simulation, which covers several decades, they are exposed to a certain amount of N E successful (green circles) and unsuccessful (red circles) events moving around the world along random paths (random walk). In this example, N E = 500.
We consider N individuals with a talent T i (intellect, skills, abilities, etc.) that have a normal distribution in the interval [0; 1] around a given average m T with a standard deviation σ T randomly arranged at fixed positions within the square world (see Figure 1) with boundary cycling conditions (ie, with a toroidal topology) and surrounded by a certain number of N E "moving" there are no events (marked by dots), some of which are successful, others are not (neutral events in this model are not taken into account, since they have no significant consequences on the life of an individual). In Figure 1, we showed these events in the form of colored dots: successful green and with a relative percentage of p L , and unsuccessful with red and with a percentage ( 100 - p L ). The total number of event points N E is evenly distributed, but, of course, such a distribution will be perfectly homogeneous only for N E → ∞ . In our simulations, there will usually be N E ≈ N / 2 , so at the beginning of each simulation there is a random significant concentration of successful or unsuccessful event points in different areas of the world, while other areas will be more neutral. The subsequent random movement of points within a square matrix, that is, the world, does not change this fundamental feature of the model, which indicates a different number of events of luck or failure for different people throughout their lives, independent of their personal talent.

Figure 2: The normal distribution of talent among the population (with a median m T = 0.6, shown by a dashed vertical line, and a standard deviation σ T = 0.1 - the values of m T ± σ T are displayed as two dotted vertical lines). This distribution is allocated in the interval [0; 1] and does not change during the simulation.
In one simulation run, the period of working life P is considered equal to 40 years (between the ages of twenty and sixty years), with a time step δ t equal to six months. At the beginning of the simulation, all agents were given the same capital C i = C (0) Ɐ i = 1, ..., N , representing their starting success / well-being level. This choice has the obvious goal of not giving anyone an initial advantage. While the talents of agents do not depend on time, their capital varies. During the development of this model, i.e., during the expected period of life of the agents, all event points move randomly around the world and, at the same time, they may intersect with the location of some agents. If you go into details, then each time the event point covers, in a random direction, the distance from 2 sections. We believe that an intersection with an individual occurs if the event point represented inside the circle with a radius of one segment is located on the agent (the event points after the intersection do not disappear). Depending on this incident, in this time step t (i.e., every six months), with a certain agent A k , the following three options are possible:
- No event point crosses the position of agent A k - this means that during the past six months no such events have occurred, agent A k has not performed any action.
- Agent Ak's position crosses a successful event - this means that a successful event has happened over the past six months (note, according to the link [30], the generation of innovative ideas here is also considered a good event that occurred in the agent's brain); As a result, agent A k doubles his capital / success with a probability proportional to his talent T k . The increase will be C k (t) = 2C k (t - 1) , but only if rand [0; 1] <T k , i.e., if the agent is smart enough to benefit from good luck.
- An unsuccessful event crosses the position of agent A k - this means that an unsuccessful event has occurred in the last six months; As a result, agent A k loses half of its capital / success, i.e. C k (t) = C k (t - 1) / 2 .
The above rules for agents (including the choice of dividing the initial capital in half in case of unsuccessful events and doubling with successful ones, proportionate to the talent of the agent) are intentionally simple and can be considered widespread, since they are based on the obvious fact that success in everyday life has the property both grow and decline at a rapid pace. Moreover, these rules offer a significant advantage to highly talented people, as they can benefit more from opportunities presented by luck (including the ability to use a good idea that originated in their brains). On the other hand, for example, a car accident or a sudden illness, are always unfortunate events in which talent does not matter. In this regard, we can derive a more precise definition of "talent" by defining it as "any personal quality that increases the chance to seize the opportunity." In other words, by the term “talent” we, in a broad sense, mean intelligence, skills, resourcefulness, perseverance, determination, hard work, risk taking and so on. Further, we will see that the advantage of having great talent is a necessary but not sufficient condition for achieving very high peaks of success.
2.1. Results of one sweep
In this subsection, we present the results of a sweep of one typical simulation. Generally speaking, these results are fairly stable, therefore, as we will show later, they can be considered largely representative of the general framework that goes beyond our model.
Let's imagine N = 1000 agents with an equal amount of initial capital C (0) = 10 (in abstract units) and with a fixed talent T i ϵ [0; 1], the following normal distribution with a median m T = 0.6 and a standard deviation σ T = 0.1 (see Figure 2). As mentioned earlier, the simulation covers a realistic period of time P = 40 years, developing in equal steps, six months each, all from I = 80 iterations. In this simulation, we took N E = 500 event points, with the probability of successful events occurring p L = 50%.
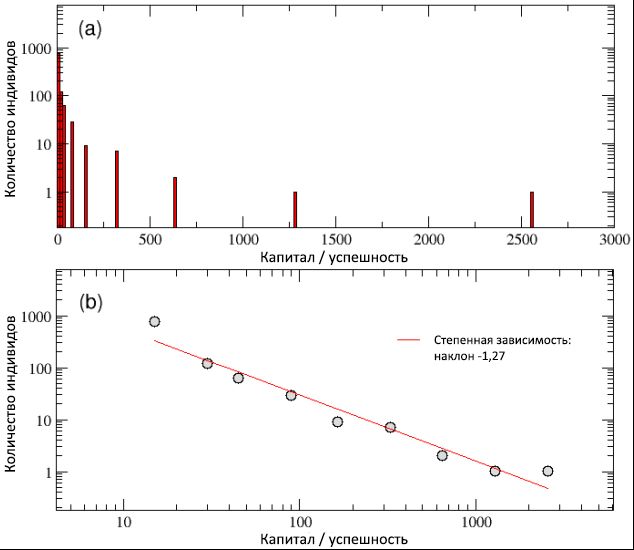
At the end of the simulation, as can be seen from scheme (a) of Figure 3, we found that simple dynamic rules of the model are capable of producing an unequal distribution of capital / success, with a large number of poor (unsuccessful) agents and a small number of extremely rich (successful). , (b) , y© ≈ C −1,27 .
Thus, despite the normal distribution of talent, the TPU model seems to be able to grasp the first important feature observed when comparing with real data: the existing deepest gap between rich and poor and the invariable nature of its scale. In particular, in our simulation only 4 individuals received more than 500 units of capital, and the 20 most successful people own 44% of all values, while almost half of the population has less than 10 units left. In general, the Pareto “80/20” rule is observed, since 80% of the population owns only 20% of the total capital, while the remaining 20% of individuals inherited 80% of the wealth. Although this inequality certainly looks unfair, it would be somewhat acceptable if the majority of successful people were among the most talented,thus deserving more capital / success than the rest. But is it really happening?
3: / , (a) (b) . , — (b) — −1,27. , / «80/20», 20% 80% .
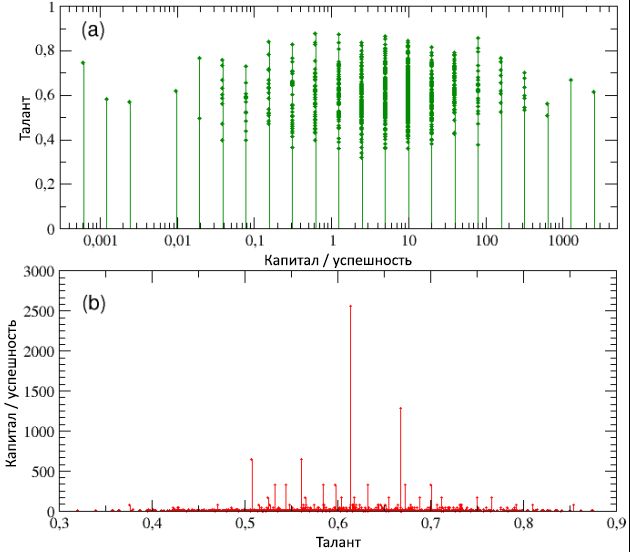
In Figure 4, schemes (a) and (b), respectively, represent talent as a function of the total capital / success, and vice versa (note that in diagram (a), capital / success has only discrete values — this is due to the decision use the same initial capital for all agents). Looking at both schemes, it can be seen that, on the one hand, the most successful individuals are not the most talented and, conversely, the most gifted individuals are not the most successful. In particular, the most successful individual, with C max = 2560, has a talent T * = 0.61, which is only slightly higher than the median value m T = 0.6, while the most gifted ( T max= 0.89) has a capital / success rate of less than 1 unit ( C = 0.625).
As we learn in more detail from the following subsection, such a result is not a special case, but rather the rule for systems of this type: maximum success never converges with maximum talent, and vice versa. Moreover, this discrepancy between success and talent is disproportionate and highly non-linear. In fact, the average capital of all people with talent T> T * is C ≈ 20; , / 128 , / , , . , , , , . , .
4: () / ( , ) – , , , . (b), , / – , , C max = 2560, , m T = 0,6, / , C = 1 , C (0). .
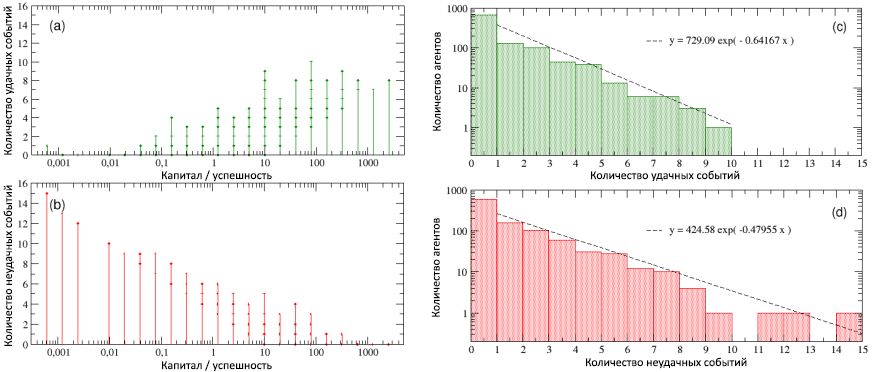
In Figure 5, the number of successful and unsuccessful events that occurred to all people during the period of their working life is shown as a function of their total capital / success. When considering scheme (a), it becomes obvious that the most successful personalities are at the same time the most successful ones (note that this diagram shows all the successful events that happened to the agents, and not just those from which they could benefit, in accordance with his talent). On the contrary, when looking at the scheme (b), we see that the most unsuccessful are at the same time the most unlucky. In other words, although there is no correlation between success and talent based on simulations, there is a strong dependence of success on luck. Analyzing the details of the frequency distributions of the number of successful and unsuccessful events occurring with individuals, we foundas shown in schemes © and (d), both of these values are exponential, with degrees 0.64 and 0.48, and medians 1.35 and 1.66, respectively, and that the maximum numbers of successful and unsuccessful events occurred, respectively, 10 and 15. Moreover, about 16% had a “neutral” life, generally without successful and unsuccessful events, while 40% of individuals faced only one type of event (successful or unsuccessful).while 40% of individuals encountered only one type of event (successful or unsuccessful).while 40% of individuals encountered only one type of event (successful or unsuccessful).
It is also interesting to look at the period of success / capital development both for the most successful individuals and for the most unsuccessful ones, comparing with the corresponding sequences of successful and unsuccessful events that occurred during 40 years (80 intervals, 6 months each) of their working life. The results can be seen, respectively, in the left and right sides of Figure 6. Unlike the diagram (a) from image 5, the bottom diagrams of this figure contain only those successful events from which the agents, thanks to their talent, were able to benefit.
5: (a) (b) , / . : , . , - , , / . © (d) , , . , ).
( ) (a) 6, , , , , ( ), ( ), , 30 40 (.. 40- ) , 10 (.., 5 ) , C = 320 C max = 2560.
, ( ) (b) , , , , , / , C = 0,00061. , T = 0,74, , . , . , , ( ), , , , .
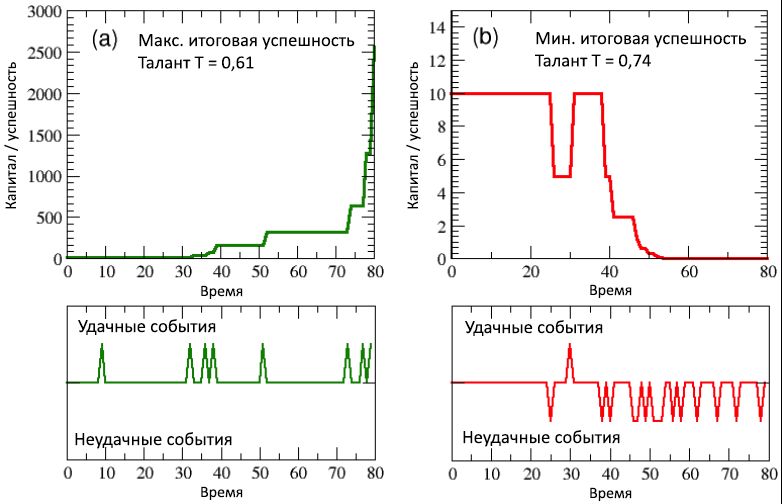
6: (a) / (b) , , ( 80 , .., 40 ). , .
(- NetLogo , , Open ABM), , , , , , , , .
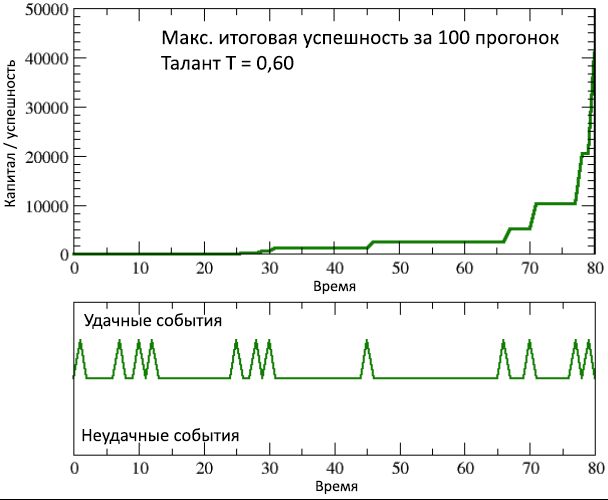
2.2.
, , 100 , , , . , : N = 1000 , m T = 0,6 σ T = 0,1 , I = 80 ( δ t = 6 ), C (0) = 10 , N E = 500 p L = 50%.
In diagram (a) of Figure 7, the total distribution of total capital / success among all agents, collected as a result of 100 runs, is shown on a log-log scale and is well described by a power-law curve with a slope of −1.33. The property of constancy of capital observed in a single sweep, regardless of scale and the resulting inequality among individuals, as well as the Pareto “80/20” rule, are thus preserved in the case of multiple runs. In fact, the gap between the richer (successful) and the poor (unlucky) agents has even widened, since the capital of the richest people has now exceeded 40,000 units.
This result can best be assessed by looking at the diagram (b) of Figure 7, where the total capital C is given as a function of talent.max only the most successful individuals, i.e. showed the best result in each of the 100 runs. Most points were obtained by an agent with a talent T best = 0.6048, which almost coincides with the median talent distribution ( m T = 0.6), which reached peak capital C best = 40960. On the other hand, the most gifted of the most successful individuals, with talent T max = 0.91, gained capital C max = 2560, which is only 6% of C best .
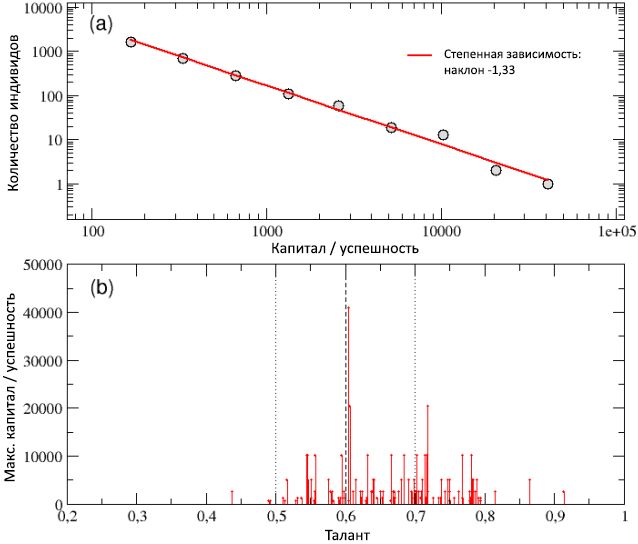
7: (a) – / , 100 , , . −1,33. (b) – C max 100 , . - , , , -, – , – . m T , m T ± σ T, are shown, respectively, in the form of vertical broken and dotted lines.
For the purpose of a more detailed consideration of this point of view, in Figure 8 (a) we plotted the distribution of the talent of the best performers, calculated for 100 runs. The distribution is obviously shifted to the right along the talent axis, with the average value of T av = 0.66> m T - this confirms, on the one hand, that moderately high talent is often needed to achieve significant success; however, on the other hand, it also shows that this condition is almost never enough, since agents with the highest talent (i.e., with T > m T = 2σ T , or T> 0.8) are among the best performers in only 3% of cases, and their capital / success never exceeds 13% of C best .
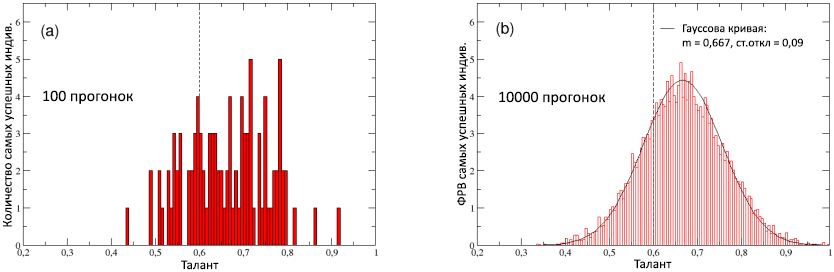
Figure 8: (a) The distribution of the talent of the most fortunate personalities (the best performers) in each of the 100 runs. (b) The probability distribution function (FRV) of the talent of the most successful individuals, calculated at 10,000 runs: is well described by the normal distribution with a median of 0.667 and a standard deviation of 0.09 (solid curve). For comparison, the median m T = 0.6 of the initial normal distribution of talent in the population is shown, shown in both schemes by a broken vertical line.
(b) 8 ( , ) 10000 , : , G(T) T av = 0,667 0,09 ( ). , , , , . , , P ( C max | T ) = G(T)dT [ T ; T + dT] grows with talent T , reaches a maximum near, approximately, moderately-average talent T av = 0.66, and then drops sharply for large values of talent. In other words, the probability of finding a moderately talented individual on top of success is higher than finding a highly gifted person there. Note that in an ideal world where talent is the main reason for its success, it is expected that P ( the C max | T ) is an increasing function of T . Thus, we can conclude that the observed Gaussian form P ( C max | T ) , , .
9: / (, , ), 100 , , .
100 / C mt ≈ 63 C at ≈ 33 , m T . ( C (0) = 10), , C mt > C at , , , , , , , , , . , 100 T > 0,7 (.. , ) / C end > 10, , T > 0,7 (, , ≈ 160), , 32% – , , , , , .
, , 100 – T best = 0,6, , C best = 40960, 650 , C mt , 4000 , C end < 10 2/3 . , , , . , 9, / , ( ) , , , .
Summing up, at this point it was found that, despite its simplicity, the TPU model seems to be able to take into account many of the features that characterize, as was said in the introduction, the high inequality in the distribution of wealth and success in our society, which clearly contrasts with the Gaussian distribution of talent among people. Also, the model in quantitative form shows that great talent is not enough for a guaranteed successful career and that, on the contrary, less talented people very often reach the pinnacle of success - this is another “conditional fact” often observed in real life [35, 36, 38].
The key aspect that intuitively explains how such a thing can happen that moderately gifted individuals achieve (so often) much greater honor and success, compared to more talented ones, is that there is a hidden and often underestimated role of luck, as is evident can be seen from our simulations. But to understand the true meaning of the results of our research, it is important to distinguish the macro from the micro point of view.
, -, , , , . , , , , ( ) , ( ) , , , . , , , ( ).
, -, , , , , , , , , .
- , , , , . , , , , , .
3.
, , , , , , , , . , . , , ( ) , , , , . , / , « » ( « » [57, 58, 59]), .
, , - , . : ? [44], , , . , , , . , ( ) , , , , «», . [60] , , , , , , . , [18], , , , . , , , , , , , , . [48, 49, 50, 51, 52, 53, 54, 55] « », , , . , , , , .
3.1. ,
The term “accidental discovery” is widely used in literary references to historical facts, showing that researchers often make unexpected and useful discoveries by pure chance when they are looking for something else [61, 62]. There is a long list of discovery stories made solely by lucky coincidence: from penicillin by Alexander Fleming to radioactivity by Maria Curie, from cosmic microwave background radiation by radio astronomers Arno Penzias and Robert Woodrow Wilson to graphene Andre Geim and Konstantin Novoselov. Let us give a more recent example: a network of fluid-filled canals in the human body, a previously unknown organ that apparently promotes the spread of cancer cells, was discovered by chance during simple endoscopy [63]. Therefore, many believe that one should always fund curiosity-driven research, since no one really can know in advance or predict what they can bring [64].
Is it possible to quantify the significance of a random discovery? What are the most effective ways to simulate a random discovery? It can take many different forms and is difficult to limit and quantify. That is why, until now, academic studies have considered a random scientific discovery, for the most part, as a philosophical concept. But times are changing. The European Research Council recently allocated a $ 1.7 million grant to biochemist Ohida Yakubu to calculate the significance of a random discovery in science [65]. Jakub found that random discovery can be classified into four basic types [66] and that there may be important factors influencing its appearance. His conclusions seem to coincide with ideas developed in earlier studies [67, 68, 69, 70, 71, 72], which state that generally accepted, obviously meritocratic, strategies that pursue excellence and suppress diversity seem destined to be losing and ineffective. The reason is that they a priori reject studies that initially look less promising, but which, thanks in part to the accidental discovery, could austeriologically prove to be incredibly innovative.
From this point of view, we want to apply the TPU model, which naturally expresses luck (and, consequently, random discovery) as a quantitative parameter of the strategy, with the aim of studying in this subsection the effectiveness of various financing scenarios. In particular, in situations where, as mentioned above, a moderately talented-but-successful person is often more successful than more-gifted-but unlucky individuals, it is important to evaluate the effectiveness of funding strategies for the ability to maintain a minimum level of success, including the most talented people who are expected to bring the most innovative and progressive ideas.
Starting with the same initial parameters that were used in subsection 2.2, i.e. N = 1000, m T = 0.6, σ T = 0.1, I = 80, δ t = 6, C (0) = 10, NE = 500, p L = 50% and 100 simulations, let's imagine that the available total funding capital F T is periodically distributed among the individual according to various criteria. For example, finances may be issued:
- All equally (equalizing criterion) to encourage exploratory diversity;
- Only a certain percentage of the most successful (“best”) individuals (elite criterion), which was previously called the “near” meritocracy, for the distribution of finances among people based on past performance.
- "Premium" distribution among a certain share of the most successful individuals, and the rest, in small equal parts, for the rest (mixed criterion);
- Only to a certain percentage of individuals selected at random (selective random criterion).
We realistically assume that the total capital F T will be distributed every 5 years, during the 40-year period of each simulation run, so that F T = 8 units of capital will be distributed from time to time. With the help of periodic injections of these funds, we intend to maintain a minimum level of resources of the most talented agents. Thus, a good indicator of the effectiveness of the chosen financing strategy can be the percentage of P T , the average per 100 simulation runs, for individuals with a talent T > m T + σ T , whose final success / capital exceeds the initial level, i.e., C end > C (0).
This percentage has already been calculated during the simulation runs presented in Section 2.2. It shows that in the absence of funding, the best performance is achieved by the most successful agents with close to average talent, while the capital / success of the most talented people always remain extremely low. In particular, only a part of P T0 ≈ 32% of the total number of agents with a talent of T > 0.7 could achieve, as a result of the simulation, capital / success exceeding the initial value. Therefore, to compare the effectiveness of various financing strategies, the growth of the average percentage P T should be calculated relative to the P T0 of those talented people who have increased their initial capital over their career. Let's define this height as P * T = P T - P T0 . This value is a fairly stable indicator: we checked it by repeating from 100 simulations, the spread of P * T values remained below 2%. Finally, if we calculate the ratio of P * T to the total capital distributed over all agents for 40 years, we can obtain an efficiency index E , which estimates the growth in the number of fairly successful talented people per unit of invested capital, defined as E = P * T / F T .
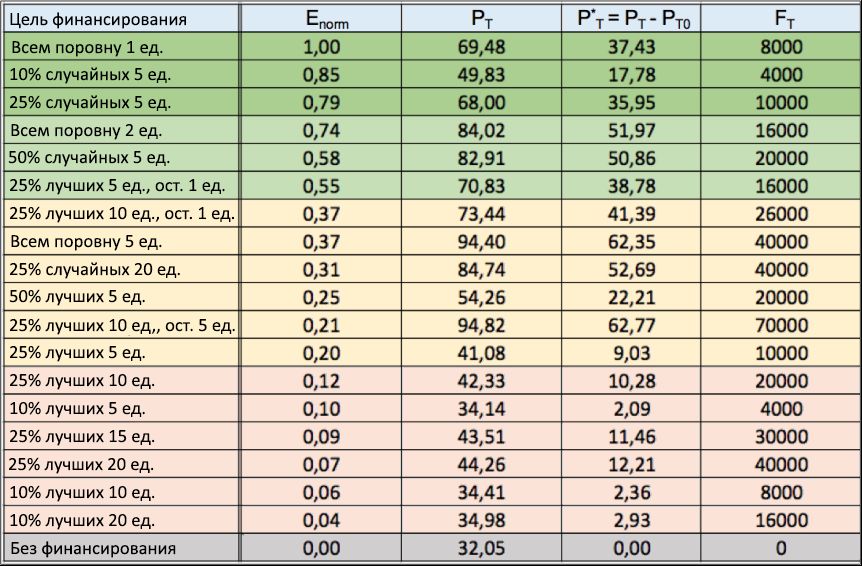
Figure 10: financing strategies table. There are several strategies for allocating finances to various targets (1 column), with the results of the normalized efficiency index E norm (2 column), in descending order. Also, in the third and fourth columns, respectively, the values of the share P T of successful talented people and the net growth of their number P * T are given , in relation to the “without financing” scenario, on average for 100 simulations. Finally, the last column shows the total capital F T invested in each sweep.
In the table shown in Figure 10, we showed the efficiency index (2nd column) obtained for several funding distribution strategies, each with its own financial goal (1st column), as well as the corresponding values of P T (3rd column) and P * T (4th column). There, in the last column, the total invested capital F T is given for each sweep. The efficiency index E was normalized relative to its maximum value E max , and all records (lines) are ordered by the criterion of decreasing values E norm = E / E max . For a scenario with a lack of funding, by definition, E norm = 0. These same E norm results are shown as a function of the adopted financing strategies in the form of a histogram in Figure 11. Due to statistical stability P T showing deviations of less than 2%, the results of the efficiency index E norm are stable.
Considering the above table and the corresponding histogram from Figure 11, it becomes obvious that if the goal is to reward the most talented individuals (thereby increasing their final level of success), then it is much better to allocate periodically (even if small) amount of capital to all individuals at once. rather than issuing more capital to only a small part of them, selected according to the level of success achieved by the time of distribution.
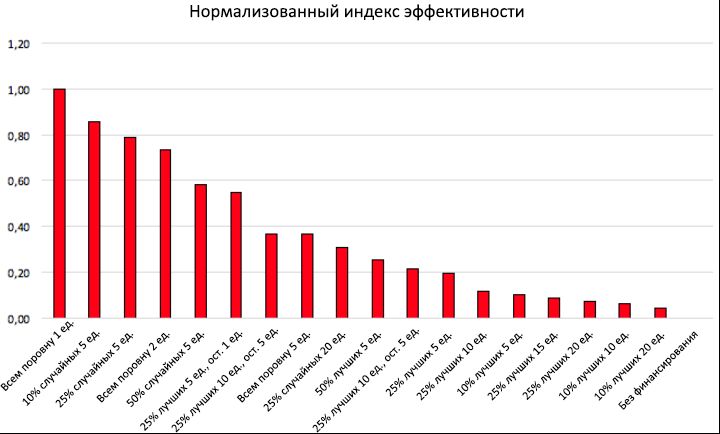
Figure 11: The normalized efficiency index of some financing strategies. The values of the normalized efficiency index E norm are given as a function of various funding strategies. The figure shows that, in order to increase the success of a larger number of talented people with C end > C (0), it is much more efficient to distribute small amounts of finance among many individuals than to finance them in other, more selective ways.
On the one hand, the histogram shows that the “equalizing” criterion that allocates each individual 1 unit of capital every 5 years is the most effective way to distribute finances, with E norm = 1 (i.e., E = E max ): when a small investment of F T in the amount of 8000 units, it turns out to double the percentage of successful talented people, compared with the “no financing” scenario, bringing it from P T0 = 32.05% to P T = 69.48%, with a net increase of P * T = 37.43. When considering increasing the total invested capital (for example, by setting an equalizing quota of 2 or 5 units), this strategy also ensures a further increase in the total percentage of successful talented people (from 69.48% to 94.40%), but the normalized efficiency with this gradually decreases, from E norm = 1 to E norm = 0.74, and then to E norm = 0.37, respectively.
On the other hand, “elite” strategies, which distribute every 5 years over a large amount of finance (5, 10, 15 or 20 units) only among the top 50%, 25% or even 10% of already successful individuals, are located at the very bottom of the table, with E norm <0.25 in all the above scenarios, the net increase in P * T of the total number of successful talented people, in comparison with the “without financing” scenario, remains extremely low (in almost all cases less than 20%), often despite much more investment capital, when compared with a similar equalization strategy. These results reinforce the assumption that this approach is obviously close to meritocratic.
It is worth noting that the adoption of the "mixed" criterion, i.e. the distribution of the “meritocratic” financial part among a certain percentage of the most successful individuals, for example, 25%, with the distribution of the remaining finances in equal shares to the rest of the people, gives the best, compared to the “near meritocratic” approach, the results of the efficiency index. However, in terms of productivity, this strategy is not able to catch up with the “equalizing” criterion. As is clearly seen, for example, from the comparison of the sixth and fourth lines of the financing table: despite the same total investment of 16000 units, the P T value obtained with the mixed criteria remains much lower than with the equalization approach (70.83% against 84, 02%), which is also confirmed by the corresponding values of the efficiency index E norm (0.55 vs. 0.74).
If we take into account psychological factors (not modeled in this study), then the mixed strategy can be re-revised in comparison with equalization. In reality, the bonus reward assigned to the most successful individuals can stimulate greater adherence to all agents, while the equally distributed remaining part will play a dual role: at the individual level, it will stimulate diversity and provide unlucky talented people with new chances to realize their potential, and The overall level will support casual discoveries, thereby contributing to the development of research and the community as a whole.
Looking again at the table of financing strategies, you should pay attention to the incredibly high efficiency of random strategies, which occupy two of the three best positions in the overall result. It follows that, for example, periodic remuneration of 5 units of only 10% of randomly selected individuals, with a total investment of only 4,000 units, gives a net increase of P * T = 17.78%, which is higher than almost all received with the help of equalization strategies. Moreover, an increase to 25% of the share of randomly financed people and a doubling of the total investment (raising them to 10,000 units) gives a net growth of P * T = 35.95, comparable to what was obtained by the best leveling strategy that won first place in the overall standings. It is striking that this last result P * T is about four times the value ( P * T = 9.03%) obtained with the elite approach (see line 12 of the table), which distributed exactly the same capital (10,000 units) among the same number of individuals (25% of the total). The latter confirms even more that in difficult social and economic environments, where chance plays a significant role, the effectiveness of other strategies based on random elections can easily bypass standard strategies based on the “near meritocratic” approach. This, contrary to common sense, a phenomenon that has already been observed in the areas of management, politics and finance [48, 49, 50, 51, 52, 53, 54, 55], is thus another confirmation in the context of funding research.
In order to further confirm the obtained data, Figure 12 shows the results of another series of simulations. Unlike previous simulations, here the total amount of capital invested in each of the 100 runs is now fixed at F T = 80,000, so F 5/8 = 10,000 units are distributed among agents every 5 years, according to the same financing strategies considered earlier . Looking at the table, we see that the results of the leveling strategy were again the most effective in terms of rewarding the most talented people, with a share of P T close to 100%. Next comes a random strategy (with 50% of individuals randomly selected to finance), and then mixed, in which half of the capital is distributed among 25% of the most successful individuals, and the other part, in equal shares, among other people. On the contrary, all elite strategies once again settled at the end of the rating, thereby further confirming the ineffectiveness of the “near meritocratic” approach in rewarding true talent.
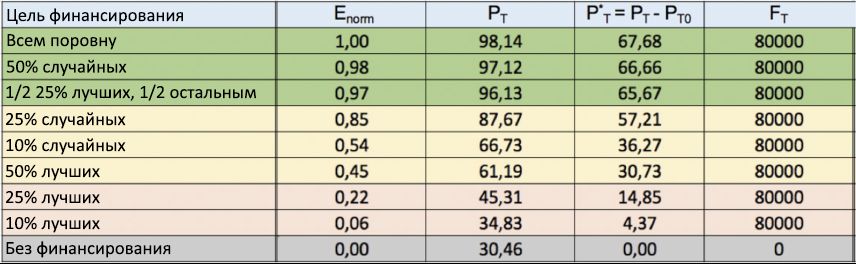
Figure 12: Fixed finance financing strategy table. The obtained normalized efficiency indices E norm for several financing distribution strategies (1st column) are again shown in descending order, from top to bottom. In contrast to Figure 10, here the total capital invested in each run is fixed at F T = 80,000. The equalization strategy again took first place.
The results of the TpU model simulations presented in this subsection focused on the importance of external factors (as well as effective funding policies) in increasing the chances of success for the majority of talented individuals who are too often punished due to unsuccessful events. In the next subsection, we explore to what extent new opportunities should come from changes in the environment, such as education levels or other incentives derived from the social environment in which people live or where people come from.
3.2. Significance of the environment
To begin with, let us evaluate the role of the average level of education in the population. In the framework of the TPU model, it can be obtained by changing the parameters of the normal distribution of talent. In general, if we assume that the talent and skills of individuals, while stimulating them, may be more effective in realizing new opportunities, then increasing either the medians m T or the standard deviation of the talent σ T can be interpreted as a consequence of policies aimed, respectively, at raising the average level of education, or to strengthen the training of the most gifted people.
In the two schemes of Figure 13, we presented the total capital / success accumulated by the best performers of each of the 100 runs, as a function of their talent. The specified parameters correspond to those used in subsection 2.2 ( N = 1000, I = 80, δ t = 6, C (0) = 10, N E = 500, and p L = 50%), but with different talent distribution points . In particular, in scheme (a) we left m T = 0.6 unchanged, but increased σ T = 0.2, while in diagram (b) we did the opposite, leaving σ T = 0.1 and lifting m T = 0.7. In both cases, you can notice a shift to the right of the peaks of maximum success, but with a difference in details.
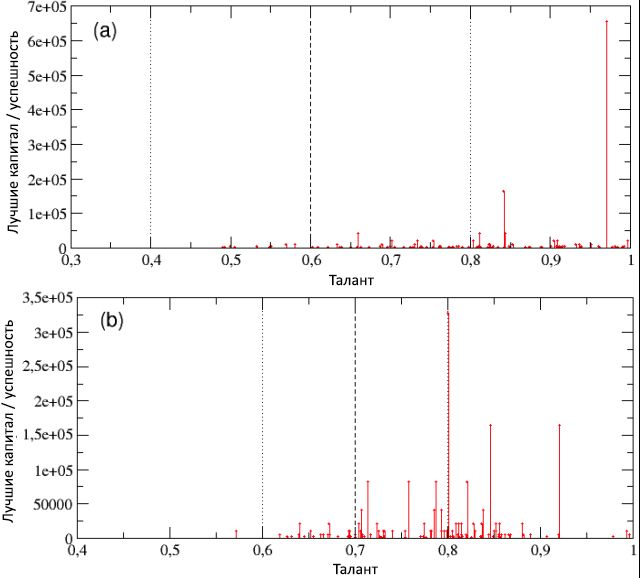
Figure 13: the total capital of the most successful individuals in each of the 100 runs, presented as a function of their talent for populations with different parameters of talent distributions: (a) m T = 0.6 and σ T = 0.2 (reflecting the increase in training training the most talented people); (b) m T = 0.7 and σ T = 0.1 (which represents an increase in the average level of education). Also shown are the corresponding values of m T and m T ± σ T , in the form of vertical broken and dotted lines, respectively.
In fact, this leads to the fact that increasing σ T , with a constant value of m T , as shown in diagram (a), raises the chances of the most talented people to achieve very high success - the best performer is now a very talented agent, with T = 0, 97, reached an incredible level of capital / success C best = 655360. This, on the one hand, can be evaluated positively, however, on the other hand, is a single case and also there is, as a counterbalance, an increase in the gap between unlucky and lucky people. Looking now at scheme (b) we see that increasing m T without changing σ T gives the best performer with C best = 327680 and talent T = 0.8, followed by two more, with C = 163840 and, accordingly, T = 0.85 and T = 0.92. This suggests that in this case the chances of the most talented people to achieve extremely high success increased, but at the same time the gap between the unlucky and lucky people turned out to be lower than before.
, / 100 C mt ≈ 63, 2.2. , C mt ≈ 319 (a) C mt ≈ 122 (b), . , – P T , , .. T > m T + σ Tand total success / capital C end > 10, relative to the total number of people with talent T > m T + σ T (note that here, in both cases considered, m T + σ T = 0.8). So, we got P T = 38% in the scheme (a) and P T = 37.5% for the scheme (b), with an insignificant net increase in relation to the reference value P T0 = 32% (obtained for the distribution of talent with m T = 0.6 and σ T = 0.1).
, , , , , , . , , , , . , , , .
Of course, as soon as this level of education was established, it became obvious that the abundance of opportunities offered by that social environment, i.e. A country where someone was born by chance or decided to reside is another key component that can influence global system performance.
In Figure 14, we presented results similar to those seen in the previous image, but for another series of simulations, with 100 runs each, with the same parameters set as in subsection 2.2 ( N = 1000, m T = 0, 6, σ T = 0.1, I = 80, C (0) = 10, N E = 500) but with different percentages p Lsuccessful events (recall that in subsection 2.2 the percentage was taken p L = 50%). In scheme (a), we take p L = 80% to simulate a highly stimulating environment, full of possibilities, typical of rich industrialized countries like the USA [26]. On the other hand, in the diagram (b), the value of p L = 20% reproduces the scenario of a much less encouraging environment, with an extremely small number of possibilities, such as, for example, in the Third World countries.
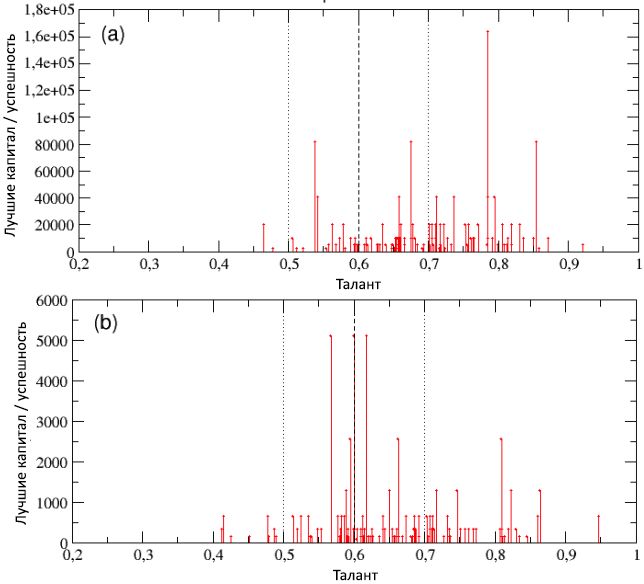
Figure 14: the total capital of the most successful individuals in each of the 100 runs is shown as a function of their talent for populations living in environments with different percentages p L successful events: (a) pL = 80%; (b) p L = 20%. , , m T = 0,6 m T ± σ T , σ T = 0,1.
, / , , p L .
p L = 80%, (a), - , p L = 50%, , C best = 163840. , / , C mt ≈ 149, , , P T = 62,18% ( P T0 = 32%), , , , .
p L = 20%. , (b), , , 2.2, C best 5120 – , . , P T , , , 8.75%.
, , , , , , . , , , .
4.
, , , . , , , / , 40 , «80/20», , . , , , – , . . , , / , , . , « », , . , – , . , , , .
Acknowledgments
, .
Bibliography
- Bak, P., Tang, C. and Wiesenfeld, K., Self-organized criticality. Phys. Rev. A , 38:364{374 (1988).
- Barab´asi, A.-L., Albert, R., Emergence of Scaling in Random Networks, Science , Vol. 286, Issue 5439, pp. 509{512 (1999).
- Newman, MEJ, Power laws, Pareto distributions and Zipf's law, Contemporary Physics , 46 (5): 323{351 (2005).
- Tsallis, C., Introduction to Nonextensive Statistical Mechanics. Approaching a Complex World , Springer (2009).
- Pareto, V., Cours d'Economique Politique , vol. 2 (1897).
- Steindl, J., Random Processes and the Growth of Firms — A Study of the Pareto Law, Charles Griffin and Company , London (1965).
- Atkinson, AB, Harrison, AJ, Distribution of Total Wealth in Britain, Cambridge University Press , Cambridge (1978).
- Persky, J., Retrospectives: Pareto's law, Journal of Economic Perspectives 6, 181{192 (1992).
- Klass, OS, Biham, O., Levy, M., Malcai, O., Solomon, S., The Forbes 400 and the Pareto wealth distribution, Economics Letters 90, 290{295 (2006).
- Hardoon, D., An economy for the 99% , Oxfam GB, Oxfam House, John Smith Drive, Cowley, Oxford, OX4 2JY, UK (January 2017).
- Bouchaud, J.-P., M´ezard, M., Wealth condensation in a simple model of economy, Physica A 282, 536{54 (2000).
- Dragulescu, A. and Yakovenko, VM, Statistical mechanics of money, Eur. Phys. J. B 17, 723{729 (2000).
- Chakraborti, A. and Chakrabarti, BK, Statistical mechanics of money: how saving propensity affects its distribution, Eur. Phys. J. B 17, 167{170 (2000).
- Patriarca, M., Chakraborti, A., Germano, G., Influence of saving propensity on the power law tail of wealth distribution, Physica A 369(2), 723{736 (2006).
- Scalas, E., Random exchange models and the distribution of wealth. European Physical Journal — Special Topics , 225. pp. 3293-3298. ISSN 1951{6355 (2016).
- During, B., Georgiou, N. and Scalas, E., A stylised model for wealth distribution. In Akura, Yuji and Kirman, Alan (eds.) Economic Foundations of Social Complexity Science . Springer Singapore, Singapore, pp. 95{117. ISBN 9789811057045 (2017).
- During, Bertram, Georgiou, Nicos and Scalas, Enrico (2017) A stylised model for wealth distribution. In: Akura, Yuji and Kirman, Alan (eds.) Economic Foundations of Social Complexity Science . Springer Singapore, Singapore, pp. 95-117. ISBN 9789811057045
- Sinatra, R., Wang, D., Deville, P., Song, C. and Barab´asi, A.-L., Quantifying the evolution of individual scientific impact, Science 354, 6312 (2016).
- Einav, L. and Yariv, L., What's in a Surname? The Effects of Surname Initials on Academic Success, Journal of Economic Perspective , Vol. 20, n. 1, p.175{188 (2006).
- Ruocco, G., Daraio, C., Folli, V. and Leonetti, M., Bibliometric indicators: the origin of their log-normal distribution and why they are not a reliable proxy for an individual scholar's talent, Palgrave Communications 3:17064 doi: 10.1057/palcomms.2017.64 (2017).
- Jurajda, S., Munich, D., Admission to Selective Schools, Alphabetically, Economics of Education Review , Vol. 29, n. 6, p.1100{1109 (2010).
- Van Tilburg, WAP, Igou, ER, The impact of middle names: Middle name initials enhance evaluations of intellectual performance, European Journal of Social Psychology , Vol. 44, Issue 4, p.400{411 (2014).
- Laham, SM, Koval, P., Alter, AL, The name-pronunciation effect: Why people like Mr. Smith more than Mr. Colquhoun, Journal of Experimental Social Psychology 48, p.752{756 (2012).
- Silberzahn, R., Uhlmann, EL, It Pays to be Herr Kaiser: Germans with Noble-Sounding Last Names More Often Work as Managers, Psychological Science 24(12): 2437{44 (2013).
- Coffey, B. and McLaughlin, P., From Lawyer to Judge: Advancement, Sex, and NameCalling. SSRN Electronic Journal , DOI10.2139/ssrn.1348280 (2009).
- Milanovic, B., Global Inequality of Opportunity: How Much of Our Income Is Determined by Where We Live?, Review of Economics and Statistics , 97.2 (2015): 452{60.
- Du, Q., Gao, H., Levi, MD, The relative-age effect and career success: Evidence from corporate CEOs, Economics Letters 117(3):660{662 (2012).
- Deaner, RO, Lowen, A., Cobley, S., Born at the Wrong Time: Selection Bias in the NHL Draft. PLoS ONE 8(2): e57753 (2013).
- Brooks, D., The Social Animal. The Hidden Sources of Love, Character, and Achievement, Random House , 424 pp. (2011).
- Iacopini, I., Milojevic, S. and Latora, V., Network Dynamics of Innovation Processes, Physical Review Letters 120, 048301 (2018).
- Tomasetti, C., Li, L., Vogelstein, B., Stem cell divisions, somatic mutations, cancer etiology, and cancer prevention, Science 355, 1330{1334 (2017).
- Newgreen, DF et al., Differential Clonal Expansion in an Invading Cell Population: Clonal Advantage or Dumb Luck?, Cells Tissues Organs 203:105{113 (2017).
- Snyder, RE and Ellner, SP, We Happy Few: Using Structured Population Models to Identify the Decisive Events in the Lives of Exceptional Individuals, The American Naturalist 188, no. 2 (2016): E28{E45.
- Snyder, RE and Ellner, SP, Pluck or Luck: Does Trait Variation or Chance Drive Variation in Lifetime Reproductive Success?, The American Naturalist 191, no. 4 (2018): E90{E107.
- .., . , , (2018).
- .., . , (2018).
- Mauboussin, MJ, The Success Equation: Untangling Skill and Luck in Business, Sports, and Investing, Harvard Business Review Press (2012).
- .., . , (2019).
- Watts, DJ, Everything Is Obvious: Once You Know the Answer , Crown Business (2011).
- Salganik, MJ, Dodds PS, Watts DJ, Experimental Study of Inequality and Unpredictability in an Artificial Cultural Market, Science Vol.311 (2006)
- Travis, M., Hofman, JM, Sharma, A., Anderson,. A., Watts, DJ, Exploring limits to prediction in complex social systems , Proceedings of the 25th ACM International World Wide Web Conference (2016) arXiv:1602.01013 [cs.SI]
- Stewart, J., The Distribution of Talent, Marilyn Zurmuehlin Working Papers in Art Education 2 : 21-22 (1983).
- Sinha, S. and Pan, RK, How a «Hit» is Born: The Emergence of Popularity from the Dynamics of Collective Choice, In Econophysics and Sociophysics: Trends and Perspectives (eds BK Chakrabarti, A. Chakraborti and A. Chatterjee), Wiley-VCH Verlag GmbH & Co. KGaA, Weinheim, Germany. doi: 10.1002/9783527610006.ch15 (2006).
- Fortin, J.-M., Curr, DJ, Big Science vs. Little Science: How Scientific Impact Scales with Funding, PLoS ONE 8(6): e65263 (2013).
- Jacob, BA, Lefgren, L., The impact of research grant funding on scientific productivity, Journal of Public Economics 95 (2011) 1168{1177.
- O'Boyle, JR. E. and Aguinis, H., The Best and the Rest: revisiting the norm of normality of individual performance, Personnel Psychology , 65: 79-119. doi:10.1111/j.1744-6570.2011.01239.x (2012).
- Denrell, J. and Liu, C., Top performers are not the most impressive when extreme performance indicates unreliability, Proceedings of the National Academy of Sciences , 109(24):9331{9336 (2012).
- Pluchino, A., Rapisarda, A., and Garofalo, C., The Peter principle revisited: A computational study, Physica A 389(3):467{472 (2010).
- Pluchino, A., Garofalo, C., Rapisarda, A., Spagano, S. and Caserta, M., Accidental politicians: How randomly selected legislators can improve parliament efficiency, Physica A 390(21):3944{3954 (2011).
- Pluchino, A., Rapisarda, A. and Garofalo, C., Efficient promotion strategies in hierarchical organizations, Physica A 390(20):3496{3511 (2011).
- Biondo, AE, Pluchino, A., Rapisarda, A., Helbing, D., Reducing financial avalanches by random investments, Phys. Rev. E 88(6):062814 (2013).
- Biondo, AE, Pluchino, A., Rapisarda, A., Helbing, D., Are random trading strategies more successful than technical ones, PLoS One 8(7):e68344 (2013)
- Biondo, AE, Pluchino, A., Rapisarda, A., The beneficial role of random strategies in social and financial systems, J. Stat. Phys. 151(3-4):607{622 (2013).
- Biondo, AE, Pluchino, A., Rapisarda, A., Micro and macro benefits of random investments in financial markets, Cont. Phys. 55(4):318{334 (2014).
- Biondo, AE, Pluchino, A., Rapisarda, A., Modeling financial markets by self-organized criticality, Phys. Rev. E 92(4):042814 (2015).
- Wilensky, U., NetLogo. ccl.northwestern.edu/netlogo . Center for Connected Learning and Computer-Based Modeling, Northwestern University, Evanston, IL (1999).
- Merton, RK, The Matthew effect in science, Science 159, 56-63 (1968).
- . ., , II: , https://www.hse.ru/data/033/314/1234/3_6_1Merto.pdf .
- Bol, T., de Vaan, M. and van de Rijt, A., The Matthew effect in science funding, Proceedings of the National Academy of Sciences , DOI: 10.1073/pnas.1719557115 (2018).
- Mongeon, P., Brodeur, C., Beaudry, C. et al., Concentration of research funding leads to decreasing marginal returns, Research Evaluation 25, 396{404 (2016).
- Merton, RK, Barber, E., The Travels and Adventures of Serendipity , Princeton University Press, Princeton (2004).
- Murayama, K. et al., Management of science, serendipity, and research performance, Research Policy 44 (4), 862{873 (2015).
- Benias, PC et al., Structure and Distribution of an Unrecognized Interstitium in Human Tissues, Scientific Reports , vol. 8, 4947 (2018).
- Flexner, A, The Usefulness of Useless Knowledge , Princeton University Press, Princeton (2017).
- Lucky science. Scientists often herald the role of serendipity in research. A project in Britain aims to test the popular idea with evidence. , Nature Editorial, Vol.554, 1 February 2018.
- Yaqub, O., Serendipity: Towards a taxonomy and a theory, Research Policy 47, 169{179 (2018).
- Page, SE, The Diversity Bonus. How Great Teams Pay Off in the Knowledge Economy , Princeton University Press (2017).
- Cimini, G., Gabrielli, A., Sylos Labini, F., The Scientific Competitiveness of Nations, PLoS ONE 9(12): e113470. doi.org/10.1371/journal.pone.0113470 (2014).
- Curry, S., Let's move beyond the rhetoric: it's time to change how we judge research, Nature 554, 147 (2018).
- Nicholson, JM and Ioannidis, JPA, Research grants: Conform and be funded, Nature 492, 34{36 (2012).
- Bollen, J., Crandall, D., Junk, D. et al., An efficient system to fund science: from proposal review to peer-to-peer distributions, Scientometrics 110, 521{528 (2017).
- Garner, HR, McIver, LJ and Waitzkin, MB, Research funding: Same work, twice the money?, Nature 493,599{601 (2013).
: Talent vs Luck: the role of randomness in success and failure
Source: https://habr.com/ru/post/455064/
All Articles