Frontend performance: parse important metrics
In addition to this, I will try to briefly consider the general rules of code optimization and some errors that should be noted. I'll also tell you about a tool that helps not only in profiling, but also out of the box collects a bunch of basic metrics about the performance of your application (and I hope you finish this post to the end).
First of all, we define what the frontend performance is, and then proceed to how to measure it. So, as I said, we will not measure certain ops / sec, we need real data that could answer the question of what exactly is happening with our project at each stage of its work. For this we need the following set of metrics:
- download speed;
- the time of the first drawing and interactivity (Time To Interactive);
- speed of reaction to user actions;
- FPS scrolling and animations;
- application initialization;
- if you have a SPA, then you need to measure the time spent on the transition between routes;
- memory and traffic consumption;
- and ... that's enough for now.
All these are basic metrics, without which it is impossible to understand exactly what is happening at the frontend. And not just at the front end, but in reality, at the end user. But to start collecting these metrics, you first need to learn how to measure them, so let's remember what ways there are for performance analytics.
')
The first thing to start with is, of course, the Performance API. Namely performance.timing , through which you can find out how long it took the user to open your project. But the Performance API covers only part of the metric, the rest will need to be measured by ourselves, and for this we have the following tools:
| pros | Minuses | |
|---|---|---|
| console.time ('label') | Works out of the box. Output to console. Displayed in DevTools -> Performance -> User Timing. | The output is only in DevTools, not sent to the server (i.e. there is no possibility to get the value for the subsequent analytics). Requires console.timeEnd with the original label .No color coding. No grouping (something like console.group / groupEnd ). |
| performance.now () | Full control over the beginning and end. You can send to the server. | No display in console. No display in DevTools -> Performance -> User Timing. It is necessary to drag the variable "start". No grouping. |
| performance.mark / measure | Full control over the beginning and end. You can send to the server. Displayed in DevTools -> Performance -> User Timing. | No display in console. In order to measure something, you need to set three unique labels and call two methods, and in a good way, you also need performance.clearMarks and performance.clearMeasures , which makes use extremely inconvenient.No grouping. |
Perfkeeper
- Full control over the beginning and end.
- You can send to the server.
- Output to console.
- Supports DevTools -> Performance -> User Timing.
- There is a grouping.
- There is color coding (as well as units of measurement, i.e. it is possible to measure not only time).
- Supports extensions.
Now I will not paint the API here, I did not write documentation for this, and the article is not about that, but I will continue to learn how to collect metrics.
Page loading speed
As I already said, you can learn the download speed from performance.timing , which will allow you to find out the full cycle from the start of page loading (DNS rezolv time, HTTP Handshake installation, request processing) to full page load (DomReady and OnLoad):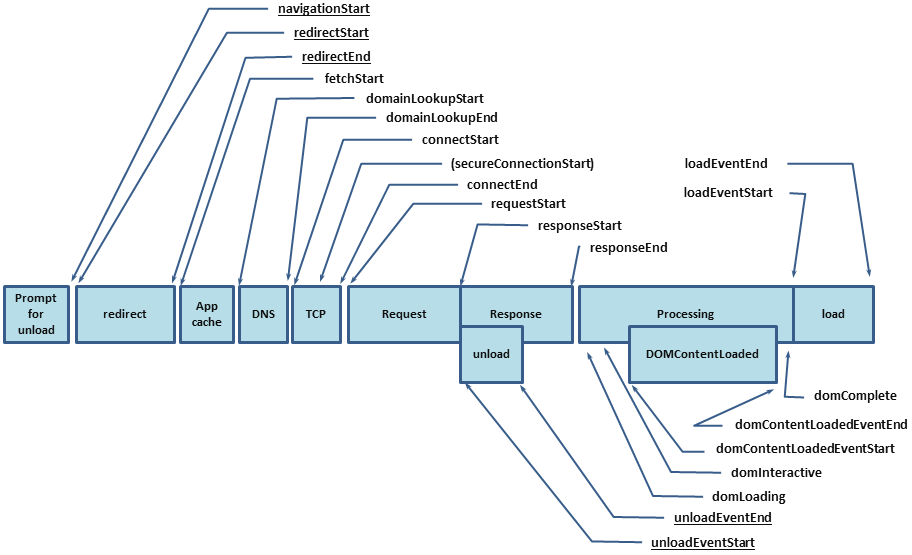
The result should be the following set of metrics:
 |  |  |
But this is not enough, we received only basic values and still do not know what exactly took so much time. And to find out, you need to nashpigovat and HTML metrics.
As I said before, I’ll show examples using PerfKeeper , so first of all PerfKeeper (2.5 Kb) inline in
<hed/> and further: 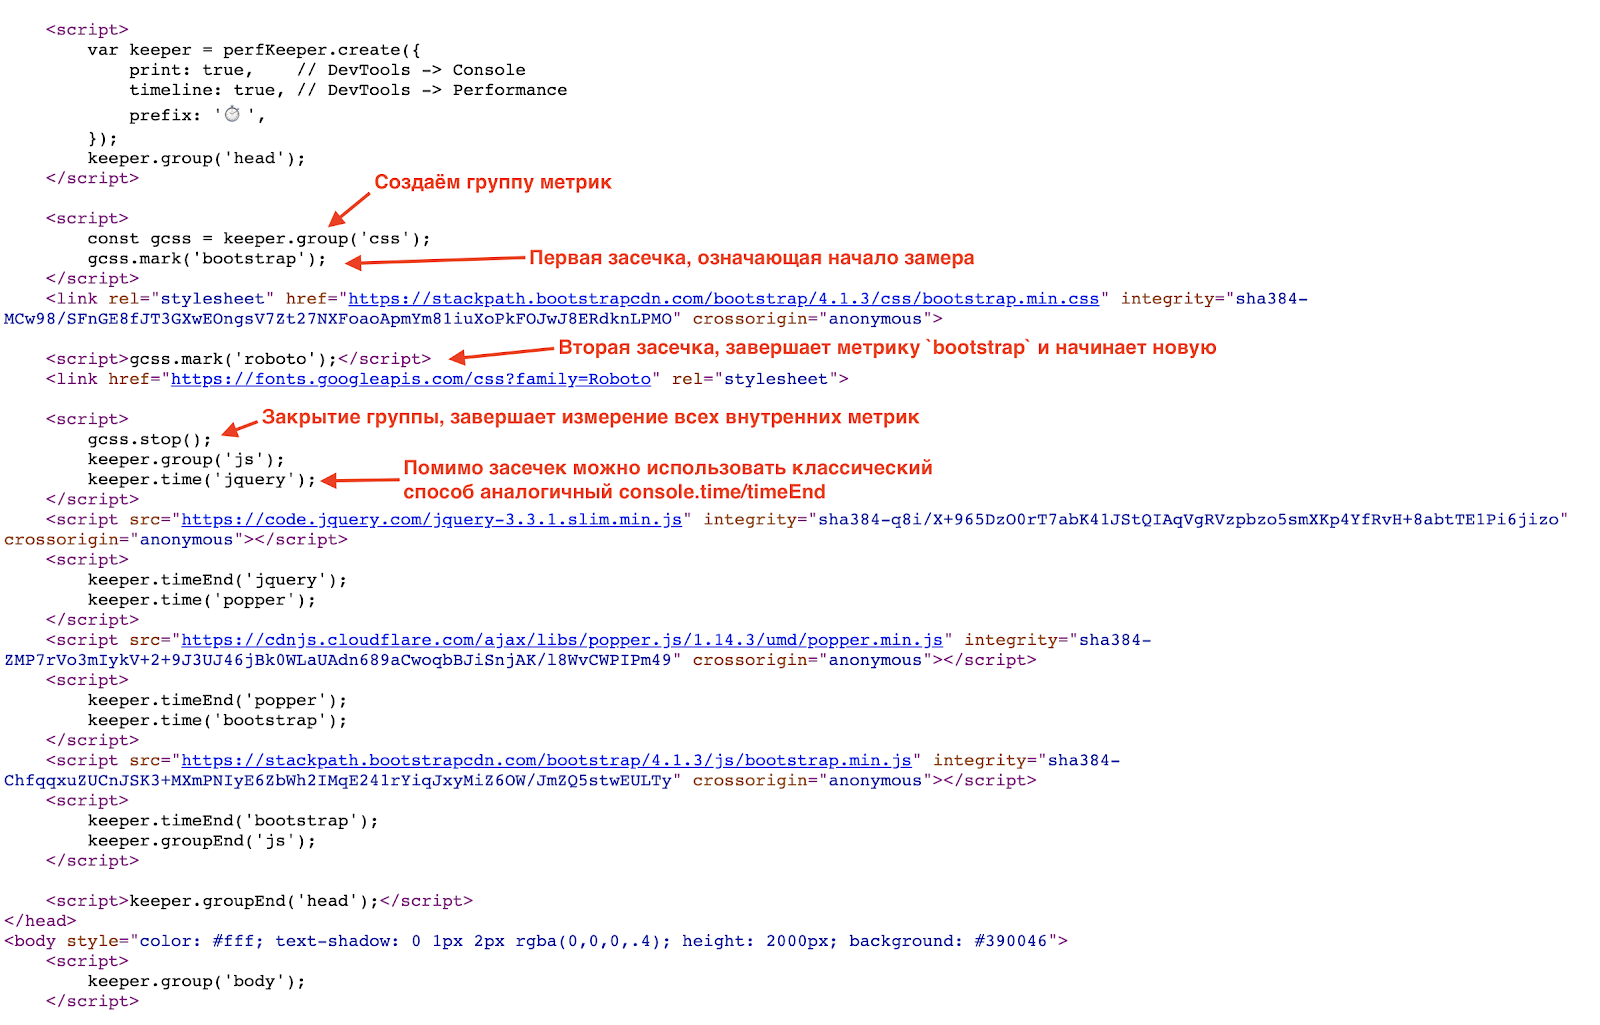
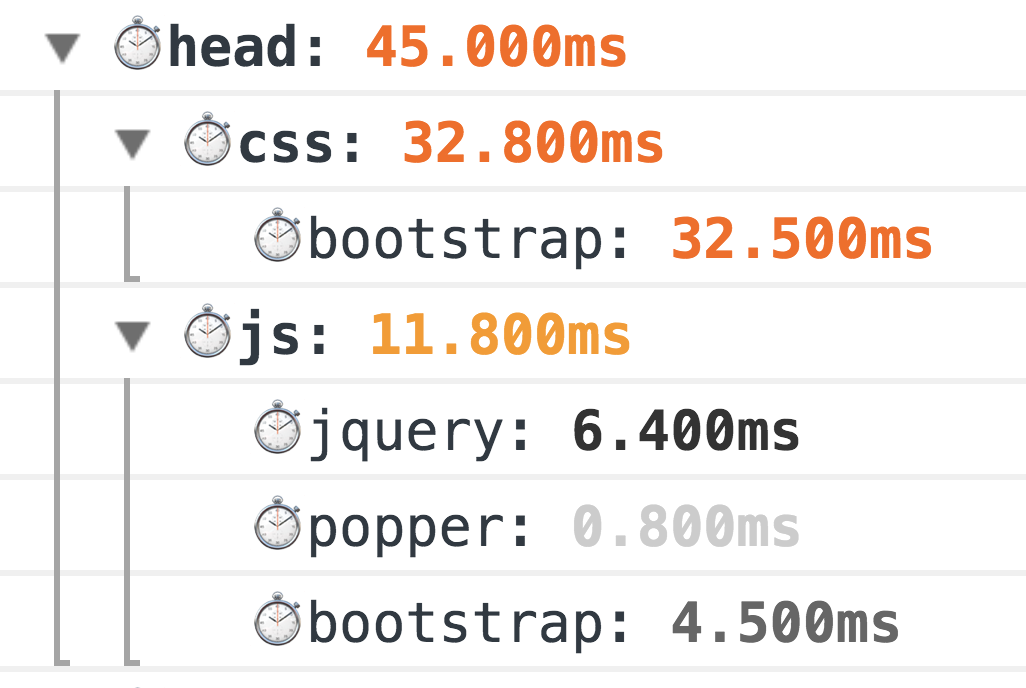
As a result, you will see such beauty in the console:
This is a classic old-fashioned way of measuring, 100% working. But the world does not stand still, and for more accurate measurements, we now have a Resource Timing API (and if resources are on a separate domain, Timing-Allow-Origin, to help you).
And here it is worth talking about classic mistakes when initially loading the page, namely:
- the absence of GZip and HTTP / 2 (yes, this still occurs);
- unreasonable use of fonts (sometimes a font is connected only for the sake of one title or even a phone number in the footer 0_o);
- too common / big CSS / JS bundles.
Ways to optimize page load:
- use Brotli (or even SDCH) instead of GZip, enable HTTP / 2;
- collect only the necessary CSS (critical) and do not forget about CSSO ;
- Minimize the size of the JS bundle by separating the minimum CORE bundle and load the rest on demand, i.e. asynchronously;
- load JS and CSS in a non-blocking mode, dynamically creating
/> <sript src="..."/>, ideally load JS after the main content; - use SVG instead of PNG, and if you combine it with JS, then this will get rid of redundant XML (for example, like font-awesome );
- use lazy loading both for images and iframe (besides, native support will appear in the near future).
Time of the first drawing and interactivity (TTI)
The next stage after the download is the moment when the user saw the result, and the interface went online. For this we need Performance Paint Timing and PerformanceObserver .With the first one, everything is simple, call
performance.getEntriesByType('paint') and get two metrics:- first-paint - the first draw;
- first-contentful-paint - and full first render.

An example of how the paint extension for @ perf-tools / keeper works.
But with the following metric, Time To Interactive, everything is a little more interesting. There is no exact way to determine when your application has become interactive, i.e. accessible to the user, but this can be indirectly understood by the absence of longtasks :
// TTI let ttiLastEntry: PerformanceEntry | undefined; let ttiPerfObserver: PerformanceObserver; try { ttiPerfObserver = new PerformanceObserver((list) => { ttiLastEntry = list.getEntries().pop(); }); ttiPerfObserver.observe({ entryTypes: ['longtask'], }); } catch (_) {} domReady(() => { // TTI Check if (ttiPerfObserver) { let tti: number; const check = () => { if (ttiLastEntry) { tti = ttiLastEntry.startTime + ttiLastEntry.duration; if (now() - tti >= options.ttiDelay) { // logntask , , // ;] send('tti', 'value', 0, tti); ttiPerfObserver.disconnect(); } else { setTimeout(check, options.ttiDelay); } } else if (tti) { send('tti', 'value', 0, tti); ttiPerfObserver.disconnect(); } else { // logntask, , // , DOMReady! tti = now(); setTimeout(check, 500); } } // check(); } }); 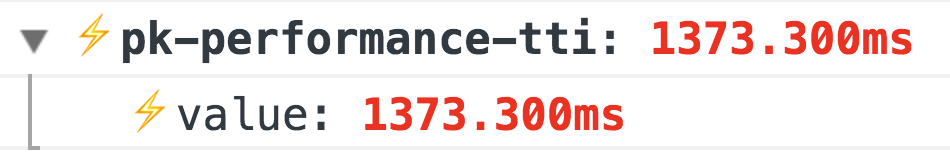
An example of the performance extension for @ perf-tools / keeper .
In addition to these basic metrics, your application readiness metric is still needed, i.e. somewhere in your code should be like:
Import { system } from '@perf-tools/keeper'; export function applicationBoot(el, data) { const app = new Application(el, data); // app.ready(() => { system.add('application-ready', 0, system.perf.now()); // ️application-ready: 3074.000ms }); return app; } The speed of reaction to user actions
There is a huge field for metrics and they are very individual, so I’ll tell you about two basic ones that are suitable for any project, namely:first-event - the time of the first event, for example, the first click (with the division where the user poked), this metric is especially relevant for all sorts of search results, a list of goods, news feeds, etc. With it, you can control how the reaction time and user flow from your actions change (changes in: design / new features / optimization, etc.)

An example of the performance extension for @ perf-tools / keeper .
latency - the delay in processing some events, for example:
click , input , submit , scroll , etc.To measure the delay, it is enough to hang up the event handler on the
window with capture = true and through the requestAnimationFrame calculate the difference, this will be the delay: window.addEventListener(eventType, ({target}) => { const start = now(); requestAnimationFrame(() => { const latency = now() - start; if (latency >= minLatency) { // …. } }); }, true); 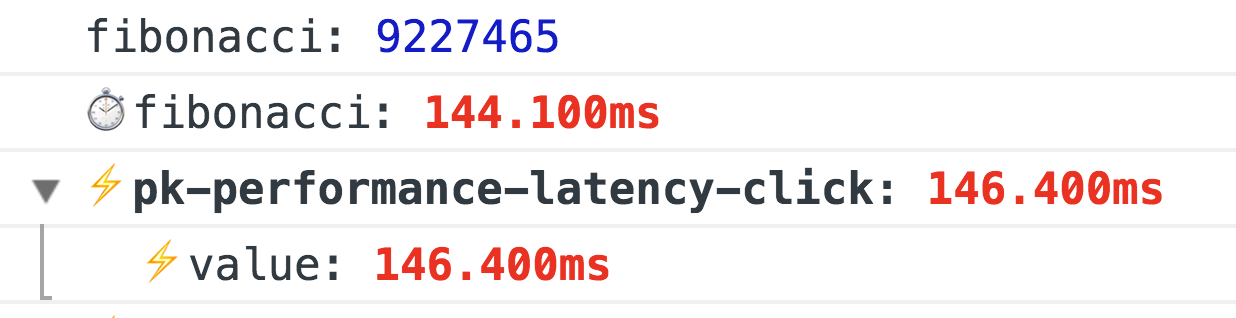
An example of the performance extension for @ perf-tools / keeper when the Fibonnachi Number is calculated per click.
FPS scrolling and animations
This is the most interesting metric, it is usually measured throughrequestAnimationFrame , and if you need to do a constant FPS measurement, then the classic FPSMeter will do (although it is overly optimistic). But it is not good at all if you need to measure the smoothness of the page scrolling, because he needs a "warm up". And then I came across a very interesting way .Ingeniously, in fact, we simply create a transparent div (1x1px), add a
transition: left 300ms linear and start it from one corner to another, and while it is animating, we check its real left through requestAnimationFrame , and if the new length is different from the previous one, then we increase the number of rendered frames (otherwise we have FPS drawdown).And that's not all, if you use FF, then there simply is a mozPaintCount , which is responsible for the number of rendered frames, i.e. remember “BEFORE”, and on
transitionend we calculate the difference.So, without any warm-up, we know for sure whether the browser redrawn the frame or not.
Even in the near future they promise a normal API: http://wicg.imtqy.com/frame-timing/
 |  |
Scrolling optimization:
- the simplest thing is to do nothing on the scroll, or to postpone execution via
requestAnimationFrame, or evenrequestIdleCallback; - very carefully use
pointer-events: none, turning it on and off may have the opposite effect, so it is better to conduct an A / B experiment usingpointer-eventsand without; - Do not forget about virtualized lists, almost all View engines now have such components, but again, be careful, the elements of such a list should be as simple as possible, or use “dummies” that will be replaced with real elements after the scrolling is completed. If you write a virtualized list yourself, then no inner HTML and do not forget about DOM Recycling (this is when you do not create DOM elements for each sneeze, but reuse them).
Application Initialization
There is only one rule: detail so that you can exactly answer what exactly eaten up the time from the initialization of the application to the final launch. As a result, you should get at least the following metrics:- how much time was spent on resolving each addiction;
- time to receive and prepare data for the application;
- Render of the application with detail in blocks.
Those. at the output, you should have such metrics that you can track exactly on which phase you have a drawdown.
Work example
Console 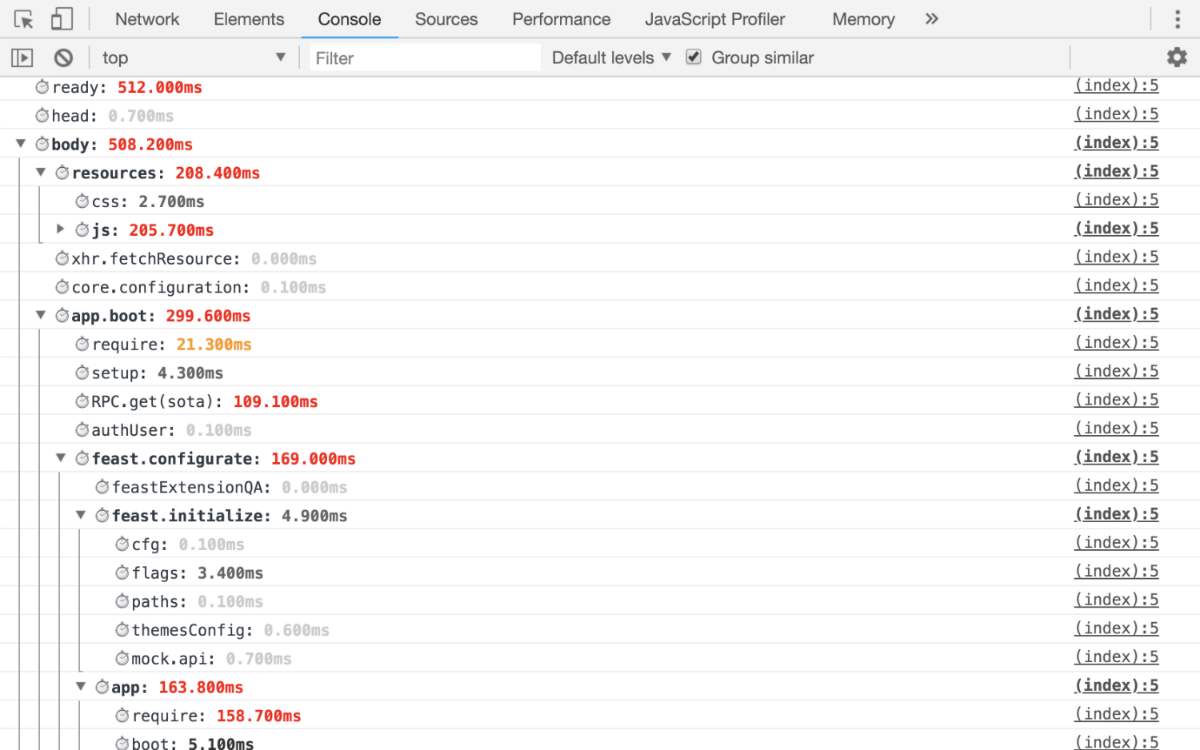
User Timing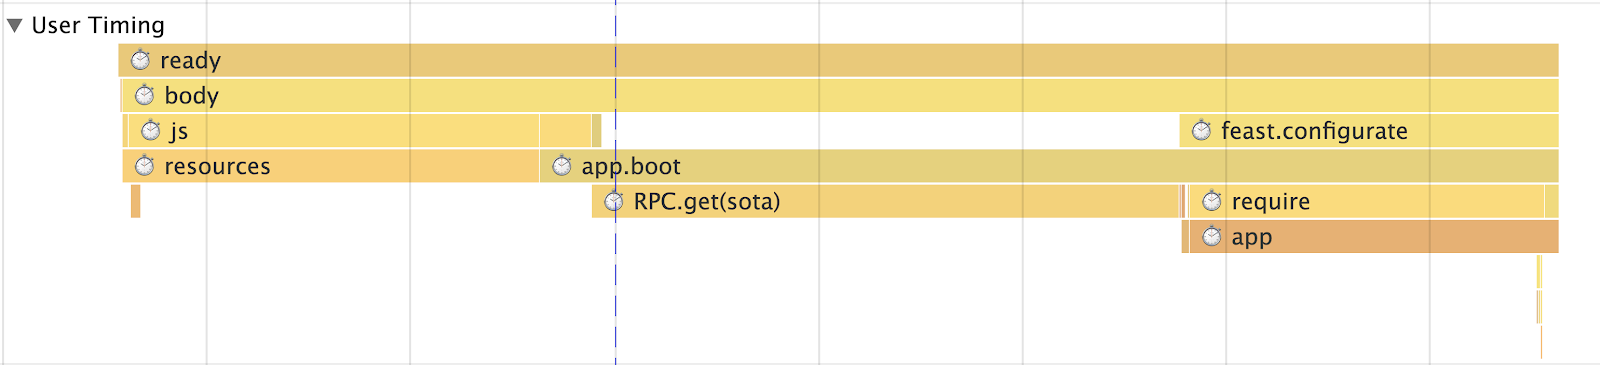
User Timing
If you have a SPA, then you need to measure the routing time
First, there should be a common metric to evaluate performance (time to go along the route) as a whole, but you also need to have a metric for each route (for example, we have “List of threads”, “Read thread”, “Search”, etc.). d), the metric itself should be broken down into submetrics:- Data acquisition (with partitioning, which ones)
- Treatment
- Update
- Render
- Total application
- Blocks (for example, with us, it will be: “Left column” (it’s “List of folders”), “Smart search string”, “List of letters” and in the same spirit)
Without all this, it is impossible to understand where the problems begin, so many of our modules out of the box have timings (for example, the same module for XHR has
startTime and endTime , which are automatically logged).But these metrics are not enough to adequately assess what is happening. They are too general, because we are talking about SPA, then you definitely have some kind of Runtime Cache (so as not to go to the server once again if you have already been there), so our metrics are further divided into routing with and without cache. Also, specifically in our case, we divide the metric by the number of entities in it. In other words, it is impossible to add a “Thread” view into one metric with 1, 5, 10 or 100+ letters, so if you have any list output, you must select control points and additionally divide the metric.
Memory and traffic consumption
Let's start with the memory . And here we are in for a big disappointment. At the moment there is only non-standardized (Chrome only) performance.memory, which gives out ridiculously low numbers. But still they need to be measured and see how the application “flows” over time: |  |  |
Traffic . To count traffic, you will need Timing-Allow-Origin (if the resources are in a separate domain) and Resource Timing API , this will help not only to calculate the traffic, but also to detail it:
- what protocol is used (HTTP / 1, HTTP / 2, etc.);
- types of downloadable resources;
- how long it took to download them;
- size, moreover, you can still understand whether the resource is loaded on the network or taken from the cache.
 |  |  |
What does traffic count do?
- The most important thing is that it allows you to see the real picture, and not as usual CSS + JS and besides this, how this “picture” changes over time.
- Then you can analyze what is being loaded, divide resources into groups, etc.
- How well caching works for you.
- Are there any anomalies, for example, after 15 minutes of work, for example, the code entered into recursion and endlessly loads some resource, traffic monitoring will help with this.
Well, in a follow-up report from my colleague Igor Druzhinin on this topic: Assessing the quality of the application's performance - monitoring traffic consumption
Analytics
We have set the metrics, and then what? And then they need to be sent somewhere. And then either you bring up some Graphite , or, for starters, you can use Google Analytics or similar for the purposes of aggregation of data.And do not forget, it is not enough just to get a schedule, for all important metrics there should be percentiles that allow you to understand, for example, what percentage of the audience the project loads for <1s, <2s, <3s, <5s, 5s +, etc.
We write high-performance code
At first I wanted to write something meaningful here, they say, use WebWorker, do not forget torequestIdleCallback or something exotic, for example, requestIdleCallback -through Runtime Cache through browser tabs using SharedWorker or ServiceWorker (which is not just about caching, if that). But this is all very abstract, and many topics are beaten to impossibility, so I’ll just write the following:- Initially cover your code with metrics that will measure its performance.
- Do not believe benchmarks with jsperf. The vast majority of them are written poorly, and simply taken out of context. The best benchmark is a real metric on the project, according to which you will see the effect of your actions.
- Remember about the perception of performance, or rather the Weber-Fechner law. Namely, if you have started optimization, then do not roll out the changes until it becomes better by at least 20%, otherwise users simply will not notice. The same law works in the opposite direction.
- Fear regulars, especially generated ones. They can not only suspend the browser, but also get the XSS, which is why we do not allow HTML parsing in our Mail using them, only through DOM's bypass.
- You do not need to use arrays to enter a value into one or another group; for this you have an
objector aSet(for example, instead ofsuccessSteps.includes(currentStep)you needsuccessSteps.hasOwnProperty(currentStep)), O (1) is our everything. - The expression “Premature optimization is the root of all evil” is not about what you write as you wish. If you know how to best, write best.
Still, I'll write a couple of paragraphs about the code and its optimization.
DOM . Very often I hear “The Problem in the DOM” - this, of course, is true, but given the fact that almost everyone now has an abstraction over it. The bottleneck is precisely it, or rather your code, which is responsible for the formation of the view and the business logic.
But if we talk about DOM, for example, instead of deleting a fragment from the DOM, it is better to hide it or deattach it. If you still need to delete, then put this operation in
Immediately make a reservation, use this approach wisely, or you can shoot a knee.
We also use another interesting technique on the lists, for example, the “List of Threads”. The essence of the technique is that instead of one global “List” and updating its data, we generate a “List of Trades” for each “Folder”. As a result, when the user goes between the "Folders", one list is removed from the DOM (not deleted), and the other is updated either partially or not at all. And not all, as in the case of the "Unified List".
All this gives an instant response to user actions.
Mathematics . All mathematics can be easily removed either in the Worker or in the WebAssembly, this has been working for a long time.
Transpillers Oh, many people do not even think about the fact that the code they write passes through the transpiler. Yes, they know about him, but that's all. But that he will turn them no longer care. Indeed, in DevTools they see the result of the source map.
Therefore, study the tools that you use, for example, the same babel in the playground has the opportunity to see how it generates code depending on the selected presets, just look at the same
Subtleties of language . Even fewer people know about the monomorphism of the code, or trite why bind is slow and ... you finally use
Data and prekeshiry . Less requests, more caching. In addition, very often we use the technique of "foresight", this is when we load data in the background. For example, after the “List of threads” render, we start loading N-unread threads in the current “Folder”, so that when you click on them, the user immediately switches to “Reading,” and not just another “loader”. We use this technique not only for Data, but also for JS. For example, “Writing a Letter” is a huge bundle (because of the editor), but not all letters are written and not immediately, so we ship it in the background, after the application is initialized.
Lovers I don’t know why, but I didn’t see articles that would teach you how not to do a loader, but on the contrary, to take at least a presentation of the “future” React, in which a lot of time was devoted to this problem within Suspense. But after all, the ideal application is without loaders, we in the Post have been trying to show it for a very long time only in emergency situations.
In general, we have such a policy, no data, no view, nothing to draw a semi-interface, first load the data and only then “draw”. That is why we use the "foresight" of where the user is going to go and load this data so that the user does not see the loader. In addition, our data layer, which has persistence, i.e. if you somewhere in the same place requested the “Thread”, then the next time you request from another or the same place, there will be no request, we will take the data from the Runtime Cache (more precisely, the link to the data). And so in everything, collections of threads are also just references to data.
But if you still decide to make a loader, then do not forget the basic rules that will make your loader less annoying:
These simple rules are needed so that the loader appears only on heavy requests and does not “blink” on completion. But most importantly, the best louder is a louder that has not appeared.
But if we talk about DOM, for example, instead of deleting a fragment from the DOM, it is better to hide it or deattach it. If you still need to delete, then put this operation in
requestIdleCallback (if possible), or divide the destruction process into two phases: synchronous and asynchronous.Immediately make a reservation, use this approach wisely, or you can shoot a knee.
We also use another interesting technique on the lists, for example, the “List of Threads”. The essence of the technique is that instead of one global “List” and updating its data, we generate a “List of Trades” for each “Folder”. As a result, when the user goes between the "Folders", one list is removed from the DOM (not deleted), and the other is updated either partially or not at all. And not all, as in the case of the "Unified List".
All this gives an instant response to user actions.
Mathematics . All mathematics can be easily removed either in the Worker or in the WebAssembly, this has been working for a long time.
Transpillers Oh, many people do not even think about the fact that the code they write passes through the transpiler. Yes, they know about him, but that's all. But that he will turn them no longer care. Indeed, in DevTools they see the result of the source map.
Therefore, study the tools that you use, for example, the same babel in the playground has the opportunity to see how it generates code depending on the selected presets, just look at the same
yeild , await or for of .Subtleties of language . Even fewer people know about the monomorphism of the code, or trite why bind is slow and ... you finally use
handleEvent !Data and prekeshiry . Less requests, more caching. In addition, very often we use the technique of "foresight", this is when we load data in the background. For example, after the “List of threads” render, we start loading N-unread threads in the current “Folder”, so that when you click on them, the user immediately switches to “Reading,” and not just another “loader”. We use this technique not only for Data, but also for JS. For example, “Writing a Letter” is a huge bundle (because of the editor), but not all letters are written and not immediately, so we ship it in the background, after the application is initialized.
Lovers I don’t know why, but I didn’t see articles that would teach you how not to do a loader, but on the contrary, to take at least a presentation of the “future” React, in which a lot of time was devoted to this problem within Suspense. But after all, the ideal application is without loaders, we in the Post have been trying to show it for a very long time only in emergency situations.
In general, we have such a policy, no data, no view, nothing to draw a semi-interface, first load the data and only then “draw”. That is why we use the "foresight" of where the user is going to go and load this data so that the user does not see the loader. In addition, our data layer, which has persistence, i.e. if you somewhere in the same place requested the “Thread”, then the next time you request from another or the same place, there will be no request, we will take the data from the Runtime Cache (more precisely, the link to the data). And so in everything, collections of threads are also just references to data.
But if you still decide to make a loader, then do not forget the basic rules that will make your loader less annoying:
- no need to show the loader immediately, at the time of sending the request, there should be a delay of at least 300-500 ms before the display;
- After receiving the data, you do not need to drastically remove the loader, again there should be a delay.
These simple rules are needed so that the loader appears only on heavy requests and does not “blink” on completion. But most importantly, the best louder is a louder that has not appeared.
Thank you for your attention, everything, measure, analyze and use PerfKeeper ( Live example ), as well as my github and twitter , in case of questions!
Source: https://habr.com/ru/post/454920/
All Articles