Development of visual tests based on Gemini and Storybook
Hi, Habr! In this article I want to share the experience of developing visual tests in our team.
It so happened that we didn’t think about testing the layout right away. Well, some frame will move out a couple of pixels, well, we'll fix it. In the end, there are testers - a fly will not fly past them. But the human factor cannot be fooled - it is far from always physically possible for even a tester to detect minor changes in the user interface. The question arose when a serious optimization of the layout and the transition to BEM was started. It would have definitely not been without losses and we desperately needed an automated way to detect situations when, as a result of the edits, something in the UI starts to change differently than it was intended, or not where it was intended.
Any developer knows about unit testing. Unit tests provide confidence that changes in the code did not break anything. Well, at least they did not break in the part for which there are tests. The same principle can be applied to the user interface. Just as unit tests test classes, visual tests test the visual components that make up the application's user interface.
For visual components, you can also write “classic” unit tests, which, for example, initiate rendering of components with different values of input parameters and check the expected state of a DOM tree using assert statements, comparing with the standard either individual elements or a snapshot of a DOM tree generally. Visual tests are also based on snapshots, but already on snapshots of visual display components (screenshots). The essence of the visual test is to compare the snapshot taken during the test with the reference one and, if differences are found, either accept the new snapshot as a reference or correct the bug that caused these differences.
')
Of course, “screening” individual visual components is not very effective. Components do not live in a vacuum and their mapping can depend on either the top-level components or the neighboring ones. No matter how we test individual components, the picture as a whole may have defects. On the other hand, if you take pictures of the entire application window, then many of the pictures will contain the same components, which means that if you change a single component, we will have to update all the pictures in which this component is present.
True, as usual, somewhere in the middle - you can draw the whole page of the application, but take a snapshot of only one area under which the test is created, in the particular case this area may coincide with the area of a specific component, but it will already be a component not in vacuum, and in quite a real environment. And it will already be like a modular visual test, although it is hardly possible to talk about modularity if the “module” knows something about the environment. Well, okay, it is not so important to which category of tests to assign visual tests - to modular or integration. As the saying goes, "you checkers or go?"
To speed up the execution of tests, page rendering can be done in any headless browser that does all the work in memory without being displayed on the screen and provides maximum speed. But in our case, it was critically important to ensure that the application works in Internet Explorer (IE), which does not have a headless mode, and we needed a tool for programmatically controlling browsers. Fortunately, everything has already been invented before us and there is such a tool - it is called Selenium . As part of the Selenium project, drivers are being developed to control various browsers, including the driver for IE. Selenium server can manage browsers not only locally, but also remotely, forming a cluster of selenium-servers, the so-called selenium grid.
Selenium is a powerful tool, but the threshold for entering it is quite high. We decided to look for ready-made tools for visual testing based on Selenium and came across a great product from Yandex called Gemini . Gemini can take pictures, including pictures of a specific area of the page, compare pictures with reference ones, visualize the difference and take into account such moments as anti-aliasing or a blinking cursor. In addition, Gemini can repeat the execution of fallen tests, parallelize the execution of tests and many other useful buns. In general, we decided to try.
Tests on gemini are written very simply. First you need to prepare the infrastructure - install selenium-standalone and run the selenium server. Then configure gemini, specifying in the configuration the address of the application under test (rootUrl), the address of the selenium server (gridUrl), the composition and configuration of browsers, as well as the necessary plug-ins for generating reports and optimizing the compression of images. Configuration example:
The tests themselves are a set of suites, each of which takes one or more pictures (states). Before taking a snapshot (the capture () method), you can set the page to be removed using the setCaptureElements () method, and also perform some preparatory actions in the browser context using either the methods of the actions object or using arbitrary JavaScript code for This in the actions is the method executeJS ().
Example:
The test tool was chosen, but the final solution was still far away. It was necessary to understand what to do with the data displayed in the images. Let me remind you that in the tests we decided to draw not the individual components, but the entire page of the application, in order to test the visual components not in a vacuum, but in the real environment of other components. If it is enough to transfer the necessary test data to ee props (I’m talking about react components) to render a separate component, then to render the whole page of the data application you need a lot more and preparing the environment for such a test can be a headache.
You can, of course, leave the data to the application itself, so that during the execution of the test it would perform requests to the backend, which, in turn, would receive data from some kind of reference database, but what about the versioning? Database in the git-repository will not put. No, well, you can of course, but there are some propriety.
Alternatively, to perform tests, you can replace the real backend server with a fake one that would give the web application not the data from the database, but static data stored, for example, in json format, already with the source code. However, the preparation of such data is also not too trivial. We decided to go an easier way - not to pull data from the server, but simply before performing the test, restore the state of the application (in our case, this is the state of redux storage ) that was in the application at the time of the reference snapshot.
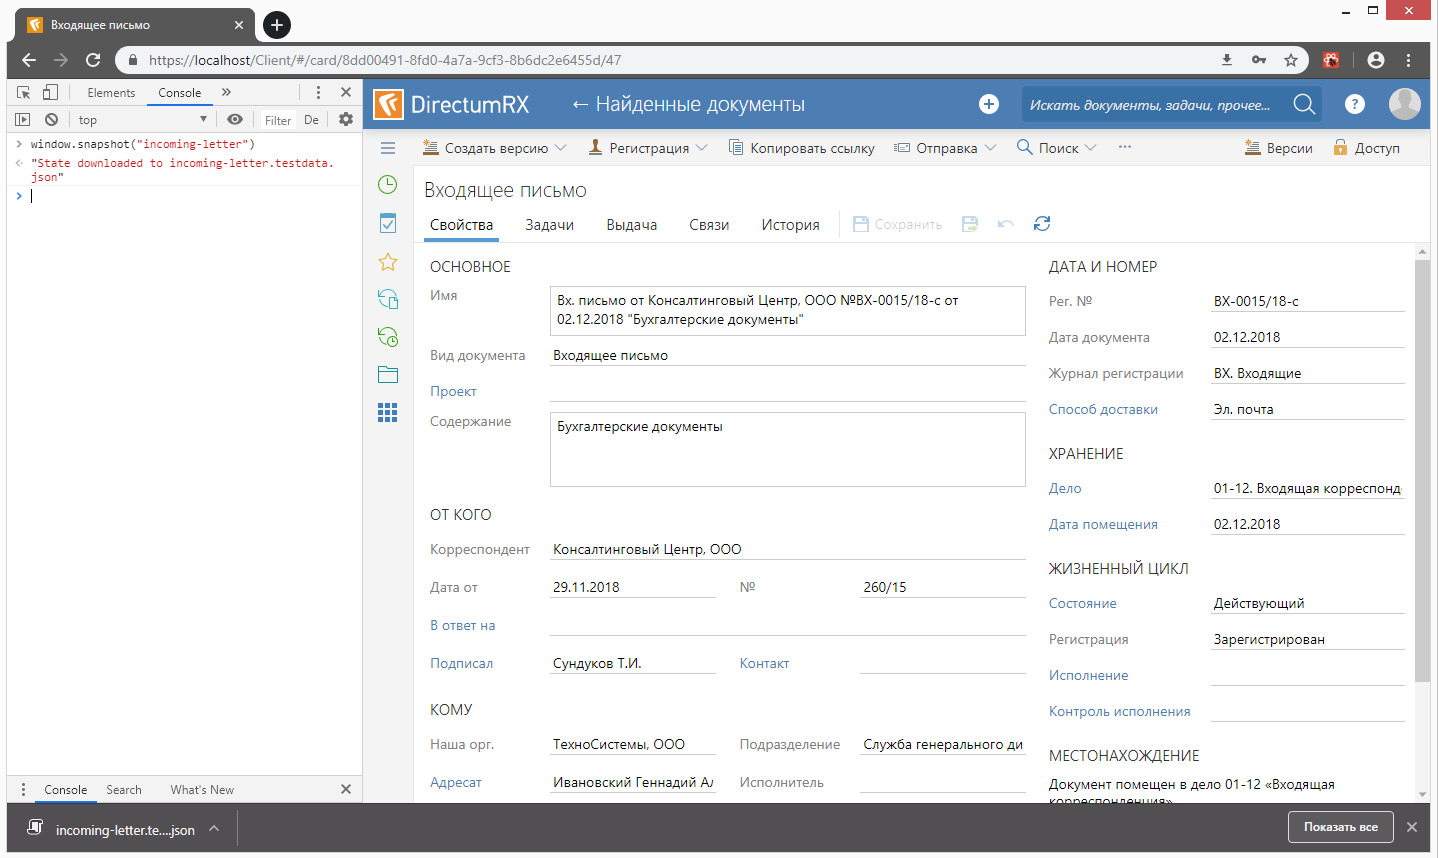
To serialize the current state of the redux storage, the snapshot () method has been added to the window object:
Using this method, using the browser console command line, you can save the current state of the redux storage to a file:
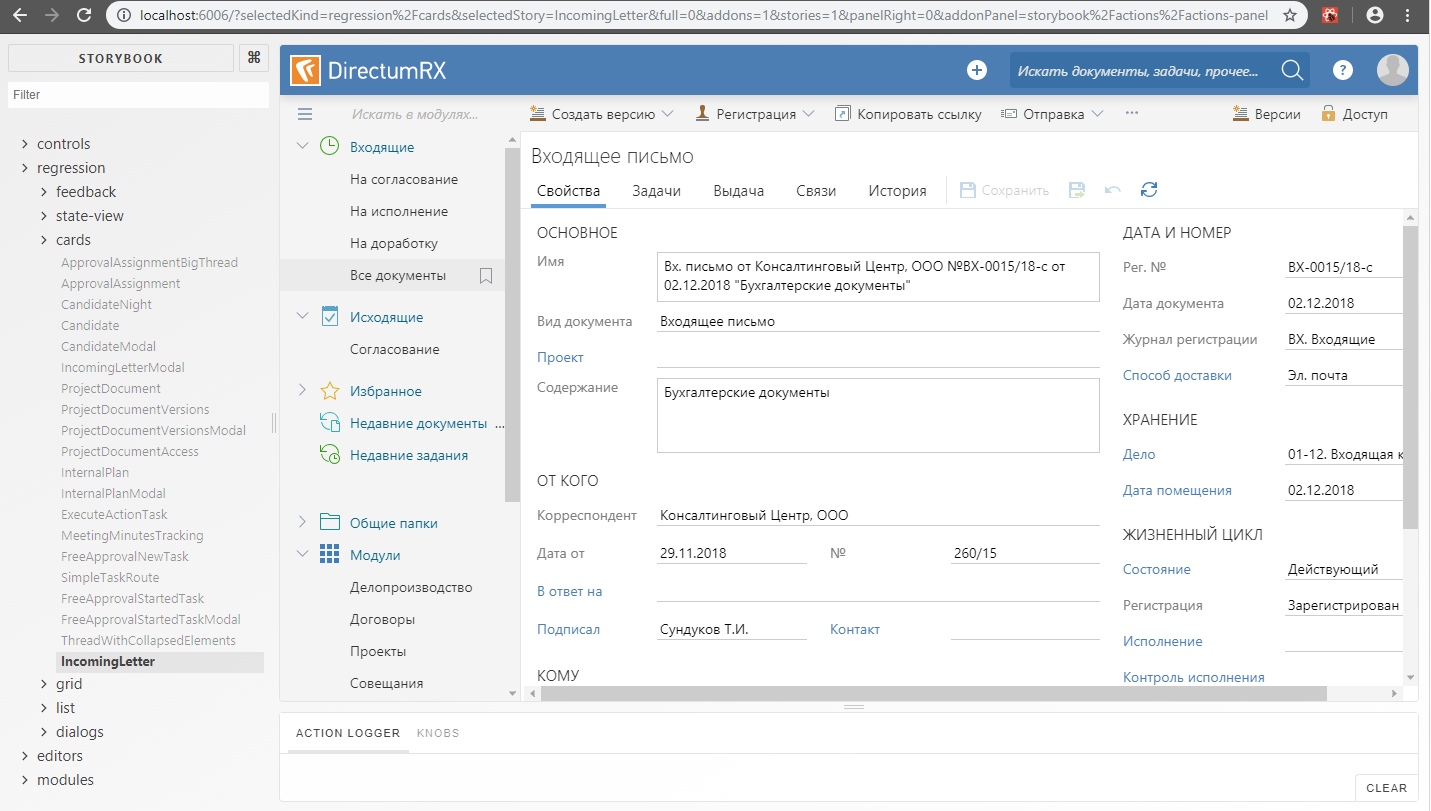
Storybook was chosen as an infrastructure for visual tests - a tool for interactive development of visual component libraries. The main idea was to fix various states of our application instead of various component states in the stories tree and use these states to take screenshots. In the end, there is no fundamental difference between simple and complex components, except in the preparation of the environment.
So, each visual test is a story, before rendering of which the redux-storage state, previously saved to a file, is restored. This is done using the Provider component from the react-redux library, in the store property of which the deserialized state is retrieved, which was restored from the previously saved file:
In the example above, ContextContainer is a component that includes the “skeleton” of the application — the navigation tree, the header, and the content area. In the content area, various components can be drawn (list, card, dialog, etc.) depending on the current state of the redux storage. In order for the component not to perform unnecessary requests to the backend, the corresponding stub properties are passed to it.
In the context of a Storybook, it looks like this:
So, with the data for the tests we figured out. The next challenge is to make friends with Gemini and Storybook. At first glance, everything is simple - in the Gemini config we specify the address of the application under test. In our case, this is the Storybook server address. It is only necessary to raise the storybook server before running gemini tests. You can do this directly from the code using a subscription to the Gemini START_RUNNER and END_RUNNER events:
The test server used the http-server, which provides the contents of a folder with a statically assembled storybook (the build-storybook command is used to build a static storybook ).
Until now, everything went smoothly, but the problems were not long in coming. The fact is that the storybook displays the story inside the frame. Initially, we wanted to be able to set a custom snapshot area using setCaptureElements (), but this can only be done if you specify the frame address as the address for the suite, like this:
But then it turns out that for each shot we have to create our own suite, since The URL can be set for the suite as a whole, but not for a separate snapshot within the suite. It should be understood that each suite is executed in a separate browser session. This is, in principle, correct - tests should not depend on each other, but opening a separate browser session and the subsequent Storybook download takes quite a long time, much more than just moving through stories within an already open Storybook. Therefore, with a large number of suites, test runtime sags heavily. Partially, the problem can be solved by parallelizing the execution of tests, but parallelization takes a lot of resources (memory, processor). Therefore, having decided to save on resources and not lose too much in the duration of the test run, we refused to open the frame in a separate browser window. Tests are performed within a single browser session, but before each snapshot, the next story is loaded into the frame as if we just opened the storybook and began clicking on individual nodes in the stories tree. Image area - the whole frame:
Unfortunately, in this version, besides the possibility to select a snapshot area, we also lost the ability to use standard actions of the Gemini engine for working with elements of the DOM tree (mouseDown (), mouseMove (), focus (), etc.), etc. to. the elements inside the Gemini frame do not “see”. But we still have the opportunity to use the executeJS () function, with which you can execute JavaScript code in the context of the browser. On the basis of this function, we have implemented the analogs of standard actions that we need, which already work in the context of the Storybook frame. Here we had to “conjure” a little bit in order to transfer the parameter values from the test context to the browser context - unfortunately, executeJS () does not provide such an opportunity. Therefore, at first glance, the code looks somewhat strange - the function is translated into a string, a part of the code is replaced with the parameter values, and in ExecuteJs () the function is restored from the string using eval ():
After the visual tests were written and started to work, it turned out that some tests were not very stable. Somewhere the icon does not have time to draw, somewhere the selection will not be removed and we get a mismatch with the reference image. Therefore, it was decided to include repeat tests. However, in Gemini, the replays work for the entire suite, and as mentioned above, we tried to avoid situations where each suite has its own suite - this slows down the tests too much. On the other hand, the more pictures taken within the framework of one suite, the more likely it is that the repeated execution of the suite can fall as well as the previous one. Therefore it was necessary to implement repetitions. In our scheme, the repetition of execution is done not for the entire suite, but only for those pictures that did not pass on the previous unsuccessful run. To do this, in the handler of the TEST_RESULT event, we analyze the result of comparing a snapshot with a standard, and for non-compared snapshots, and only for them, create a new suite:
By the way, the TEST_RESULT event was also useful for visualizing the progress of test execution as it passes. Now the developer does not need to wait for all the tests to be executed; he can interrupt the execution if he sees that something has gone wrong. When interrupting the execution of tests, Gemini will correctly close browser sessions opened by the selenium server.
Upon completion of the test run, if the new suite is not empty, run it until the maximum number of repetitions has been exhausted:
To date, we have about fifty visual tests covering the main visual states of our application. Of course, there is no need to talk about full coverage with UI tests, but so far we have not set such a goal. Tests successfully work both at workplaces of developers, and at build-agents. While tests are performed only in the context of Chrome and Internet Explorer, but in the future it is possible to connect other browsers. All this economy serves Selemium grid with two nodes deployed in virtual machines.
Periodically, we are faced with the fact that after the release of the new version of Chrome, we have to update the reference images due to the fact that some elements began to be displayed a little differently (for example, scrollers), but there's nothing you can do about it. Rarely, but it happens that when you change the structure of the redux-storage, you have to re-recall the saved states for the tests. It is not easy to restore exactly the same state that was in the test at the time of its creation. As a rule, no one already remembers on which database these snapshots were taken and you have to take a new snapshot already on other data. This is a problem, but not very big. To solve it, you can take pictures on a demo base, since we have scripts for its generation and are kept up to date.
It so happened that we didn’t think about testing the layout right away. Well, some frame will move out a couple of pixels, well, we'll fix it. In the end, there are testers - a fly will not fly past them. But the human factor cannot be fooled - it is far from always physically possible for even a tester to detect minor changes in the user interface. The question arose when a serious optimization of the layout and the transition to BEM was started. It would have definitely not been without losses and we desperately needed an automated way to detect situations when, as a result of the edits, something in the UI starts to change differently than it was intended, or not where it was intended.
Any developer knows about unit testing. Unit tests provide confidence that changes in the code did not break anything. Well, at least they did not break in the part for which there are tests. The same principle can be applied to the user interface. Just as unit tests test classes, visual tests test the visual components that make up the application's user interface.
For visual components, you can also write “classic” unit tests, which, for example, initiate rendering of components with different values of input parameters and check the expected state of a DOM tree using assert statements, comparing with the standard either individual elements or a snapshot of a DOM tree generally. Visual tests are also based on snapshots, but already on snapshots of visual display components (screenshots). The essence of the visual test is to compare the snapshot taken during the test with the reference one and, if differences are found, either accept the new snapshot as a reference or correct the bug that caused these differences.
')
Of course, “screening” individual visual components is not very effective. Components do not live in a vacuum and their mapping can depend on either the top-level components or the neighboring ones. No matter how we test individual components, the picture as a whole may have defects. On the other hand, if you take pictures of the entire application window, then many of the pictures will contain the same components, which means that if you change a single component, we will have to update all the pictures in which this component is present.
True, as usual, somewhere in the middle - you can draw the whole page of the application, but take a snapshot of only one area under which the test is created, in the particular case this area may coincide with the area of a specific component, but it will already be a component not in vacuum, and in quite a real environment. And it will already be like a modular visual test, although it is hardly possible to talk about modularity if the “module” knows something about the environment. Well, okay, it is not so important to which category of tests to assign visual tests - to modular or integration. As the saying goes, "you checkers or go?"
Tool selection
To speed up the execution of tests, page rendering can be done in any headless browser that does all the work in memory without being displayed on the screen and provides maximum speed. But in our case, it was critically important to ensure that the application works in Internet Explorer (IE), which does not have a headless mode, and we needed a tool for programmatically controlling browsers. Fortunately, everything has already been invented before us and there is such a tool - it is called Selenium . As part of the Selenium project, drivers are being developed to control various browsers, including the driver for IE. Selenium server can manage browsers not only locally, but also remotely, forming a cluster of selenium-servers, the so-called selenium grid.
Selenium is a powerful tool, but the threshold for entering it is quite high. We decided to look for ready-made tools for visual testing based on Selenium and came across a great product from Yandex called Gemini . Gemini can take pictures, including pictures of a specific area of the page, compare pictures with reference ones, visualize the difference and take into account such moments as anti-aliasing or a blinking cursor. In addition, Gemini can repeat the execution of fallen tests, parallelize the execution of tests and many other useful buns. In general, we decided to try.
Tests on gemini are written very simply. First you need to prepare the infrastructure - install selenium-standalone and run the selenium server. Then configure gemini, specifying in the configuration the address of the application under test (rootUrl), the address of the selenium server (gridUrl), the composition and configuration of browsers, as well as the necessary plug-ins for generating reports and optimizing the compression of images. Configuration example:
//.gemini.js module.exports = { rootUrl: 'http://my-app.ru', gridUrl: 'http://127.0.0.1:4444/wd/hub', browsers: { chrome: { windowSize: '1920x1080', screenshotsDir:'gemini/screens/1920x1080' desiredCapabilities: { browserName: 'chrome' } } }, system: { projectRoot: '', plugins: { 'html-reporter/gemini': { enabled: true, path: './report' }, 'gemini-optipng': true }, exclude: [ '**/report/*' ], diffColor: '#EC041E' } }; The tests themselves are a set of suites, each of which takes one or more pictures (states). Before taking a snapshot (the capture () method), you can set the page to be removed using the setCaptureElements () method, and also perform some preparatory actions in the browser context using either the methods of the actions object or using arbitrary JavaScript code for This in the actions is the method executeJS ().
Example:
gemini.suite('login-dialog', suite => { suite.setUrl('/') .setCaptureElements('.login__form') .capture('default'); .capture('focused', actions => actions.focus('.login__editor')); }); Test data
The test tool was chosen, but the final solution was still far away. It was necessary to understand what to do with the data displayed in the images. Let me remind you that in the tests we decided to draw not the individual components, but the entire page of the application, in order to test the visual components not in a vacuum, but in the real environment of other components. If it is enough to transfer the necessary test data to ee props (I’m talking about react components) to render a separate component, then to render the whole page of the data application you need a lot more and preparing the environment for such a test can be a headache.
You can, of course, leave the data to the application itself, so that during the execution of the test it would perform requests to the backend, which, in turn, would receive data from some kind of reference database, but what about the versioning? Database in the git-repository will not put. No, well, you can of course, but there are some propriety.
Alternatively, to perform tests, you can replace the real backend server with a fake one that would give the web application not the data from the database, but static data stored, for example, in json format, already with the source code. However, the preparation of such data is also not too trivial. We decided to go an easier way - not to pull data from the server, but simply before performing the test, restore the state of the application (in our case, this is the state of redux storage ) that was in the application at the time of the reference snapshot.
To serialize the current state of the redux storage, the snapshot () method has been added to the window object:
export const snapshotStore = (store: Object, fileName: string): string => { let state = store.getState(); const file = new Blob( [ JSON.stringify(state, null, 2) ], { type: 'application/json' } ); let a = document.createElement('a'); a.href = URL.createObjectURL(file); a.download = `${fileName}.testdata.json`; a.click(); return `State downloaded to ${a.download}`; }; const store = createStore(reducer); if (process.env.NODE_ENV !== 'production') { window.snapshot = fileName => snapshotStore(store, fileName); }; Using this method, using the browser console command line, you can save the current state of the redux storage to a file:
Storybook was chosen as an infrastructure for visual tests - a tool for interactive development of visual component libraries. The main idea was to fix various states of our application instead of various component states in the stories tree and use these states to take screenshots. In the end, there is no fundamental difference between simple and complex components, except in the preparation of the environment.
So, each visual test is a story, before rendering of which the redux-storage state, previously saved to a file, is restored. This is done using the Provider component from the react-redux library, in the store property of which the deserialized state is retrieved, which was restored from the previously saved file:
import preloadedState from './incoming-letter.testdata'; const store = createStore(rootReducer, preloadedState); storiesOf('regression/Cards', module) .add('IncomingLetter', () => { return ( <Provider store={store}> <MemoryRouter> <ContextContainer {...dummyProps}/> </MemoryRouter> </Provider> ); }); In the example above, ContextContainer is a component that includes the “skeleton” of the application — the navigation tree, the header, and the content area. In the content area, various components can be drawn (list, card, dialog, etc.) depending on the current state of the redux storage. In order for the component not to perform unnecessary requests to the backend, the corresponding stub properties are passed to it.
In the context of a Storybook, it looks like this:
Gemini + Storybook
So, with the data for the tests we figured out. The next challenge is to make friends with Gemini and Storybook. At first glance, everything is simple - in the Gemini config we specify the address of the application under test. In our case, this is the Storybook server address. It is only necessary to raise the storybook server before running gemini tests. You can do this directly from the code using a subscription to the Gemini START_RUNNER and END_RUNNER events:
const port = 6006; const cofiguration = { rootUrl:`localhost:${port}`, gridUrl: seleniumGridHubUrl, browsers: { 'chrome': { screenshotsDir:'gemini/screens', desiredCapabilities: chromeCapabilities } } }; const Gemini = require('gemini'); const HttpServer = require('http-server'); const runner = new Gemini(cofiguration); const server = HttpServer.createServer({ root: './storybook-static'}); runner.on(runner.events.START_RUNNER, () => { console.log(`storybook server is listening on ${port}...`); server.listen(port); }); runner.on(runner.events.END_RUNNER, () => { server.close(); console.log('storybook server is closed'); }); runner .readTests(path) .done(tests => runner.test(tests)); The test server used the http-server, which provides the contents of a folder with a statically assembled storybook (the build-storybook command is used to build a static storybook ).
Until now, everything went smoothly, but the problems were not long in coming. The fact is that the storybook displays the story inside the frame. Initially, we wanted to be able to set a custom snapshot area using setCaptureElements (), but this can only be done if you specify the frame address as the address for the suite, like this:
gemini.suite('VisualRegression', suite => suite.setUrl('http://localhost:6006/iframe.html?selectedKind=regression%2Fcards&selectedStory=IncomingLetter') .setCaptureElements('.some-component') .capture('IncomingLetter') ); But then it turns out that for each shot we have to create our own suite, since The URL can be set for the suite as a whole, but not for a separate snapshot within the suite. It should be understood that each suite is executed in a separate browser session. This is, in principle, correct - tests should not depend on each other, but opening a separate browser session and the subsequent Storybook download takes quite a long time, much more than just moving through stories within an already open Storybook. Therefore, with a large number of suites, test runtime sags heavily. Partially, the problem can be solved by parallelizing the execution of tests, but parallelization takes a lot of resources (memory, processor). Therefore, having decided to save on resources and not lose too much in the duration of the test run, we refused to open the frame in a separate browser window. Tests are performed within a single browser session, but before each snapshot, the next story is loaded into the frame as if we just opened the storybook and began clicking on individual nodes in the stories tree. Image area - the whole frame:
gemini.suite('VisualRegression', suite => suite.setUrl('/') .setCaptureElements('#storybook-preview-iframe') .capture('IncomingLetter', actions => openStory(actions, 'IncomingLetter')) .capture('ProjectDocument', actions => openStory(actions, 'ProjectDocumentAccess')) .capture('RelatedDocuments', actions => { openStory(actions, 'RelatedDocuments'); hover(actions, '.related-documents-tree-item__title', 4); }) ); Unfortunately, in this version, besides the possibility to select a snapshot area, we also lost the ability to use standard actions of the Gemini engine for working with elements of the DOM tree (mouseDown (), mouseMove (), focus (), etc.), etc. to. the elements inside the Gemini frame do not “see”. But we still have the opportunity to use the executeJS () function, with which you can execute JavaScript code in the context of the browser. On the basis of this function, we have implemented the analogs of standard actions that we need, which already work in the context of the Storybook frame. Here we had to “conjure” a little bit in order to transfer the parameter values from the test context to the browser context - unfortunately, executeJS () does not provide such an opportunity. Therefore, at first glance, the code looks somewhat strange - the function is translated into a string, a part of the code is replaced with the parameter values, and in ExecuteJs () the function is restored from the string using eval ():
function openStory(actions, storyName) { const storyNameLowered = storyName.toLowerCase(); const clickTo = function(window) { Array.from(window.document.querySelectorAll('a')).filter( function(el) { return el.textContent.toLowerCase() === 'storyNameLowered'; })[0].click(); }; actions.executeJS(eval(`(${clickTo.toString().replace('storyNameLowered', storyNameLowered)})`)); } function dispatchEvents(actions, targets, index, events) { const dispatch = function(window) { const document = window.document.querySelector('#storybook-preview-iframe').contentWindow.document; const target = document.querySelectorAll('targets')[index || 0]; events.forEach(function(event) { const clickEvent = document.createEvent('MouseEvents'); clickEvent.initEvent(event, true, true); target.dispatchEvent(clickEvent); }); }; actions.executeJS(eval(`(${dispatch.toString() .replace('targets', targets) .replace('index', index) .replace('events', `["${events.join('","')}"]`)})` )); } function hover(actions, selectors, index) { dispatchEvents(actions, selectors, index, [ 'mouseenter', 'mouseover' ]); } module.exports = { openStory: openStory, hover: hover }; Repetitions of execution
After the visual tests were written and started to work, it turned out that some tests were not very stable. Somewhere the icon does not have time to draw, somewhere the selection will not be removed and we get a mismatch with the reference image. Therefore, it was decided to include repeat tests. However, in Gemini, the replays work for the entire suite, and as mentioned above, we tried to avoid situations where each suite has its own suite - this slows down the tests too much. On the other hand, the more pictures taken within the framework of one suite, the more likely it is that the repeated execution of the suite can fall as well as the previous one. Therefore it was necessary to implement repetitions. In our scheme, the repetition of execution is done not for the entire suite, but only for those pictures that did not pass on the previous unsuccessful run. To do this, in the handler of the TEST_RESULT event, we analyze the result of comparing a snapshot with a standard, and for non-compared snapshots, and only for them, create a new suite:
const SuiteCollection = require('gemini/lib/suite-collection'); const Suite = require('gemini/lib/suite'); let retrySuiteCollection; let retryCount = 2; runner.on(runner.events.BEGIN, () => { retrySuiteCollection = new SuiteCollection(); }); runner.on(runner.events.TEST_RESULT, args => { const testId = `${args.state.name}/${args.suite.name}/${args.browserId}`; if (!args.equal) { if (retryCount > 0) console.log(chalk.yellow(`failed ${testId}`)); else console.log(chalk.red(`failed ${testId}`)); let suite = retrySuiteCollection.topLevelSuites().find(s => s.name === args.suite.name); if (!suite) { suite = new Suite(args.suite.name); suite.url = args.suite.url; suite.file = args.suite.file; suite.path = args.suite.path; suite.captureSelectors = [ ...args.suite.captureSelectors ]; suite.browsers = [ ...args.suite.browsers ]; suite.skipped = [ ...args.suite.skipped ]; suite.beforeActions = [ ...args.suite.beforeActions ]; retrySuiteCollection.add(suite); } if (!suite.states.find(s => s.name === args.state.name)) { suite.addState(args.state.clone()); } } else console.log(chalk.green(`passed ${testId}`)); }); By the way, the TEST_RESULT event was also useful for visualizing the progress of test execution as it passes. Now the developer does not need to wait for all the tests to be executed; he can interrupt the execution if he sees that something has gone wrong. When interrupting the execution of tests, Gemini will correctly close browser sessions opened by the selenium server.
Upon completion of the test run, if the new suite is not empty, run it until the maximum number of repetitions has been exhausted:
function onComplete(result) { if ((retryCount--) > 0 && result.failed > 0 && retrySuiteCollection.topLevelSuites().length > 0) { runner.test(retrySuiteCollection, {}).done(onComplete); } } runner.readTests(path).done(tests => runner.test(tests).done(onComplete)); Summary
To date, we have about fifty visual tests covering the main visual states of our application. Of course, there is no need to talk about full coverage with UI tests, but so far we have not set such a goal. Tests successfully work both at workplaces of developers, and at build-agents. While tests are performed only in the context of Chrome and Internet Explorer, but in the future it is possible to connect other browsers. All this economy serves Selemium grid with two nodes deployed in virtual machines.
Periodically, we are faced with the fact that after the release of the new version of Chrome, we have to update the reference images due to the fact that some elements began to be displayed a little differently (for example, scrollers), but there's nothing you can do about it. Rarely, but it happens that when you change the structure of the redux-storage, you have to re-recall the saved states for the tests. It is not easy to restore exactly the same state that was in the test at the time of its creation. As a rule, no one already remembers on which database these snapshots were taken and you have to take a new snapshot already on other data. This is a problem, but not very big. To solve it, you can take pictures on a demo base, since we have scripts for its generation and are kept up to date.
Source: https://habr.com/ru/post/454464/
All Articles