We profile Habr's download or how 189 requests for render pages affect

Some time ago, I became interested in website performance, download optimizations and things like that. And now, having come again to Habr, I thought that I was used to taking a rather fast resource load as a given, without even thinking about how this was achieved. Therefore, I decided to combine business with pleasure - to see how things are going with Habr's performance and what technical solutions were made to optimize it.
For those who are interested to know what has been done so that we receive the content as quickly as possible and what Habr's download from Argentina looks like - I ask for cat.
Training
We will need a fresh version of Chrome / Canary working in anonymous mode (check that you have all the extensions turned off). Also, in the developer console (Developer Tools - F12), in the network tab, you need to set the disable cache flag, because we will only profile the first load, while there are no resources in the cache yet.
Stage One - "On Top"
The main purpose of this part is to get acquainted with the site as a whole, to understand its structure and find out what specific resources it needs.
Open the developer tools, go to the network tab, open the site and at the very bottom of the tab look at the statistics on the use of the network:

The whole site was loaded in 2.02 seconds, which looks just fine (considering the load of Habr). The DomContentLoaded (farther just DCL) event generally appeared in 1.01 seconds, which looks even better. With all this, the site makes 189 requests and loads 9.6MB of resources. This tells us that either the Habra team is a genius (it may well be), and the article should be finished right here (and ask the team for coffee and cookies to them), or remember that I have a 100 MB / c channel and Core I7 . Those. you need to get a little closer to reality and at least limit the width of the channel.
Turn on the Fast 3g mode and look again:

DCL has deteriorated to 3.48 seconds, which is still quite acceptable. But finally the site was loaded for godless 54.76 seconds. Now everything is logical - you can’t just take and download almost 10 megabytes when you have a weak connection. Most likely, the guys did a good job to show us the content as quickly as possible (this is indicated by the fact that even in fast3g DCL mode arises quickly enough), and all that are not critical are left to load in the background. We will check it a little later, and now let's see why we have been loading for so long. Sort all requests by load time:
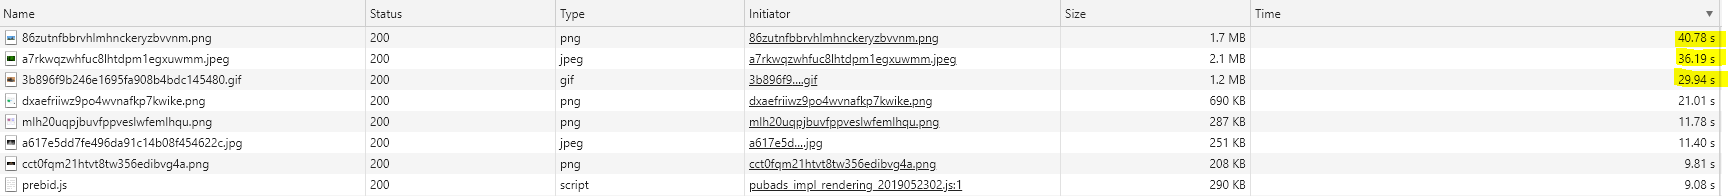
The images (top-7) and one JavaScript file - prebid.js are loaded the longest. If we look at their size, it can be assumed that this is the reason for the slow loading.
With the assumptions you need to be extremely careful. For example, long-term resource loading can be caused not only by file size, but also, for example, problems with DNS, peak load on the storage or cold server cache. Therefore, an unverified assumption may force you to lose time on solving a problem that does not even exist.
Looking at the statistics ( TTFB : 0.610 ms, download: 40,000 ms), we can conclude that our assumption is quite likely. Let's admire our TOP 1 (png, 1560780, 24bit):

In fact, problems with images are mainly problems of our traffic. Images (as opposed to styles and scripts) do not block the rendering of a web page, and therefore, despite the presence of such heavyweights (sometimes worse, they have seen), this has almost no effect on performance. Although, of course, optimization in this direction (for example, transcoding in jpeg2000 or webp, or progressive download would not be superfluous).
As I wrote above, images do not block the rendering of the page. But they use our connection pool, and in HTTP 1.x their number is limited, and with http 2.x and Chrome, too, everything is not as smooth as I heard. Therefore, even here there is a chance that some image may slow down the download of the synchronous script, and that, in turn, will already stop rendering the page. In addition, loading an image can also cause the layout to recalculate, thereby slowing down the render. If we look at the Habr's markup, on almost all img tags there is a width and height. This removes the need to reflow a positive effect on boot performance. Read more about it here .
Let's see what other resources Habr pulls - go through the types and sort by load time. Let's start with javascript
Javascript
JavaScript has several problems in terms of site performance. First of all (everyone knows about it and has been talking for a long time), the synchronous js blocks the further rendering of the page. Those. until we get our JavaScript and execute it, the browser will wait (not really, the browser, especially Chrome, can optimize, but that's another story) and will not render further content. Using synchronous scripts in head, we postpone the moment when the user sees at least something (even text). Therefore, everyone is trying to throw Js to the bottom of the page or even make it asynchronous. It works, but it does not solve the second problem, which is brought to us by the fact that JavaScript is still a scripting language. Therefore, the browser is not enough to just download it - it also needs to be "understood". And here, it turns out that this is a problem, because weak processors (for example, in cheap phones or netbooks, or even good laptops in limited performance mode) do it slowly, blocking the main thread! Below is an example of how an asynchronous ad script got into the critical section of the Habr's render and even a little, but still spoiled the performance. If anyone is interested, here is a very (very, very) good article on this topic.
Habr scripts loads a lot - 1.1 MB (and this is already in a compressed form) for 40 requests. Frankly speaking, this is essential, it will still affect us and something needs to be done about it. We sort our scripts "by waterfall". Our task is to find scripts that have loaded up to the blue line, since it is they (most likely) that prevent us from rendering the site as quickly as possible.
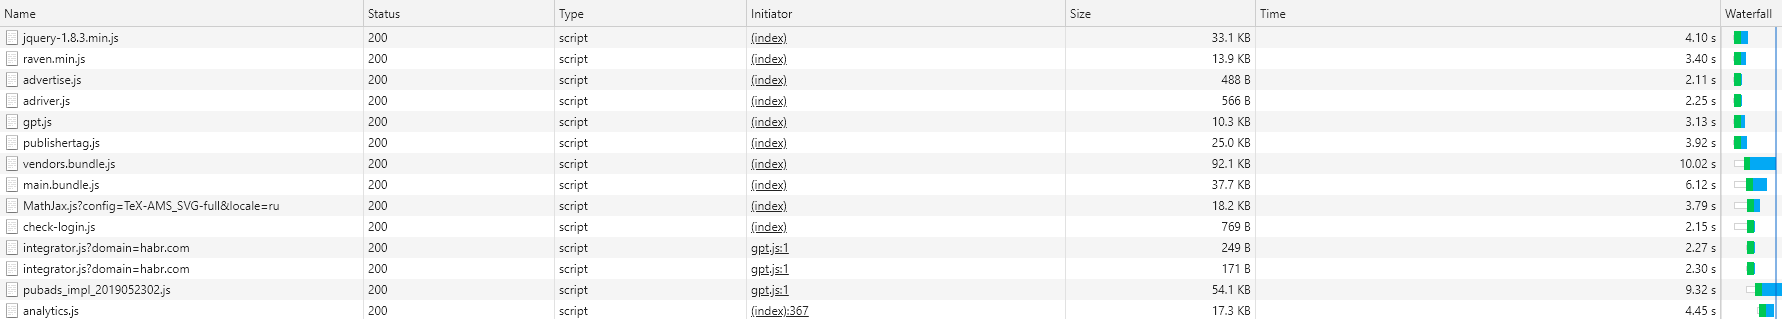
Open the html, which gave us Habr (it is important to look exactly the answer, since the final html will look different) and go through the list. As you can see, jQuery, raven.js, advertise.js and adriver.js are loaded synchronously directly from the head of the tag (i.e., they block everything). Gpt and publisher are loaded from head but asynchronously (i.e., they do not block anything, the browser will render the page further while they are swinging). Vendors, Main and Math, checklogin are loaded at the end, but synchronously (Ie the text is already there, we can read it, but DCL will not appear until they are loaded). The rest of the initial answer does not appear - they are added dynamically, but this is another topic.
So, we found those scripts that somehow influence how quickly we see the text on the page. These are the first candidates for optimization. Ideally, they should be made asynchronous or placed as low as possible in order to allow the browser to render content for us. However, the ideal is not achievable, since most likely there are other scripts on the site that depend on the same jQuery. The desire to download raven as early as possible - a library for tracking various errors that occur on the client can also be understood. But advertise.js and adriver.js are already real candidates for, at least moving down the page, and as a maximum also in asynchronous mode. A similar story with gpt and publisher. Yes, they are loaded asynchronously, but, nevertheless, they can (and will) interfere with us when loading. Therefore, they too could be sent to the bottom of the page. In addition, you can try to use the attributes of Resource Hints - preload / prefetch / dns-prefetch to help the browser know what to load in advance. By the way, I advise you to read about Resource Hints - a very interesting tool, albeit with limited (so far) support.
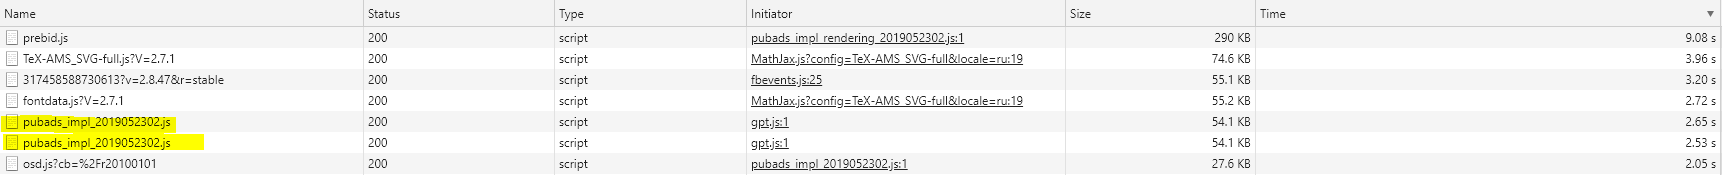
Now sort the list by file size:
https://github.com/Drag13/articles/blob/habrformance/habrformance/scripts.PNG
We see a script that is loaded twice (pubads). We also note that prebid.js is loaded from the not-for-prod folder.

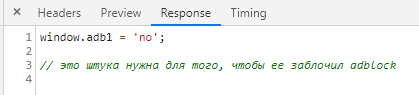
To clear our conscience, we check that all scripts are minified. Suddenly, check-login.js and adriver.js microscripts were not minified. Particularly pleased with the content of the latter:
And with scripts you can temporarily end.
Styles
With styles, everything is also not so simple. First, the synchronous loading of styles also blocks the main stream (although they parse quickly, faster than JavaScript). And secondly, everything is a little more complicated. Why does the browser need CSS? To collect SSOM . And what can JavaScript do with CSS? Correct - change. And what will happen if CSSOM is not yet compiled, and js is already trying to change something there? The answer is - and who knows. Therefore, the browser postpones the execution of JavaScript until the CSSOM is calculated. As correctly written in another very useful article - no CSS = no javascript. Therefore, loading CSS blocks JS execution.
Here are the styles that Habr loads:

As you can see, there are only three of them, with the second and third being loaded in a separate frame, so we ignore them. But the first set of styles is crucial for the entire site. And we downloaded it for a very long time. Why? First, they waited a long time for a response from the server (TTFB 570 ms, we will return to it in the third section), and second, we loaded 713 ms for a long time. What can be done here? The first and simplest is to try to add the preload attribute. This will prompt the browser to start loading CSS as early as possible. The second option is to select the critical CSS and inject it directly into the web page, and load the remnants synchronously (or even asynchronously). This will lead to an increase in the page size (but it is not so small anymore and + 5kb will not spoil anything) and a possible redrawing of the leyauta (loss of time), but you can try.
I will not even show fonts. It is there alone, though for some reason it is loaded from the Habr server directly instead of the CDN (and most likely not just). But I will say thank you for the fact that there is only one font.
This review part of the analysis of the site can be considered complete. Time to go deeper.
Stage Two - "Manual Mode"
At the last stage, we looked at what Habr loads. Now we will see how it is rendered.
Go to the profiling tab. We check what the slowdown fast3g is worth (then we run it again without restrictions) and run it. First of all, we are interested in everything that happens before the First contentful paint (FCP) event, and DCL just in case. Select the area from the start of the download to FCP and look at the final chart.
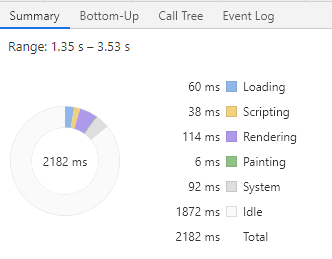
Everything happens pretty quickly - 2.161 sec to FCP (it was faster, but apparently, something has changed), but as you can see, most of the time the browser was idle. The payload took only 14% of the time (about 310 ms). Ideally, the main browser stream runs all the time - parsing html, CSS, executes JS. And then - nothing. Why? Because the browser simply had nothing to do. Remember we cut the traffic? The browser has sent requests and is now just waiting for them to be executed. If we open the network process diagram (the top one), everything will become immediately clear.

In 2029, the browser saw main.bundle.css, sent a request to receive it, and waited. At this time, the prescanner (smart chrome, he knows how to run ahead) found that there are synchronous scripts at the bottom and, not waiting for css to arrive, he sent a request for getting scripts. Then advertise and adriver were loaded (but we remember that while CSSOM is not created, you cannot touch JS), so the browser ignored them. After that, gpt and raven were loaded, but the CSS was still loaded, so they were also ignored. Finally, the CSS was loaded, which the browser parsed for 12 ms and immediately went to the parsit embedded in the JS page. Then the browser again fell asleep for almost 150 ms waiting for jQuery.min.js. And after that, I took up the work seriously - figured out the loaded jQuery (20ms), parsed raven.js (4ms), parsed almost the whole page (36ms), recalculated styles (28ms), calculated the leyout (78 ms + 8 ms) and Finally, for ~ 6 ms, we painted the page. This is where we got FCP. Next, we parse the page, parse the scripts — hello unnecessary (publishertag.js, gpt.js who got into the main thread before DCL), played around with the styles a bit (which caused a slight loss of time due to the leuta recalculation) and started waiting for the vendors. bundle.js. We almost spent another 1100 ms to wait for the vendors. True, in parallel with it, we also loaded main.bundle.js (which, by the way, booted faster), so not everything is so bad. Then everything went well again. Raspasili vendors, Raspari main bundle, Raspars Math.Jax, and finally finished the page and got DCL. True, some handler worked immediately on my I7 to stop the main thread for 80 ms (i.e., the site seemed to hang for 80 ms). Now we almost did not notice this, but on a weak processor, theoretically, this may be noticeable. If this happens with you after the content rendering, this is a reason to check JS.
What can I say. Again, despite how it looks, everything is pretty good. The main problems brought us:
- A large simple browser (including due to the artificial disproportion between the computing power of the computer and the width of the channel, but this is also a completely valid scenario)
- Long loading of CSS which postponed work with critical js
- Synchronous loading of jQuery, vendors and main bundles that stopped the appearance of content.
What can be done with this, we have already discussed:
- Try adding preload attribute for CSS and maybe some JS
- Shrink or shrink CSS
- Trying to throw scripts out of synchronous download at all (at least some)
Now let's repeat the same thing without any restrictions on the width of the channel. The picture is already much better: 0.452 seconds to FMP, the easiest of all! 13 ms. DCL - 953 ms, idle time 15 ms. Here is the download of my dream. That's just it happened because I opened a new tab and did not remove caching. Let's try the same thing, but without the cache:
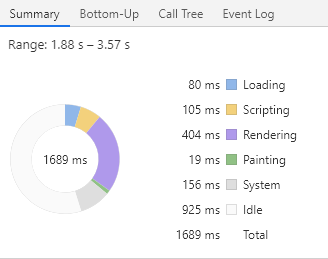
Everything is also quite good, FCP / FMP - 1689, payload 45%. By the way, it is also bad to adjust the load to 100%, since weaker machines will be overloaded. So it is better to have a stock on idle. But, suddenly a lot of time was spent on Rendering - 400 ms for FMP. Of these, 200 ms was spent on recalculation of styles and recalculation of the layout.
By the way, another interesting point. Remember the advertising scripts - gpt.js and publishertag.js which were mentioned in the first part? Now you can see that, despite their asynchrony, they could (albeit a bit) spoil the statistics. This happened because the execution of asynchronous scripts is done by the readiness of the scripts themselves. Those. this can happen at any time, including before FCP / DCL, which happened in 3309.
So, we made a manual disassembly. It's time to uncover automatics.
Stage Three - "From this it was necessary to begin"
I think everyone understands that this study is very conditional. At least, because all the time while I was testing new articles appeared, the load on the server and the load on the network backbones changed. In an amicable way, you need to deploy a dedicated server to which no one will write anything, emulate the relevant load with the relevant delays and only then profile something. Otherwise, you can make some assumption, (for example, about the need to add a preload attribute to CSS), add it, put it on production, and then it turns out that the load during the test has increased dramatically and the same style was given to us by the server already 500 ms later. And it turns out that the preload is bad - it only made everything worse. And the author and the last radish. In addition, profiling manually (as in the second part), until you drove out all the automatic tools and solve the problems found there, also makes little sense, because after the first of your changes the picture will change.
Therefore, before any experiments, we need the most stable environment. This time. Second, you never need to go deep (for example, in profiling) from the very beginning. First run the automatic tools, let them work for you. Collect reports, see what you can do as well as possible in the shortest amount of time. Try it. If you succeed, perhaps this is enough for you. For example, your css.bundle weighs 100kb, but in reality you need 45kb (by the way, the real situation: they took all the bootstrap, and only the net was needed). Reduced the size of the styles and won half a second almost for nothing. These are two. Always check back. It would seem, zainlaynil styles, everything should become better, and worse. And why? And because in the styles of 50kb base64 images, and our page has a total load of 200kb resources. Just remember that there is no silver bullet and universal scenarios. These are three. And finally, even if it contradicts the previous proposal. If your site is not complicated - just monitor TTFB (server problems), download resources (hello logos for 2MB) and don’t allow access to Google Tag Manager from anyone. Most likely this will be quite enough.
Let's not go far, in the same Developer Tools, open the audit tab and run LightHouse (LH) with the following settings: desktop, performance only, no throttling, clear storage. After a short wait (do not leave the page on which you are auditing and do nothing better at all) we get fantastic numbers (even with the cache turned off)
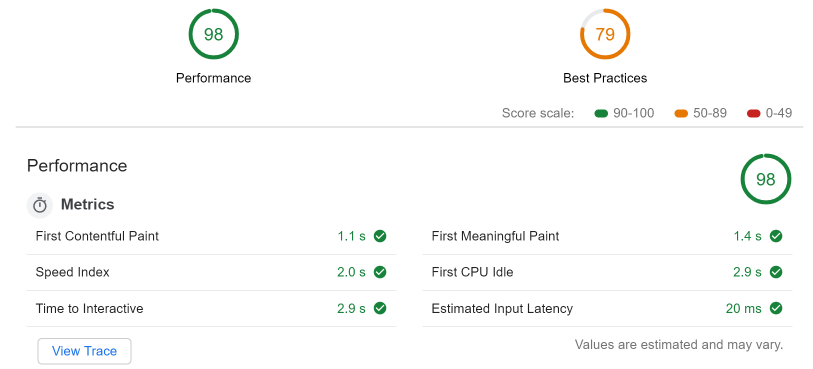
It even seems to me that these figures were specifically tailored to.
At the same time, LH still complains about:
- Outdated image format (suggests using webp, jpeg2000, etc)
- The number of DOM node - too many of them: 2533, with the recommended 1500.
- Too much traffic
- Invalid caching policy - there are no caching headers on 23 resources
- Using document.write
It's all clear. Images compress and transcode (ha), DOM - find who creates so many node (ha ha), set caching to static resources (well, you can), and tear off the document.write from his writer (three ha ha if it's someone else script)
Many of us (and I am no exception to what this article shows) love to give advice. However, much of what has been done has its own, often hidden, reason. In addition, it is easy to give advice, but it is much more difficult to implement them. What is worth only one advice to reduce CSS, - try to figure out which styles are not needed if there are tons of them, and some of the styles come from JavaScript. Plus, any such changes are likely to require regression testing, which will cost the client a pretty penny. Therefore, any optimizations should be approached with good skepticism and, first of all, optimize those problems that give the greatest gain per unit of time.
Now let's try launching the same thing, but already limiting the channel width to fast3g and, attention, for the first time, set a fourfold slowdown of the processor (goodbye I7, hello celeron):
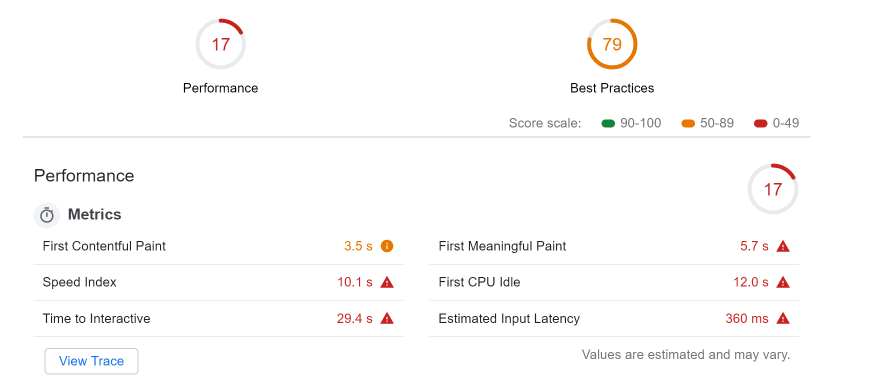
As you can see, things got worse (but FCP is still 3500 ms, FMP 5.7):
- Significantly increased image problems. LH again suggests using next-gen image formats, but now, in his opinion, this will save us as much as 11 conditional seconds.
- The problem with render-blocking resources has grown. And here two synchronous microscript adriver.js and advertise.js each surfaced 50 bytes each, which I have already mentioned.
- There was a suggestion to cut the CSS with a hint that only 5kb out of 45kb is used.
- The problem of too busy main thread first appeared. We cut the computing power and the browser just started to choke in JavaScript - (8.5 seconds for the script evaluation of which 2186 ms was spent on raven.js). Not weak, eh?
What conclusions can be drawn from here? Habr works well on fast internet and powerful machines. Shifting towards something cheaper can cause problems. Problems caused by:
- Large images
- Large DOM
- More javascript per page
A lot has been done so that these problems do not interfere with the rapid emergence of content, but for weak machines it is still relevant (for example, blocking raven.js).
Finally, let's go beyond the developer console, and try another well-known tool - webpagetest.org
It is remarkable to many - and detailed graphs, and tips, and settings. But what else he has is good - he allows you to choose a location from which you are supposedly watching the site. We all remember that Habr has become international. So let's see how Habr will be loaded, for example from Argentina. Of course, I would have access to the metrics, I would choose a more relevant location, and so - there will be Buenos Aires.
And for the purity of the experiment, use https://habr.com (without ru / en postfix).
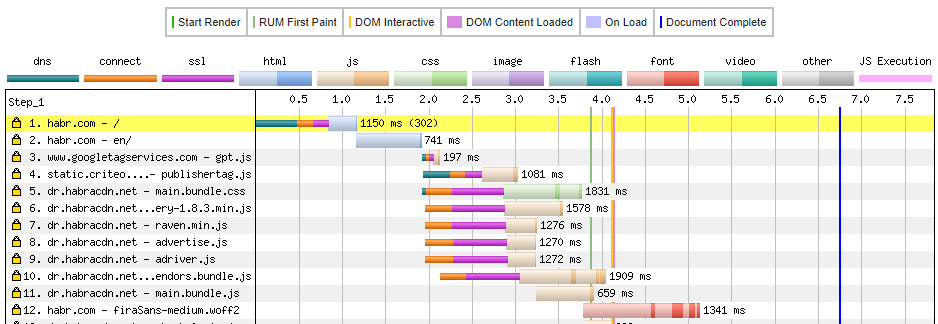
(partially shown, full version here )
Everything is very detailed here. You can see how much time (and to whom) it took to resolve DNS (500 ms for the main page), how much it took to establish a connection, ssl, and so on. It is immediately clear that we spent 1150 ms only on redirecting from the main page to the English version (reason to see why it takes so long). By the way, it has quite a lot of redirects (habrastorage suffers most of all).
You can also see the ill-fated main.bundle.css. It turns out that this is the first appeal to dr.habracdn.net, which leads to the need to perform dns lookup - 36 ms (by the way, I saw 400 ms each). Plus SSL negotiation 606 ms, plus TTFB 601 ms, plus another download. In general, not fast. But in spite of all this DCL - 4100 ms or so, which also pleases.
There is also a great tab image analysis, which shows how and how much you can save if you compress images. A photo of some red cat from a site in PNG weighs 1.4MB, and in webp + downscaling (yes, cheating, but still) - 17.7 KB. For comparison, the same photo in the same resolution, but still in png weighs 154kb. In general, only about this tool, you can write a separate article. But, in brief:
- We lost about two seconds on the initial loading of the page (and this despite the fact that later we loaded it in a few milliseconds, i.e. the channel was simply awesome).
- A large number of redirects. It eats time, it is necessary to deal with it.
- A long TTFB (webpagetest even put us F for this) - perhaps too high a load
- Really large downloads chart that allows you to assess how many requests Habr makes (and still the main content is given pretty quickly)
findings
And we will have no conclusions. There will be points for further study:
For server:
- Sometimes TTFB jumps up to 500 ms or more for static resources (this is without dns, ssl and initial connection)
- Redirection habrastorage
For client:
- Not optimal images
- Big size DOM-a
- Probably not optimal positions of blocking scripts.
At the same time, it is obvious that a good optimization work has been done. The site quickly loads the main text, the rest occurs after we see the content. Clearly, this is not a SPA, the server gives you content that is already ready to be shown, for which even JS is not needed - just to style and ready. But the less guys are great. There is still a wish to reduce the number of trackers / analytics / advertising, but this is more likely a dream a little comparable to the requirements of the business.
useful links
- Pro performance metrics
- Pro performance
- Deep profiling in Chrome
- Webpagetest
- How to use webpagetest
- How does render 1
- How does render 2
- About FCP
Ps. I apologize for the large number of anglicisms (especially for the layout) and for the longrid. But without them it’s very hard, and I’m already tired of all these parts 1, 2 and 3.
')
Source: https://habr.com/ru/post/454444/
All Articles