Recommendations in Okko: how to earn hundreds of millions by multiplying a couple of matrices

Do you know the situation when choosing a movie you spend a huge amount of time comparable to the time of the actual viewing? For users of online cinema is a common problem, and for the cinema itself - lost profits.
Fortunately, we have Rekko - a personal recommendation system that has been successfully helping Okko users for a year to choose films and TV shows from more than ten thousand pieces of content. In the article I will tell you how it works with algorithmic and technical points of view, how we approach its development and how we evaluate the results. Well, about the results of the annual A / B test, too, will tell.
First, a little history. Okko began its existence in 2011 as part of Yota, running under the name Yota Play.


Yota Play was a unique service for its time: it was closely integrated with social networks and used information about films viewed and rated by friends in many parts of the service, including recommendations.

In 2012, it was decided to supplement the social recommendations with algorithmic ones. This is how Oracle appeared - the first recommendation Okko online cinema system. Here are some excerpts from his design document:
A similar approach was used in the implemented system of personal recommendations. The scale of levels from “nothing” (void, absence) to “everything” (fully, maximally) is used. In the range [127 .. + 127] 0 - is the middle or “norm”. On this scale, the degree of sympathy for the protagonist and the subjective price of the product and the degree of “red” color are also estimated. For example, the size of the universe is estimated at +127 (on a scale of dimensions), and darkness on a scale - 127 (on a scale of light intensity).
When developing recommendations, it is important not only the background, but also the nature of a particular user. The personal profile also contains 4-re character types (according to K. Leongard - demonstrative, pedantic, stuck, excitable).
The physiological limits of the brain do not depend on the properties of a person’s character and on how friendly and sociable he is. According to the professor, restrictions exist in the neocortex, the department responsible for conscious thoughts and speech. This restriction is also taken into account in the implemented system, especially when developing recommendations for a pedantic type of character and when selecting a sample of such users among social connections.

As you already understood, the times were wild, the physiological limits of the brain were not limited to anything, and the overclocked neocortex itself could generate personal recommendations at the speed of light. Therefore, the model was decided to immediately roll in production.
As far as can be judged from the surviving artifacts of an ancient civilization, the Oracle was a wild mix of collaborative filtering algorithms, generously seasoned with business rules.

By the middle of 2013, everyone began to gradually let go and it was finally decided to check the quality of the recommendation machine. To this end, a specially trained editor filled out the main sections of the application and launched an A / B test: half of the users saw the output of the algorithm, half - the choice of editor.
It is now we are reading articles about the next victories of artificial intelligence and with horror imagine the day when he will deprive us of work. Then, in 2013, the situation was different: the man heroically defeated the car, creating even more jobs in the content department. The Oracle was turned off and never turned on again. Soon all the social chips disappeared, and Yota Play turned into Okko.

The period from 2013 to 2016 was marked by the “winter” of artificial intelligence and the totalitarian rule of the content department: personal recommendations in the service did not exist.
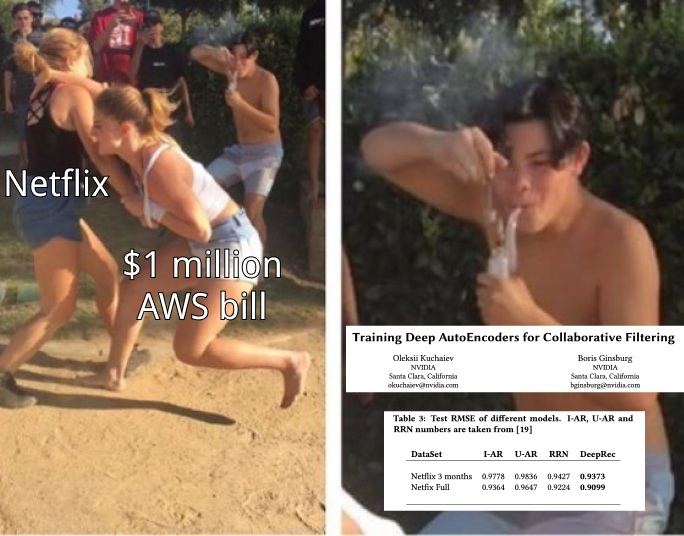
By mid-2017, it became clear that it was impossible to continue this way. Successes Netflix were at the hearing of everyone and the industry rapidly moving towards personalization. Users are no longer interested in “stupid” static services, they have already begun to get used to “smart” interfaces, which understand them perfectly well and foresee all their desires.
As the first iteration, they decided to integrate with two large Russian suppliers of recommendations. Once a day, both services took the necessary data from Okko, rustled their black boxes on distant servers and unloaded the results.
Based on the results of the semi-annual A / B test, no statistically significant differences were found in the control and test groups.

It was just at the end of this A / B test that I came to Okko, so that, together with the head of analytics, Mikhail Alekseev ( malekseev ), I began to make the service truly personal. Less than a year later, Danil Kazakov ( xaph ) joined us, finally forming the current team.
General considerations
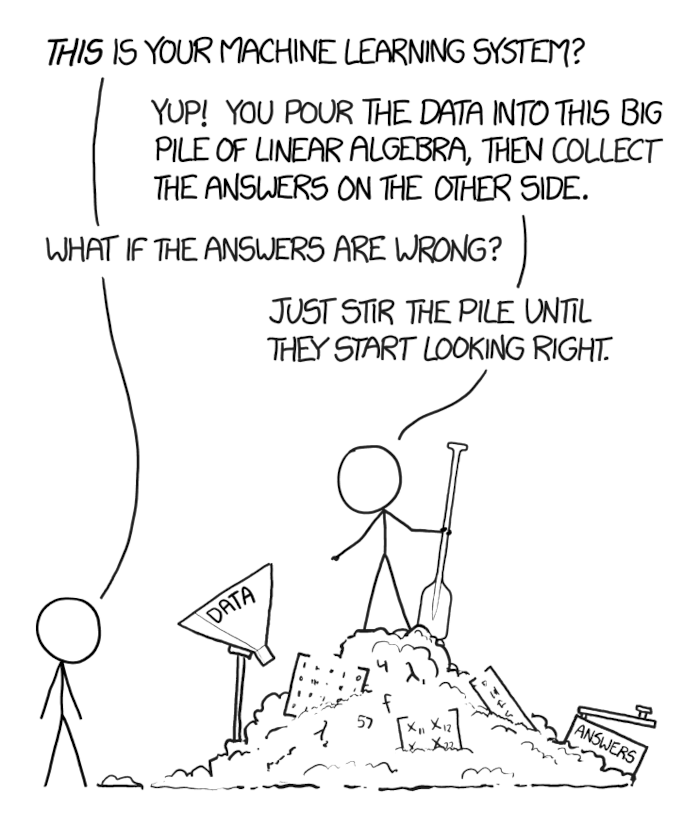
When you have a business problem long ago studied by the world community, which, moreover, needs to be solved quickly, there is a great temptation to take the first popular popular neural network solution, shove data into it with a shovel, ram it and throw it into a prod.
The main thing is the temptation to resist. The task of the scientific community - to achieve maximum speed on foul and synthetic datasets - often does not coincide with the task of business - to earn more money while spending less resources.
No, this does not mean that you do not need recurrent networks and you can collect billions using the method of k nearest neighbors. It may just happen that on your data the classical matrix decomposition will allow you to earn additional conditional 100 million per year, and recurrent networks - 105 million per year. At the same time, the maintenance of a server rack with video cards for these very networks will cost 10 million per year and will require several extra months to develop and implement, and simple integration of the already ready matrix decomposition into another section of the service and mailing will require a month of improvements and will give another 100 conditional millions in year.
Therefore, it is important to start with the basics - proven base methods - and move towards increasingly modern approaches, necessarily measuring and predicting what effect each new method will have on the business, how much it will cost and how much it will allow to earn.
Okko measure well. Literally, every new feature, every innovation we pass through the A / B test, is considered in the context of the most different groups of users, the effects are checked for statistical significance and only after that a decision is made to accept or reject the new functionality.

The current Rekko dashboard, for example, compares the control and test group for more than 50 metrics, including revenue, time spent in service, movie selection time, number of views by subscription, conversion to purchase and auto-renewal, and many others. And yes, we still keep a small group of users who have never received personal recommendations (sorry).

About recommender systems
For a start, a small introduction to the recommendation systems.
The task of the recommender system is for each user u inU by its history of interaction with elements i ini construct an order relation on the set of all elements. It means this: whatever two arbitrary elements we take, we can always tell which one is more preferable for the user, and which less.
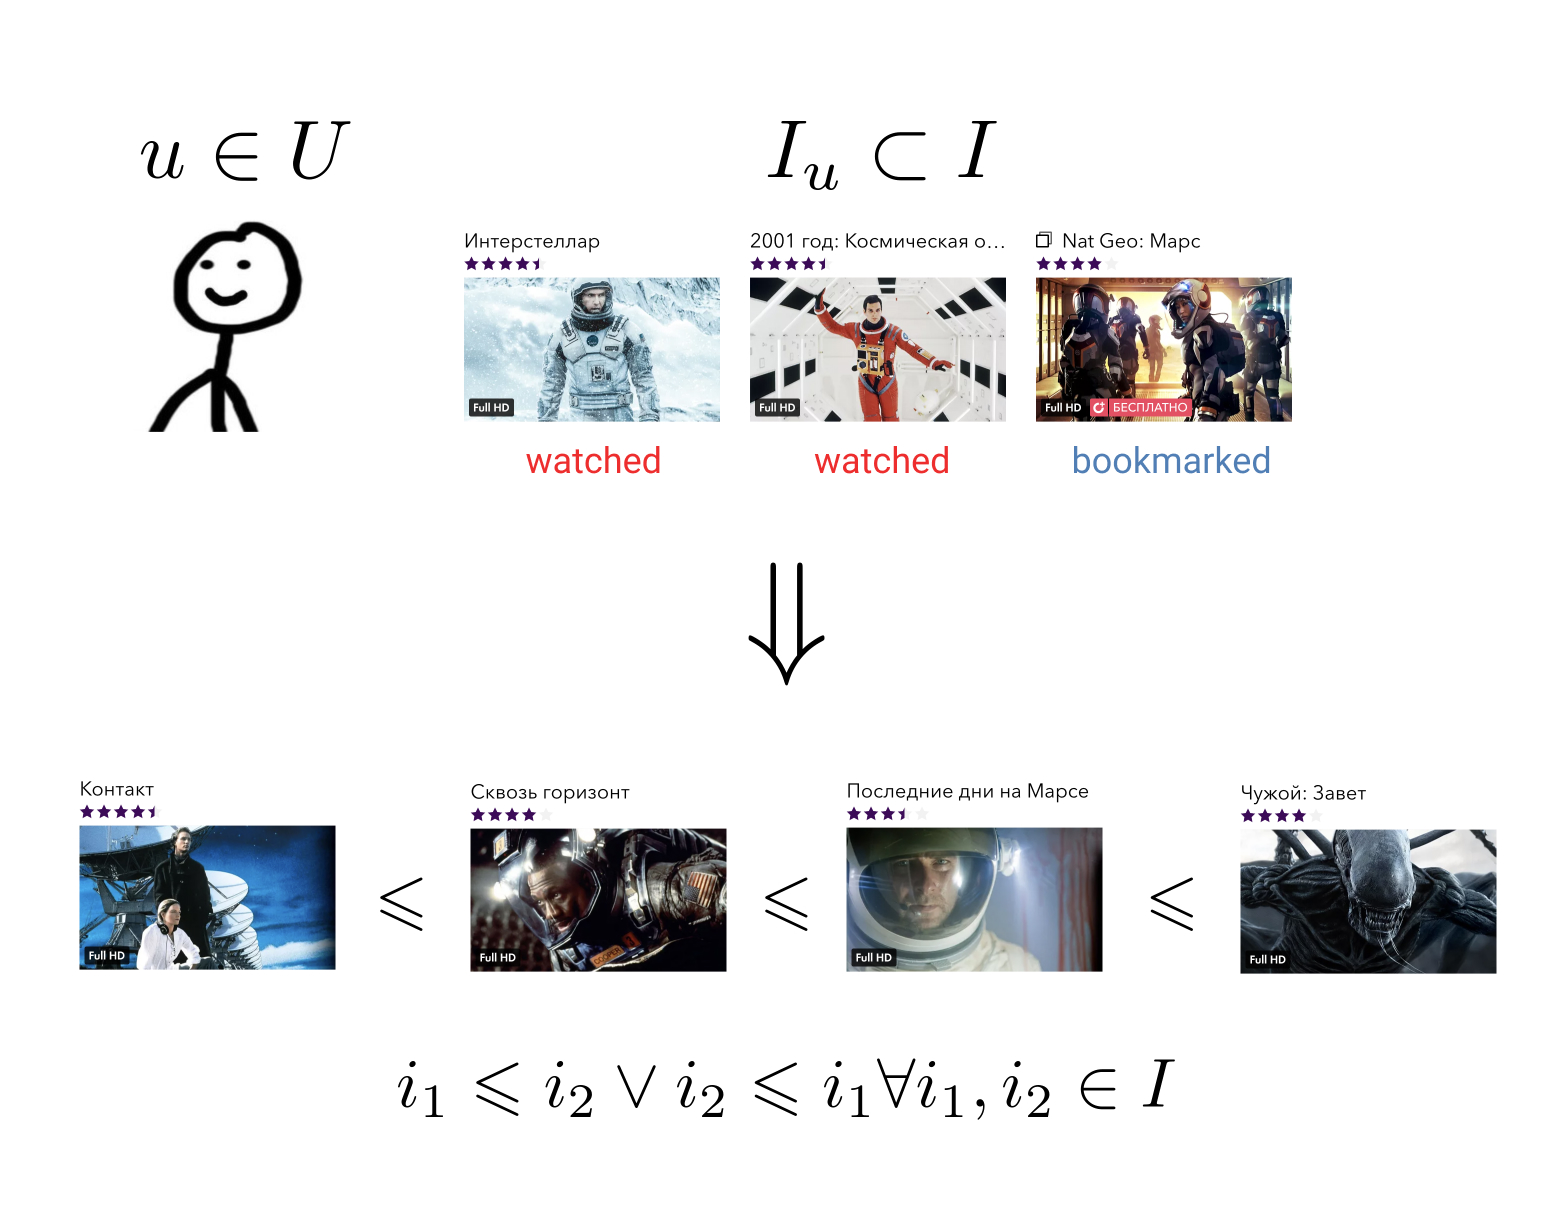
This fairly general task can be reduced to a simpler one: map the elements to a set on which an order relation is already given. For example, on the set of real numbers. In this case, it is necessary for each user and each element to be able to predict a certain value — how much a given user prefers this element.

Having an order relation on our elements, we are able to solve many business problems, for example, choose from all the N elements the most relevant to the user or sort the search results according to their preferences.
In the ideal case, we need a whole family of contextual relations of order. If a user enters the Militants collection, he will most likely prefer the movie “Destroyer” to the Oscar movie, but in the “Films with Sylvester Stallone” collection, the preference may well be reversed. Similar examples can be given for the day of the week, the time of day or the device from which the user entered the service.

Traditionally, all methods of building personal recommendations are divided into three large groups: collaborative filtering (CF), content models (CM) and hybrid models that combine the first two approaches.
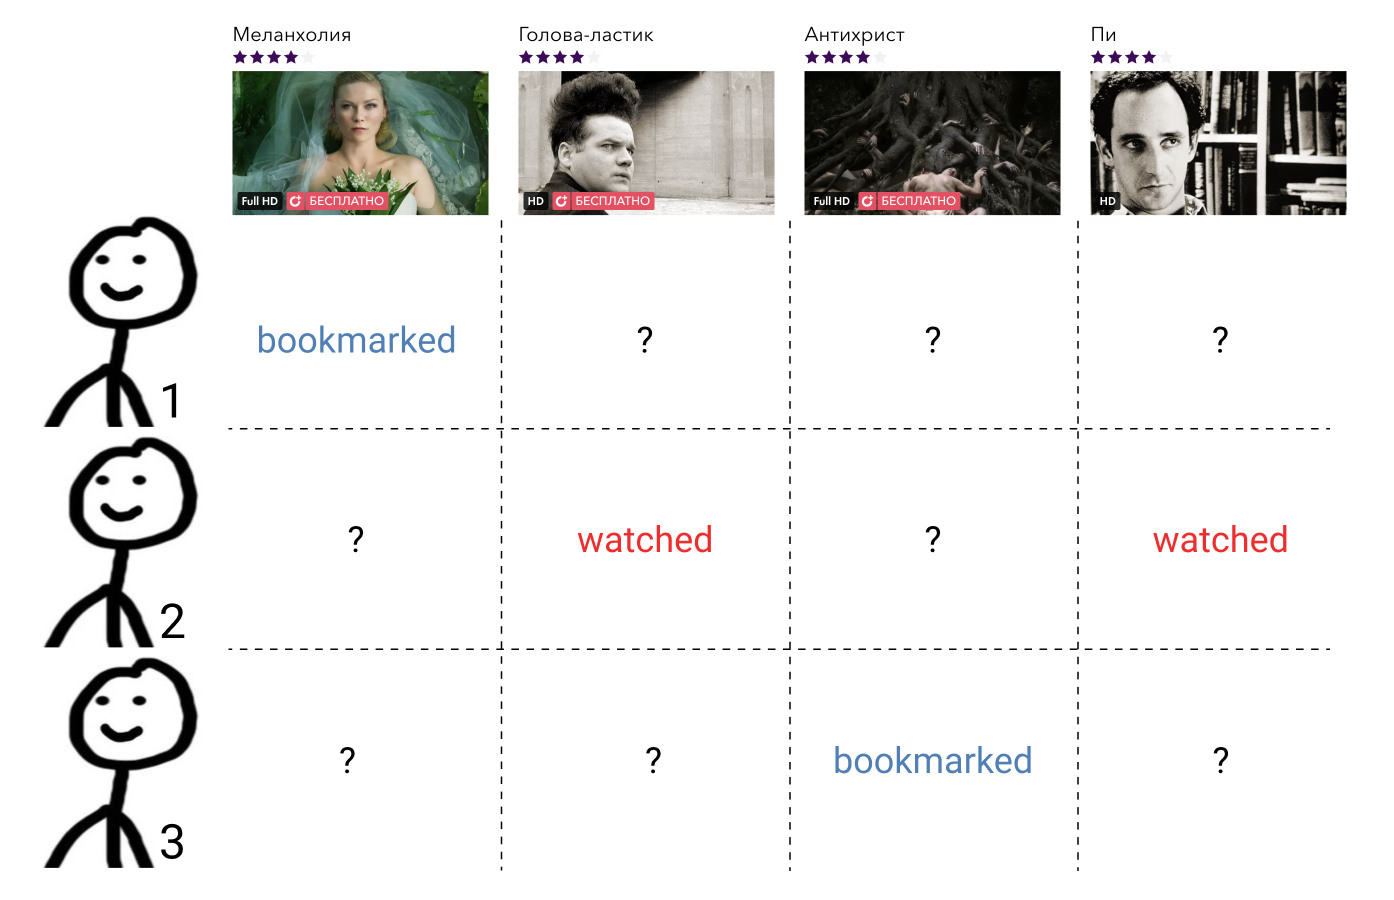
Collaborative filtering methods use information about the interactions of all users and all elements. Such information, as a rule, is represented as a sparse matrix, where the rows correspond to users, columns to elements, and the value characterizing the interaction between them or the gap, if this interaction was not, is on the user’s and element’s cross section. The task of building an order relationship here is reduced to the task of filling in the missing elements of the matrix.
These methods, as a rule, are easy to understand and implement, are fast, but do not show the best result.
Content models are arbitrary machine learning methods for solving classification or regression problems, parameterized by some set of parameters. theta . At the entrance, they take the user's characteristics and the attributes of the element, and the output is the degree of relevance of this element to this user. Such models are taught not on the interactions of all users and all elements, as methods of collaborative filtering, but only on separate precedents.

Such models, as a rule, are much more accurate than the methods of collaborative filtering, but they lose much in speed. Imagine if we have a function of some general form that accepts user and element attributes as input, then it must be called for each pair. (u,i),u inU,i inI . In the case of thousands of users and ten thousand items, this is already a million calls.
Hybrid models combine the merits of both approaches, offering quality recommendations in a reasonable time.
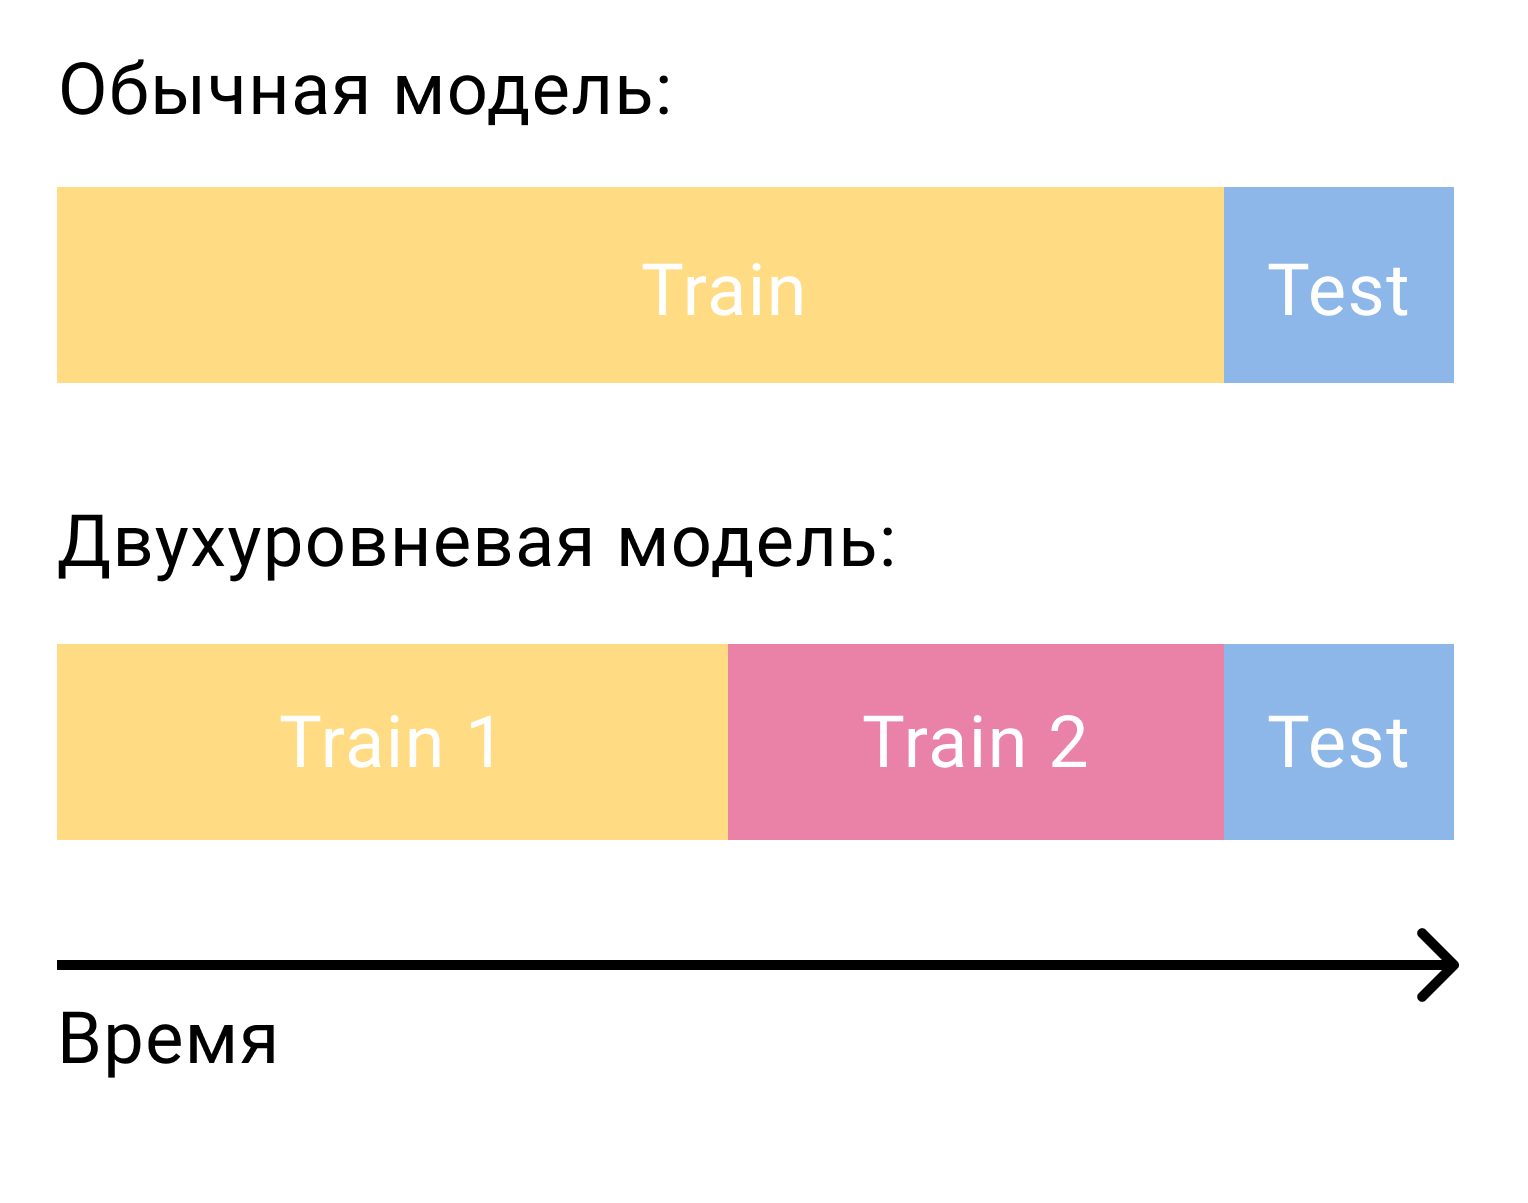
The most popular hybrid approach today is a two-tier architecture, where the collaborative filtering model selects a small number (100-1000) of candidates from all possible elements, which then ranks a much more powerful content model. Sometimes there may be several such stages of selection of candidates and an increasingly more complex model is used at each new level.

This architecture has many advantages:
- The collaborative and content parts are not interconnected and can be trained separately with different frequencies;
- Quality is always better than the collaborative model alone;
- The speed is much higher than the content model separately;
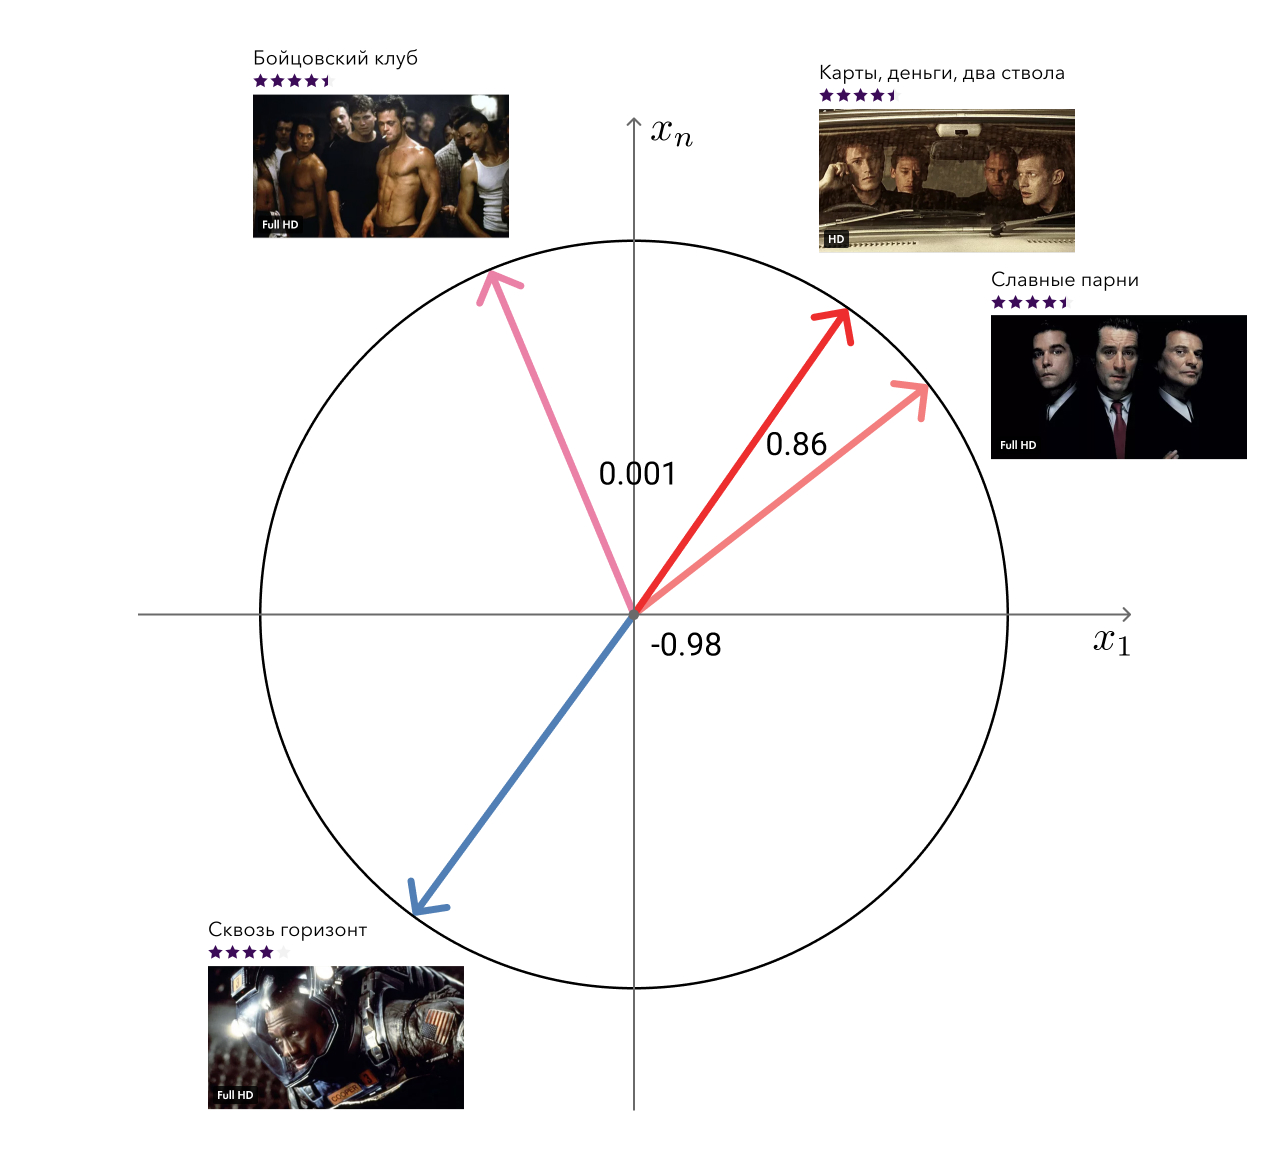
- "Free" we get a vector from the collaborative model, which can then be used to solve related problems.
If we talk about specific technologies, then there are a lot of possible combinations.
As a collaborative part, you can take user subscriptions, popular content, popular content among the user's friends, you can apply matrix or tensor factorization, train DSSM or any other method with a fairly quick prediction.
As a content model, you can use any approach at all, from linear regression to deep grids.
We in Okko are currently focused on a combination of matrix factorization with WARP loss and gradient boosting over trees, which I will discuss in detail now.
First stage: selection of candidates
I think it’s not a lie if I say that matrix factorization algorithms are by far the most popular methods of collaborative filtering. The essence of the method is clear from the name: we are trying to present the already mentioned matrix of user interactions with content with the product of two matrices of lower rank, one of which will be a “user matrix” and the other a “matrix of elements”. With this decomposition, we can restore the original matrix along with all the missing values.

In this case, of course, we are free to choose the criterion for the similarity of the existing and restored matrices. The simplest criterion is the standard deviation.
Let be pu - row of user matrix corresponding to user u inU , but qi - the column of the matrix of elements corresponding to the element i ini . Then when multiplying matrices their product langlepu,qi rangle will mean the value of the intended interaction between the user and the item. Considering now the standard deviation between this value and the a priori known value of the interaction rui for all pairs of interacting users and items (u,i) inT , we obtain a loss function that can be minimized.
min frac1 lvertT rvert sum(u,i) inT(rui− langlepu,qi rangle)2
As a rule, regularization is added to it.
min frac1 lvertT rvert sum(u,i) inT(rui− langlepu,qi rangle)2+ lambda( sumu lVertpu rVert2+ sumi lVertqi rVert2)
Such a task is not convex and NP-complex. However, it is easy to notice that when one of the matrices is fixed, the problem turns into a linear regression with respect to the second matrix, which means we can search for a solution iteratively, alternately freezing either the user matrix or the matrix of elements. This approach is called Alternating Least Squares (ALS).

The main advantage of ALS is the speed and possibility of easy parallelization. For this, they love him so much in Yandex.Dzene and Vkontakte, where both users and elements number in the tens of millions.
However, if we are talking about the amount of data that fits on one machine, ALS does not hold water. His main problem is that he optimizes the wrong loss function. Recall the formulation of the task of constructing a recommendation system. We want to get an order relation on the set, but instead optimize the standard deviation.
It is easy to give an example of a matrix for which the standard deviation will be minimal, but the order of the elements is hopelessly destroyed.
Let's see what we can do about it. In the user's head, all the elements with which he interacted are arranged in a certain order. For example, he knows for sure that Interstellar is better than "Attraction", "Attraction" and "Alien" are equally good films, and they are all slightly worse than "Terminator". In this case, the films that the user has not yet watched, he also has some attitude, and to all the same. He may consider that such films are a priori worse than those films that he watched. Or he may consider that, for example, Prometheus is a bad film, and any film that he has not watched will be better than him.
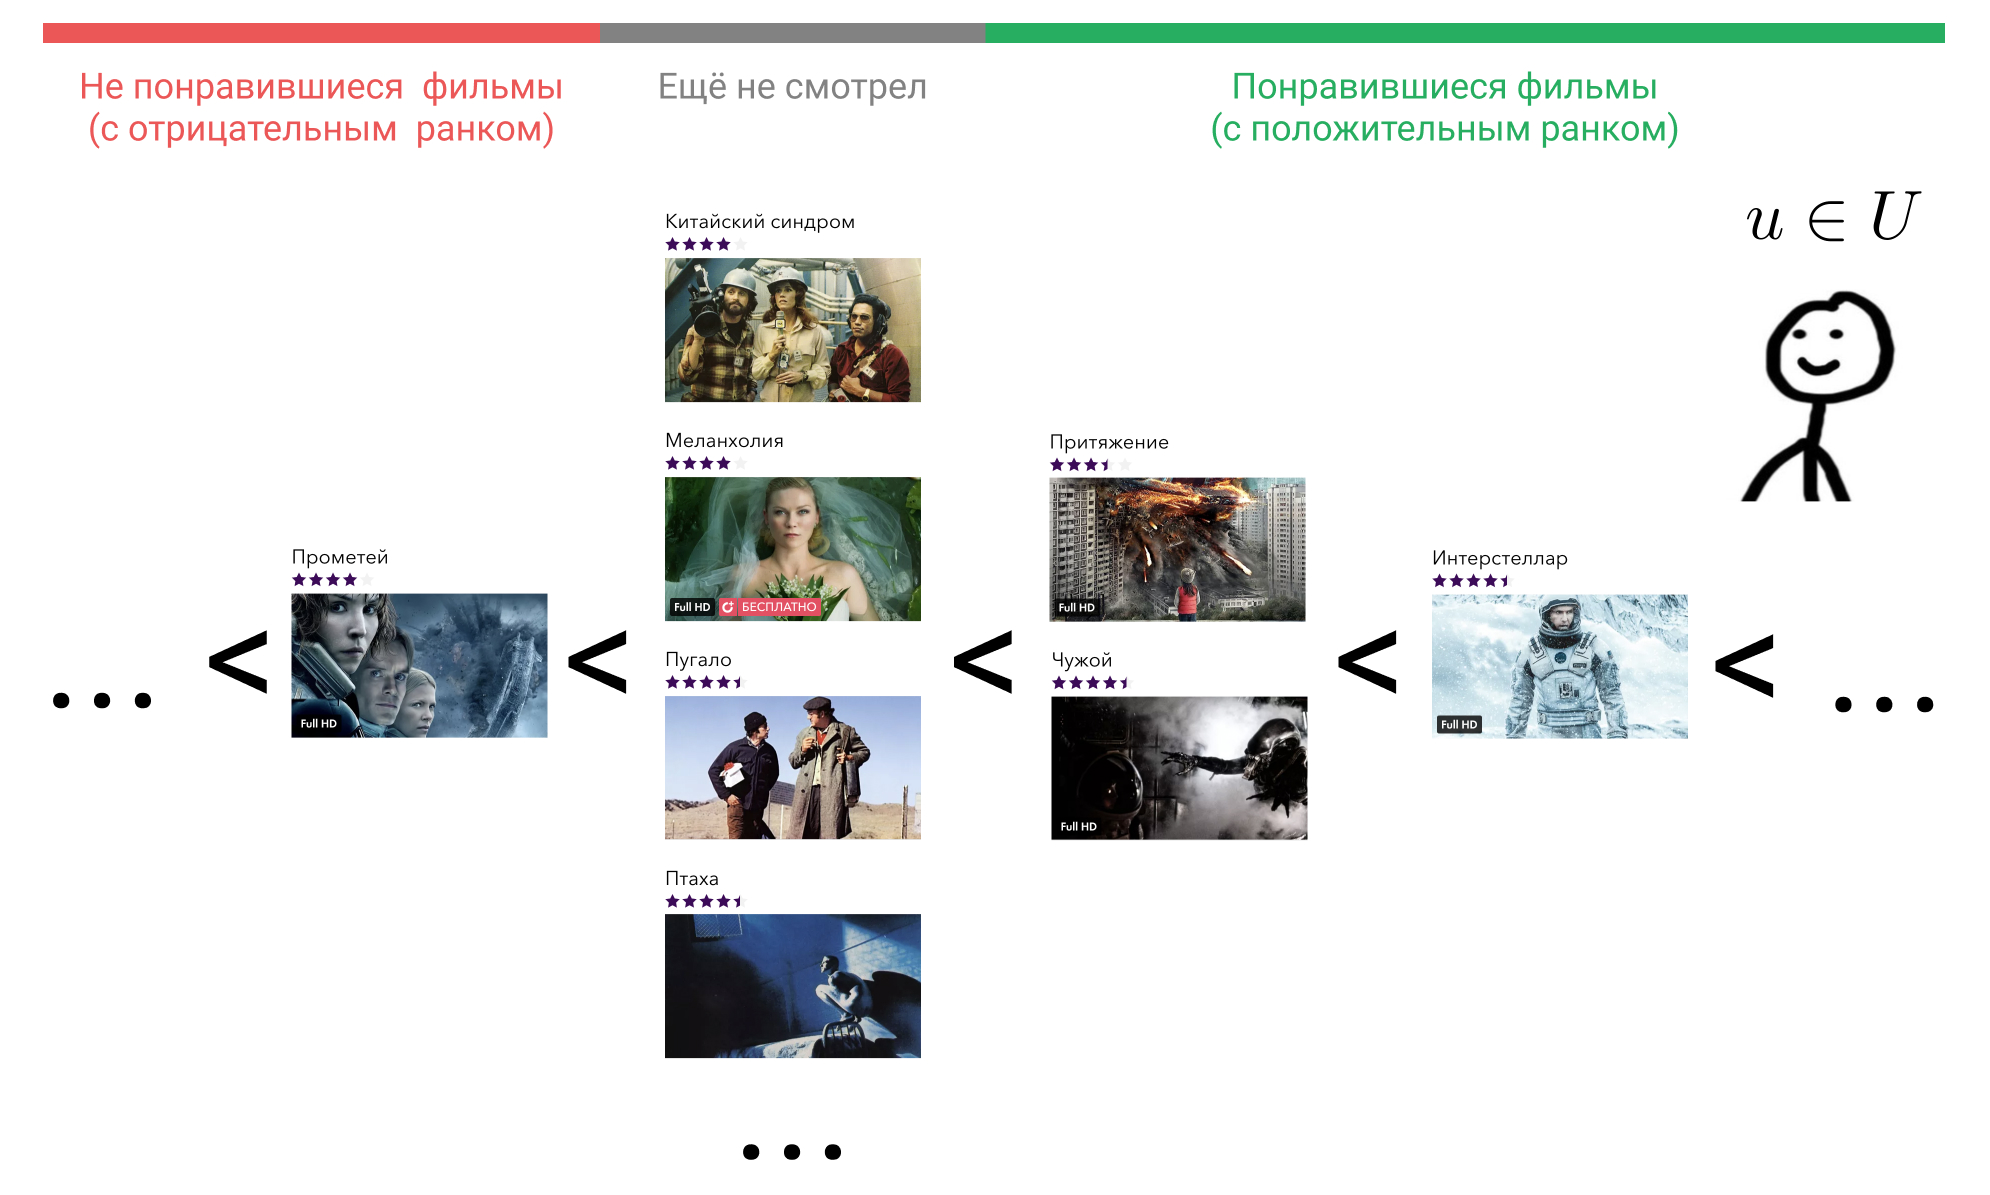
Imagine that according to some signs of user behavior in the service, we are able to restore this order, displaying the element with which it interacted, into an integer using the function rho:U timesI to mathbbZ . The set of all the films with which the user u interacted, denoted by Iu . We agree that rho(u,j)=0 if the user did not interact with the movie j , i.e j notinIu . Thus, if the user finds the movie bad, then rho(u,i)<0 and if good, then rho(u,i)>0 .

Now we can enter a rank rank:U timesI to mathbbN .
rank(u,i)= sumj inI: rho(u,j)< rho(u,i) textrmI( langlepu,qi rangle<1+ langlepu,qj rangle)
textrmI(x) here denotes the indicator function and is equal to one if x true and zero otherwise.
Let's stop for a minute and think about what this rank means.
Fix user u , it is - a particular user, which one - we are not interested. Accordingly, its vector pu will be fixed.
Take now any movie that he watched, such as Interstellar. In the formula it is i . Next, find a movie that the user thinks is worse than Interstellar. We can choose from "Attraction", "Alien", "Prometheus", or any film that he has not watched.

Take the "Attraction." In the formula it is j . Now let's check if we take the Interstellar vector. qi and multiply by user vector, will the result be greater than the result of multiplication of the vector "Attraction" qj on the same user vector. For reliability, we take into account the gap in the unit. Now we will do this for “Alien”, for “Prometheus” and for all films that the user has not yet watched and sum up.
We get the number of films that our matrix expansion model mistakenly puts higher than Interstellar. In the perfect model r(u,i) will be equal to zero for each user and each element with which he interacted.
Now it is easy enough to record the general error of the model.
L= sumu inU,i inIu phi(rank(u,i))
phi: mathbbN to mathbbR - some function that translates the natural rank into a real number. Its choice depends on which part of the list of elements we want to optimize. The function described below can be a good choice, but in real calculations for the sake of speed, it can be approximated by logarithm.
phi(x)= sumxi=1 frac1i
With the loss function sorted out. How to put all this into practice now? You can, of course, optimize the above function directly using a gradient descent, but honest calculation of the wound for all elements and all users will take a huge amount of time, because we will need to perform summation over all available elements.
Here a small trick will help us: instead of an honest wound, we will consider its approximation. For this from the elements j such that p(u,j)<p(u,i) we will choose random and check whether the relationship is not violated langlepu,qi rangle<1+ langlepu,qj rangle . If the relationship is not broken N−1 once and broken on the move N then we take as an element wound i
rank(u,i) approx lfloor frac lvertI rvert−1N rfloor
Where lvertI rvert - the total number of elements.
Having a rank of an example that violates the order relation, we can easily make a step of gradient descent to the side, correcting this misunderstanding.
This loss function is called WARP and was first described in the WSABIE: Scaling Up To Large Vocabulary Image Annotation article. We modified it by adding arbitrary integer wounds and the notion of a neutral wound for elements with which the user did not interact. On our task, this gave an increase in metrics of about 10%.
The question of choice remains open. rho(u,i) . In Okko, the user can interact with the content as follows:
- Buy forever;
- To rent;
- View by subscription (or free);
- Add to bookmarks;
- Rating from 0 to 10.
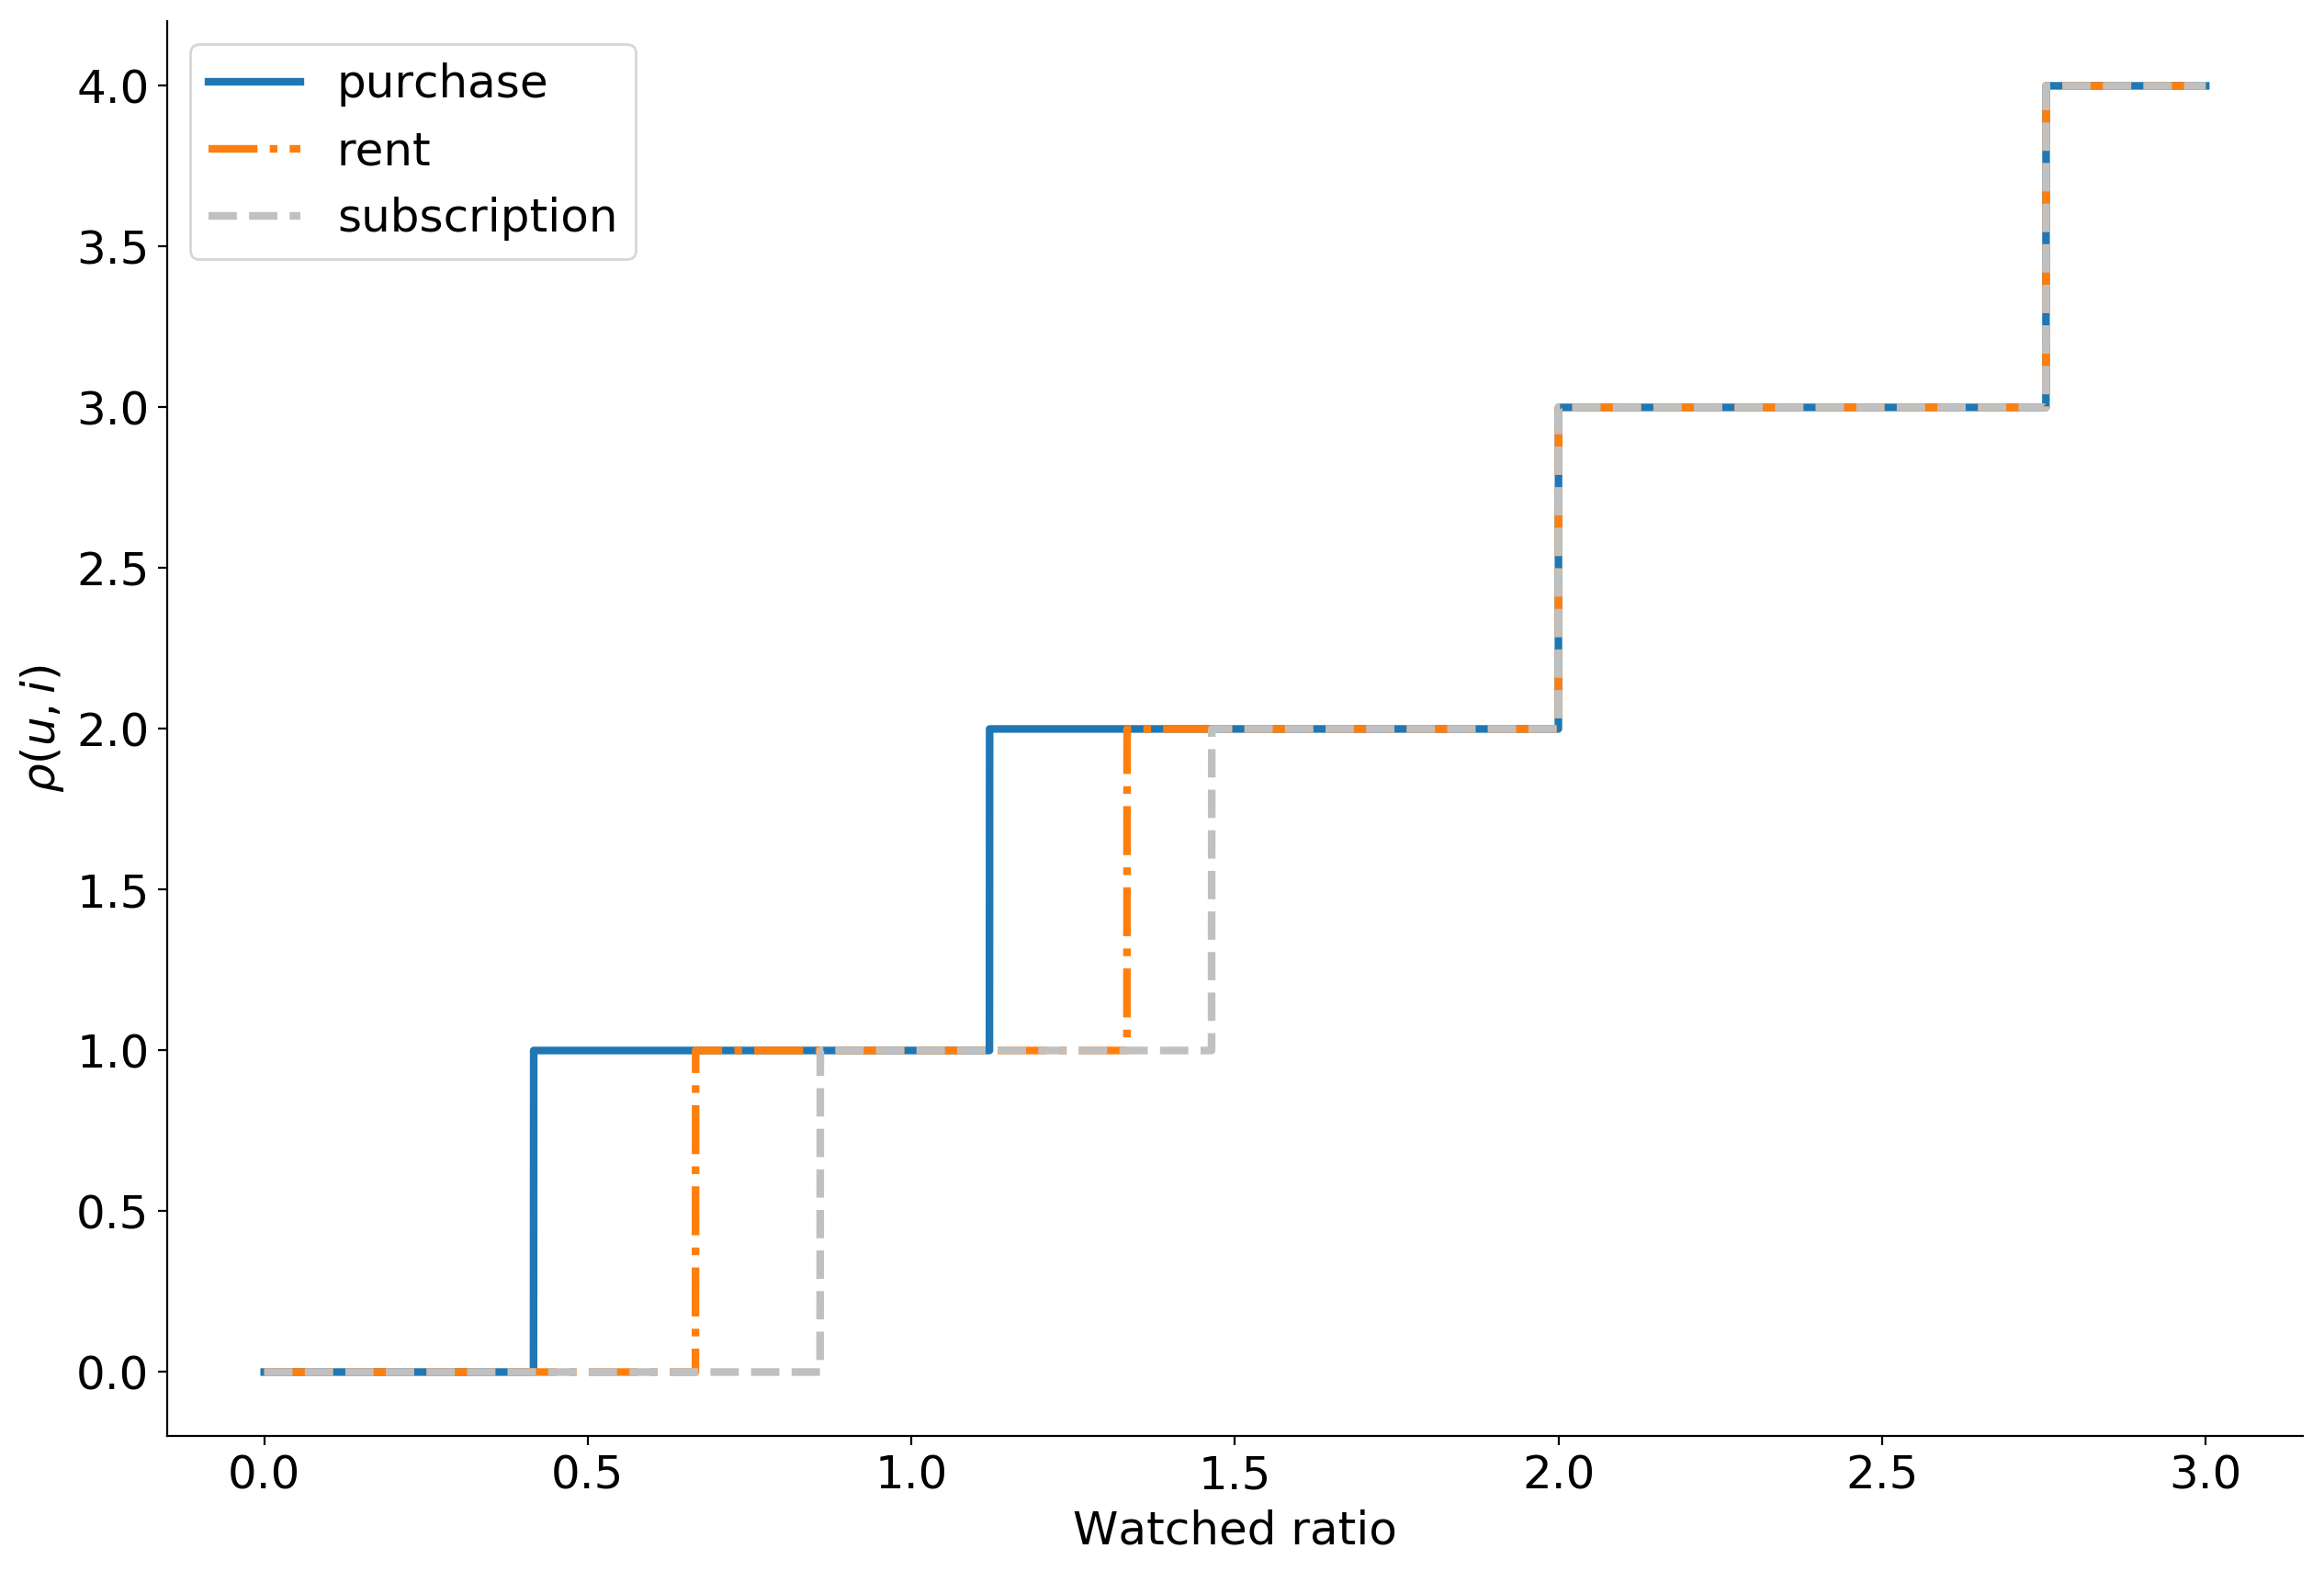
We consider the purchase the most valuable action, since it requires the user to invest not only time but also money. If the user is willing to spend 399 rubles on a new product, most likely he appreciates it. , . -, .
— . , explicit : , . , , implicit .
, ρ(u,i) , . . , .
ρ(u,i)=−c , ρ(u,i)=c , .
:

, top-N : . , Approximate nearest neighbor algorithm based on navigable small world graphs .
, , , , . , - , . : , .
. , , . — , , . , , , . 100 400 .

, , : , . 50 .
, :
- ,
- , ,
- ,
- . .
-: , , , , , . . -: , , , , . .
, , , .
, , , , . , — . — .
. , . , . positives, negatives. .

? -, , — . -, — , , .
What's next? — . , , — , , .
XGBoost LightGBM LambdaMART. , . If a f(xi) — xi , , i j ,
Pij=P(i>j)=11+exp(f(xj)−f(xi)).
.
L=−YijlogPij−(1−Yij)log(1−Pij)
Yij — . 1 i>j , 0 i<g 0.5 i=j .
50% . 10%.
:
, «» , ? , — — .
: . . — - .

. Rekko : lynch, rekko-tasks rekko-service.
Lynch , , S3.
rekko-tasks rekko-service Okko . S3 , . , .

Python falcon, gunicorn gevent -. Okko, .
Lynch .
, ? :
- , ;
- ;
- ;
- ;
- ;
- -;
- .
, :
data = extract_data() data = transform_data(data) mf_model = train_mf_model(data) candidates = build_candidates(mf_model) predictions = build_predictions(content_model, candidates) upload_predictions(predictions) All right, great job, disagree? Not really. And what if the whole sheet falls somewhere? Well, for example, due to lack of memory. We will have to restart everything again, even if we have already spent a couple of hours to train the model and build the candidates.
Well, let's save all intermediate results to files, and after dropping to check which of them already exist, restore the state and start the calculations from the right moment. In fact, this idea is even worse than the previous one. The program can be interrupted in the middle of writing to a file and, although it will exist, it will be in the wrong state. At best, the entire calculation will fall, at worst, it will end with the wrong result.
Ok, let's write an atomic file. And we will generally take out each function into a separate entity and indicate the dependencies between them. It turns out a chain of calculations, each element of which can be either completed or not.

Already not bad. But in reality, all necessary calculations will hardly be described by a list. Matrix factorization training will require not only transaction data, but also user evaluations, building candidates will require a list of stored films to exclude them, calculating similar films will require trained matrix factorization and meta-information from the catalog, and so on. Our tasks are no longer lined up in a single-linked list, but in a directed graph without cycles (Directed Acyclic Graph, DAG).

DAG is a very popular structure for organizing computations. There are two main frameworks for building a DAG: Airflow and Luigi . We in Okko stopped at last. Luigi was developed in Spotify, actively developed, written entirely in python, easily expanded and allows very flexible organization of calculations.
A task in Luigi is defined by a class that inherits from luigi.Task and implements three mandatory methods: requires , output and run . This is a typical task:
# RekkoTask luigi.Task class DoSomething(RekkoTask): # date: datetime.datetime = luigi.DateSecondParameter() # resources = { 'cores': 4, 'aws': 1, 'memory': 8 } # Namespace task_namespace = 'Transform' def requires(self): # , return { 'data': DownloadData(date=self.date), 'element_mapping': MakeElementMapping(date=self.date) } def output(self): # # , s3 return luigi.LocalTarget( os.path.join(self.data_root, f'some_output_{self.date}.msg'), format=luigi.format.Nop ) def run(self): # , # with self.input()['data'].open('r') as f: data = pd.read_csv(f) with self.input()['element_mapping'].open('r') as f: element_mapping = json.load(f) # result = ... # Splunk self.log( n_results=len(result) ) # with self.output().open('w') as f: result.to_msgpack(f) Luigi will make sure that the tasks are completed in the right order without exceeding the consumption of available resources. If tasks can run in parallel, it will run them in parallel, maximizing CPU utilization and minimizing total execution time. If a task completes with an error, it will restart it a number of times and, in case of failure, will inform us. In this case, all tasks that can be performed will be completed. This means, for example, that an error in the task of ranking candidates does not hurt to count and upload a list of similar films.
Currently Lynch consists of 47 unique tasks, producing about 100 of its copies. Some of them are occupied by direct work, and some by counting metrics and sending them to our BI tool Splunk. Basic statistics and reports on their work Lynch also periodically sends us telegrams. He also writes about errors, but already in PM.

Monitoring, Splits and Results

The first rule of Data Science: Do not tell anyone about the salaries in Data Science. The second rule of Data Science: that which cannot be measured cannot be improved.
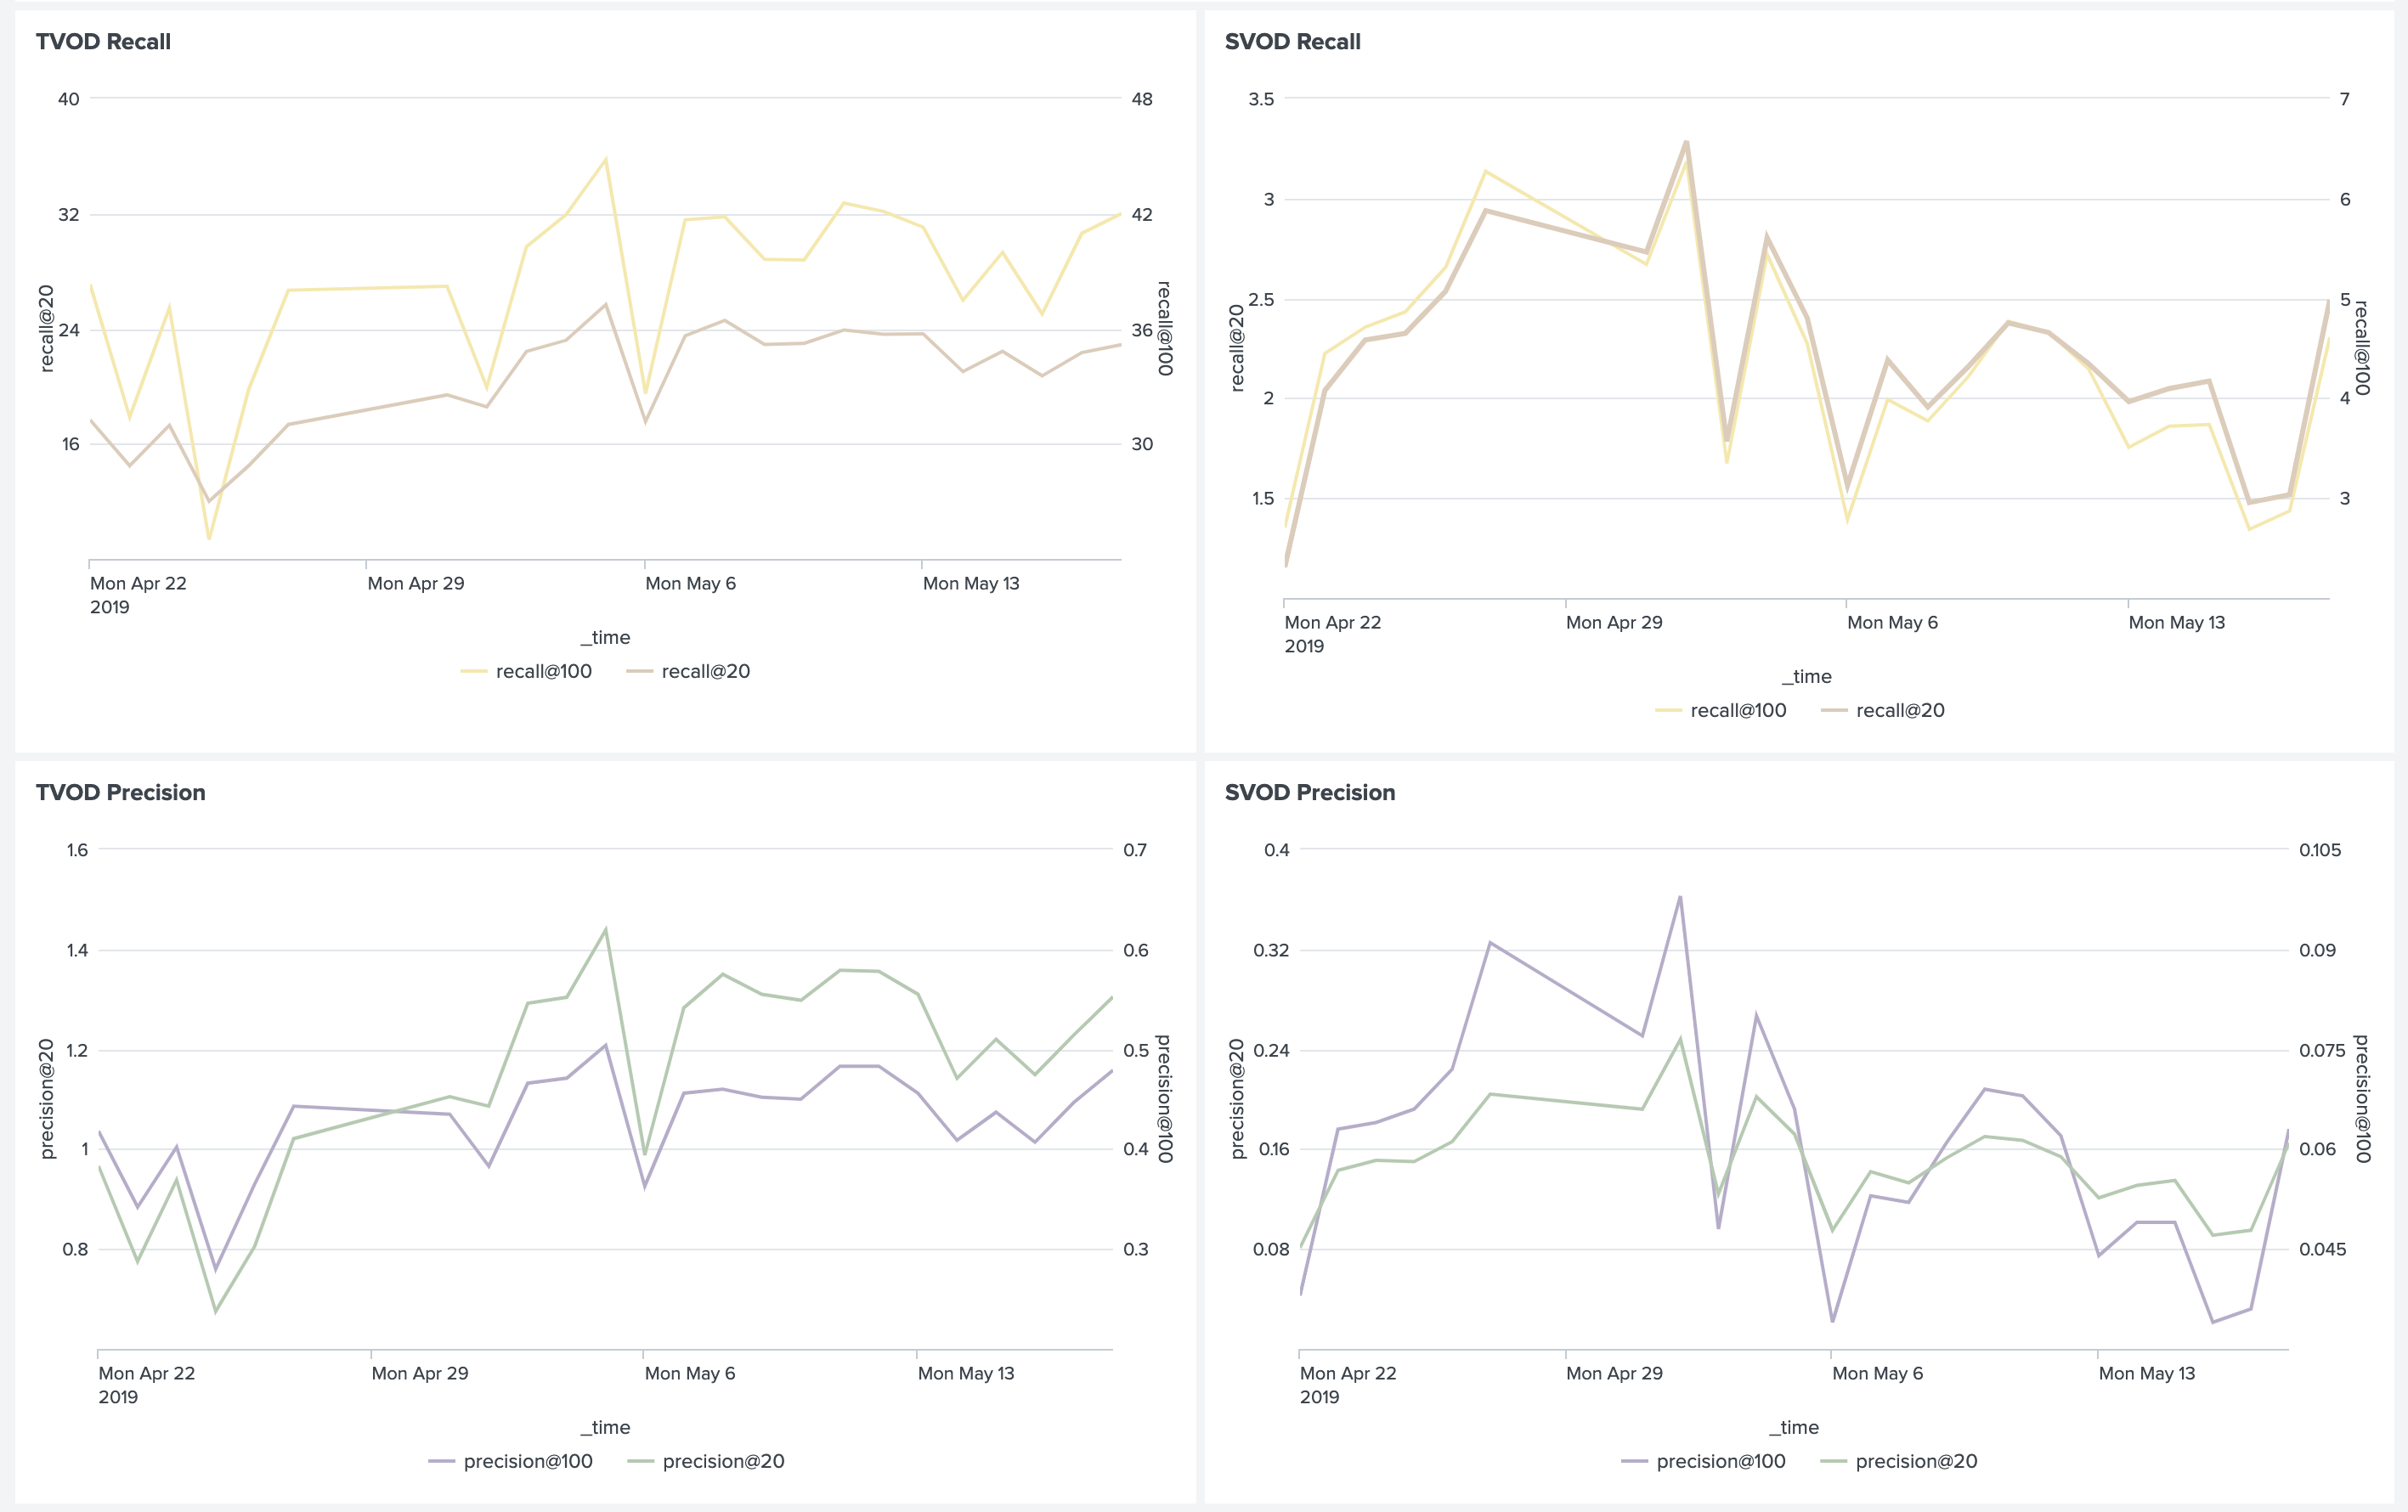
We try to follow everything. First of all, these are, of course, ranking metrics based on historical data. At the research stage, they help to choose the best model from several and choose hyper parameters for it.
For models working in production, we also consider metrics, but already daily. Such metrics are quite volatile, but it will be possible to tell from them if the model suddenly degrades for some reason. When outputting a new model, you can leave it idle for a week and make sure that the metrics do not subside. After that, you can enable it for a part of users, run the A / B test and monitor business metrics.
In addition, we consider the distribution of recommendations by genre, country, year, type, etc. This allows us to understand the current nature of user preferences, compare it with actual data viewing, and catch errors in business rules.
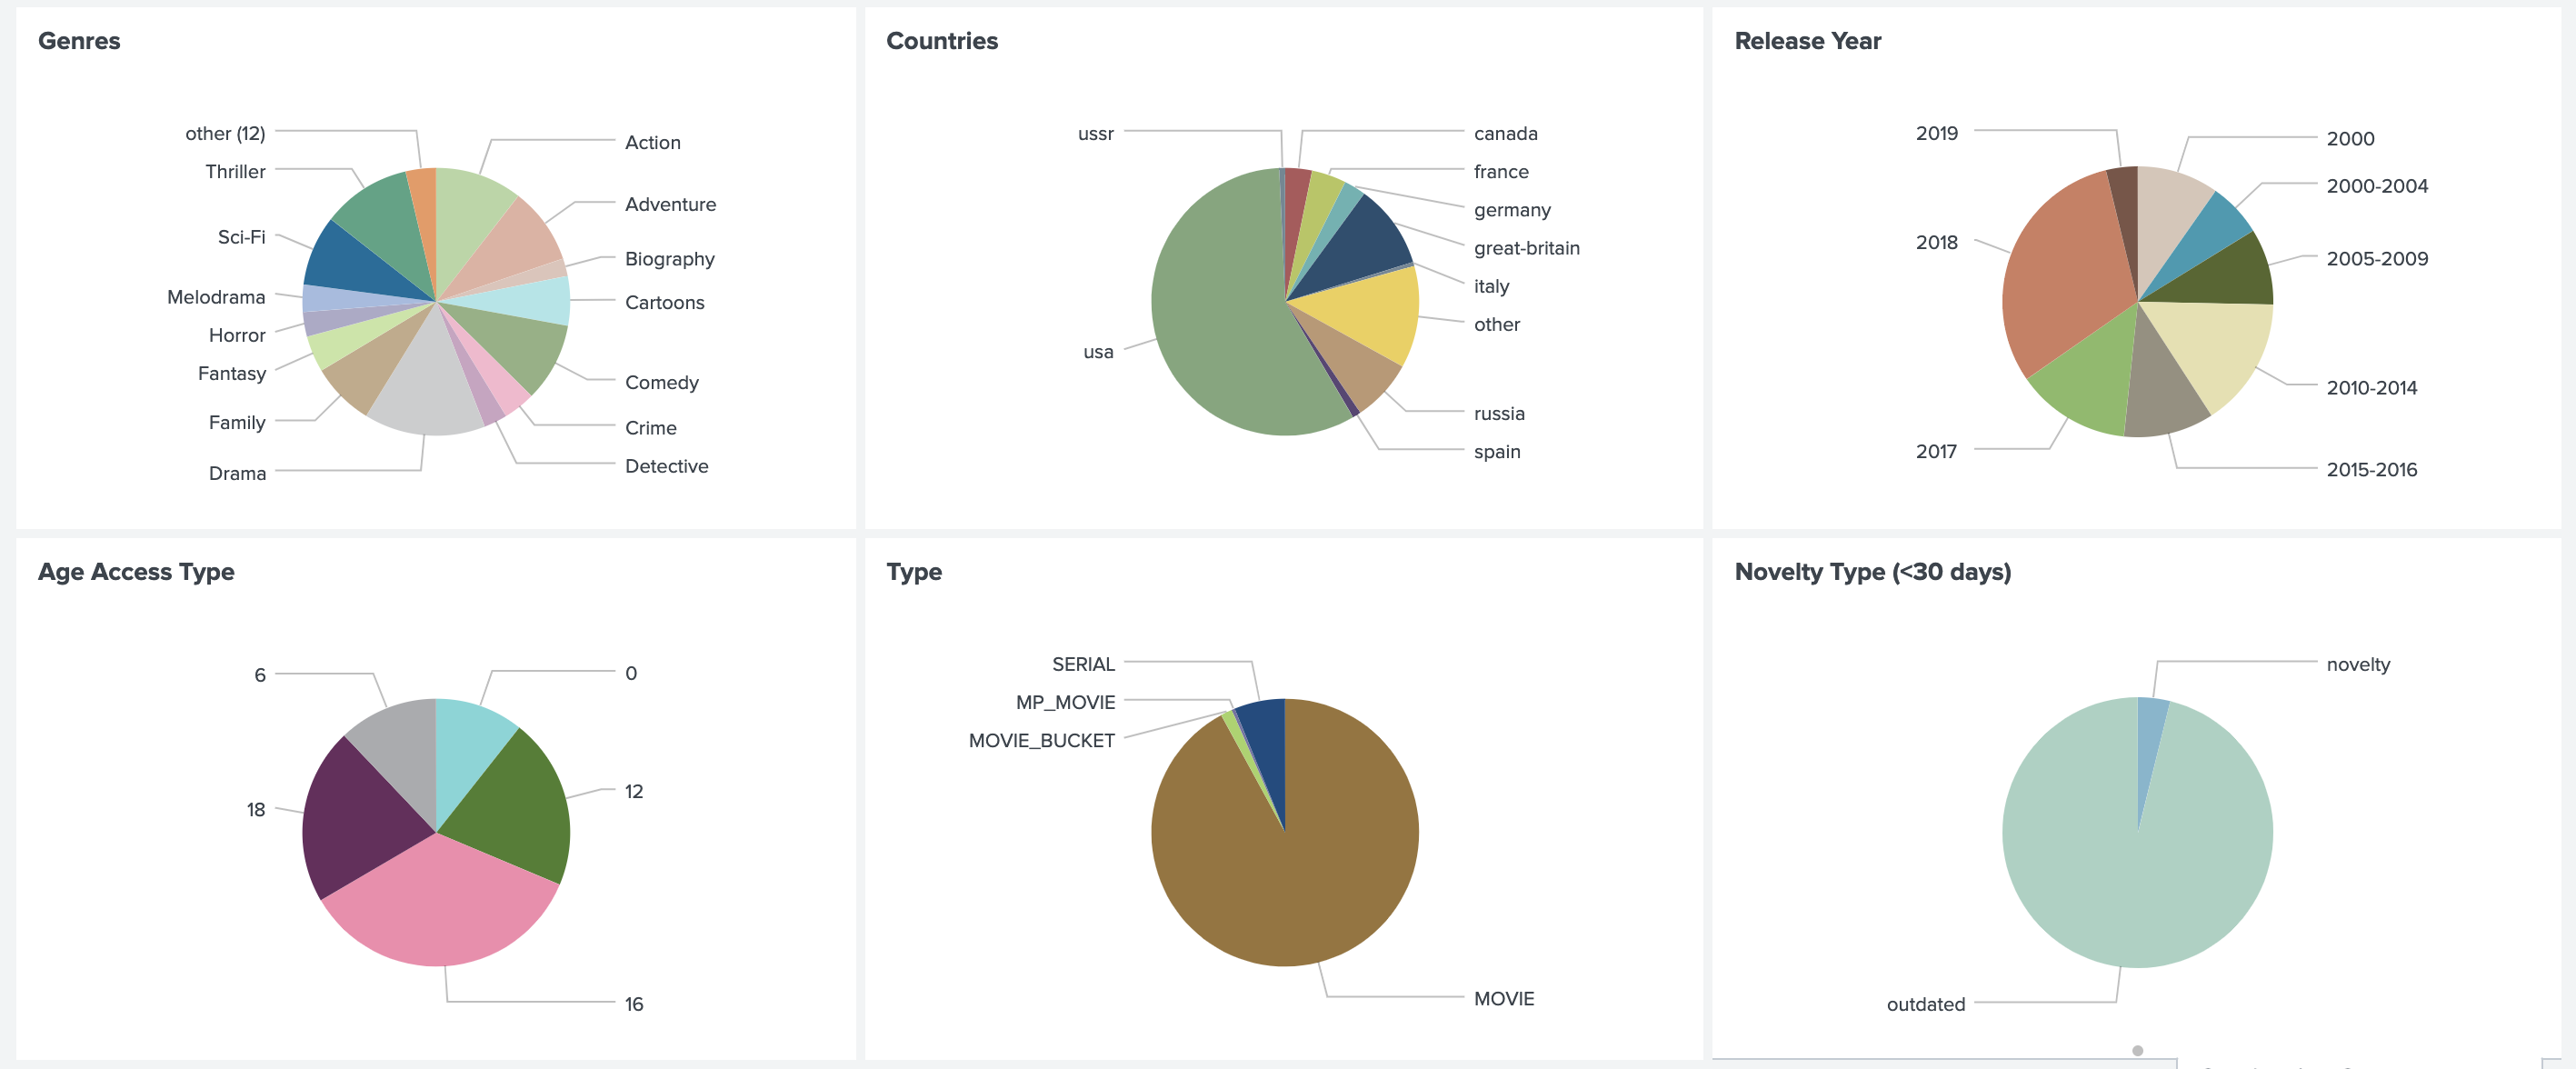
It is also very important to monitor the distribution of all used signs. A sharp change in them can be caused by an error in the data source and lead to unpredictable results.
But, of course, the most important thing that requires close attention is business metrics. As part of the recommendation system, the main business metrics for us are:
- Revenue from transactional and subscription consumption patterns (TVOD / SVOD revenue);
- Average revenue per visitor (ARPV);
- Average bill (average price per purchase, APPP);
- Average number of purchases per user (average purchases per user, APPU);
- Conversion to purchase (CR to purchase);
- Conversion to view by subscription (CR to watch);
- Conversion during the trial period (CR to trial).
At the same time, we look separately at the metrics from the “Recommendations” and “Similar” sections and the metrics of the entire service in order to take into account the effect of redistribution and to consider the situation from different angles.
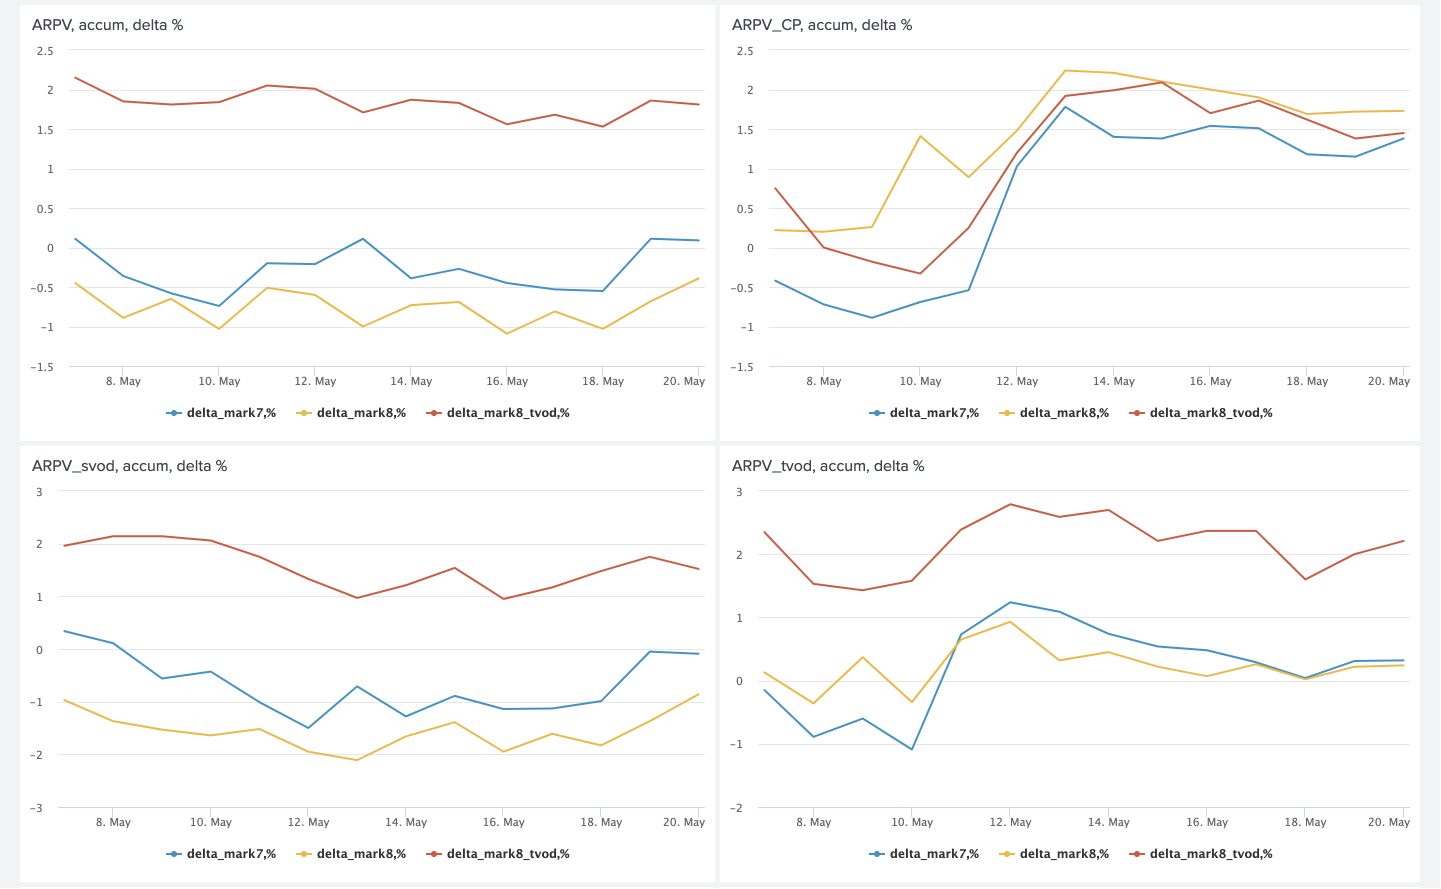
This is how dashboards can compare several models:

In addition to the instantaneous values of metrics, it is also useful to look at the deltas and accumulative deltas between them.
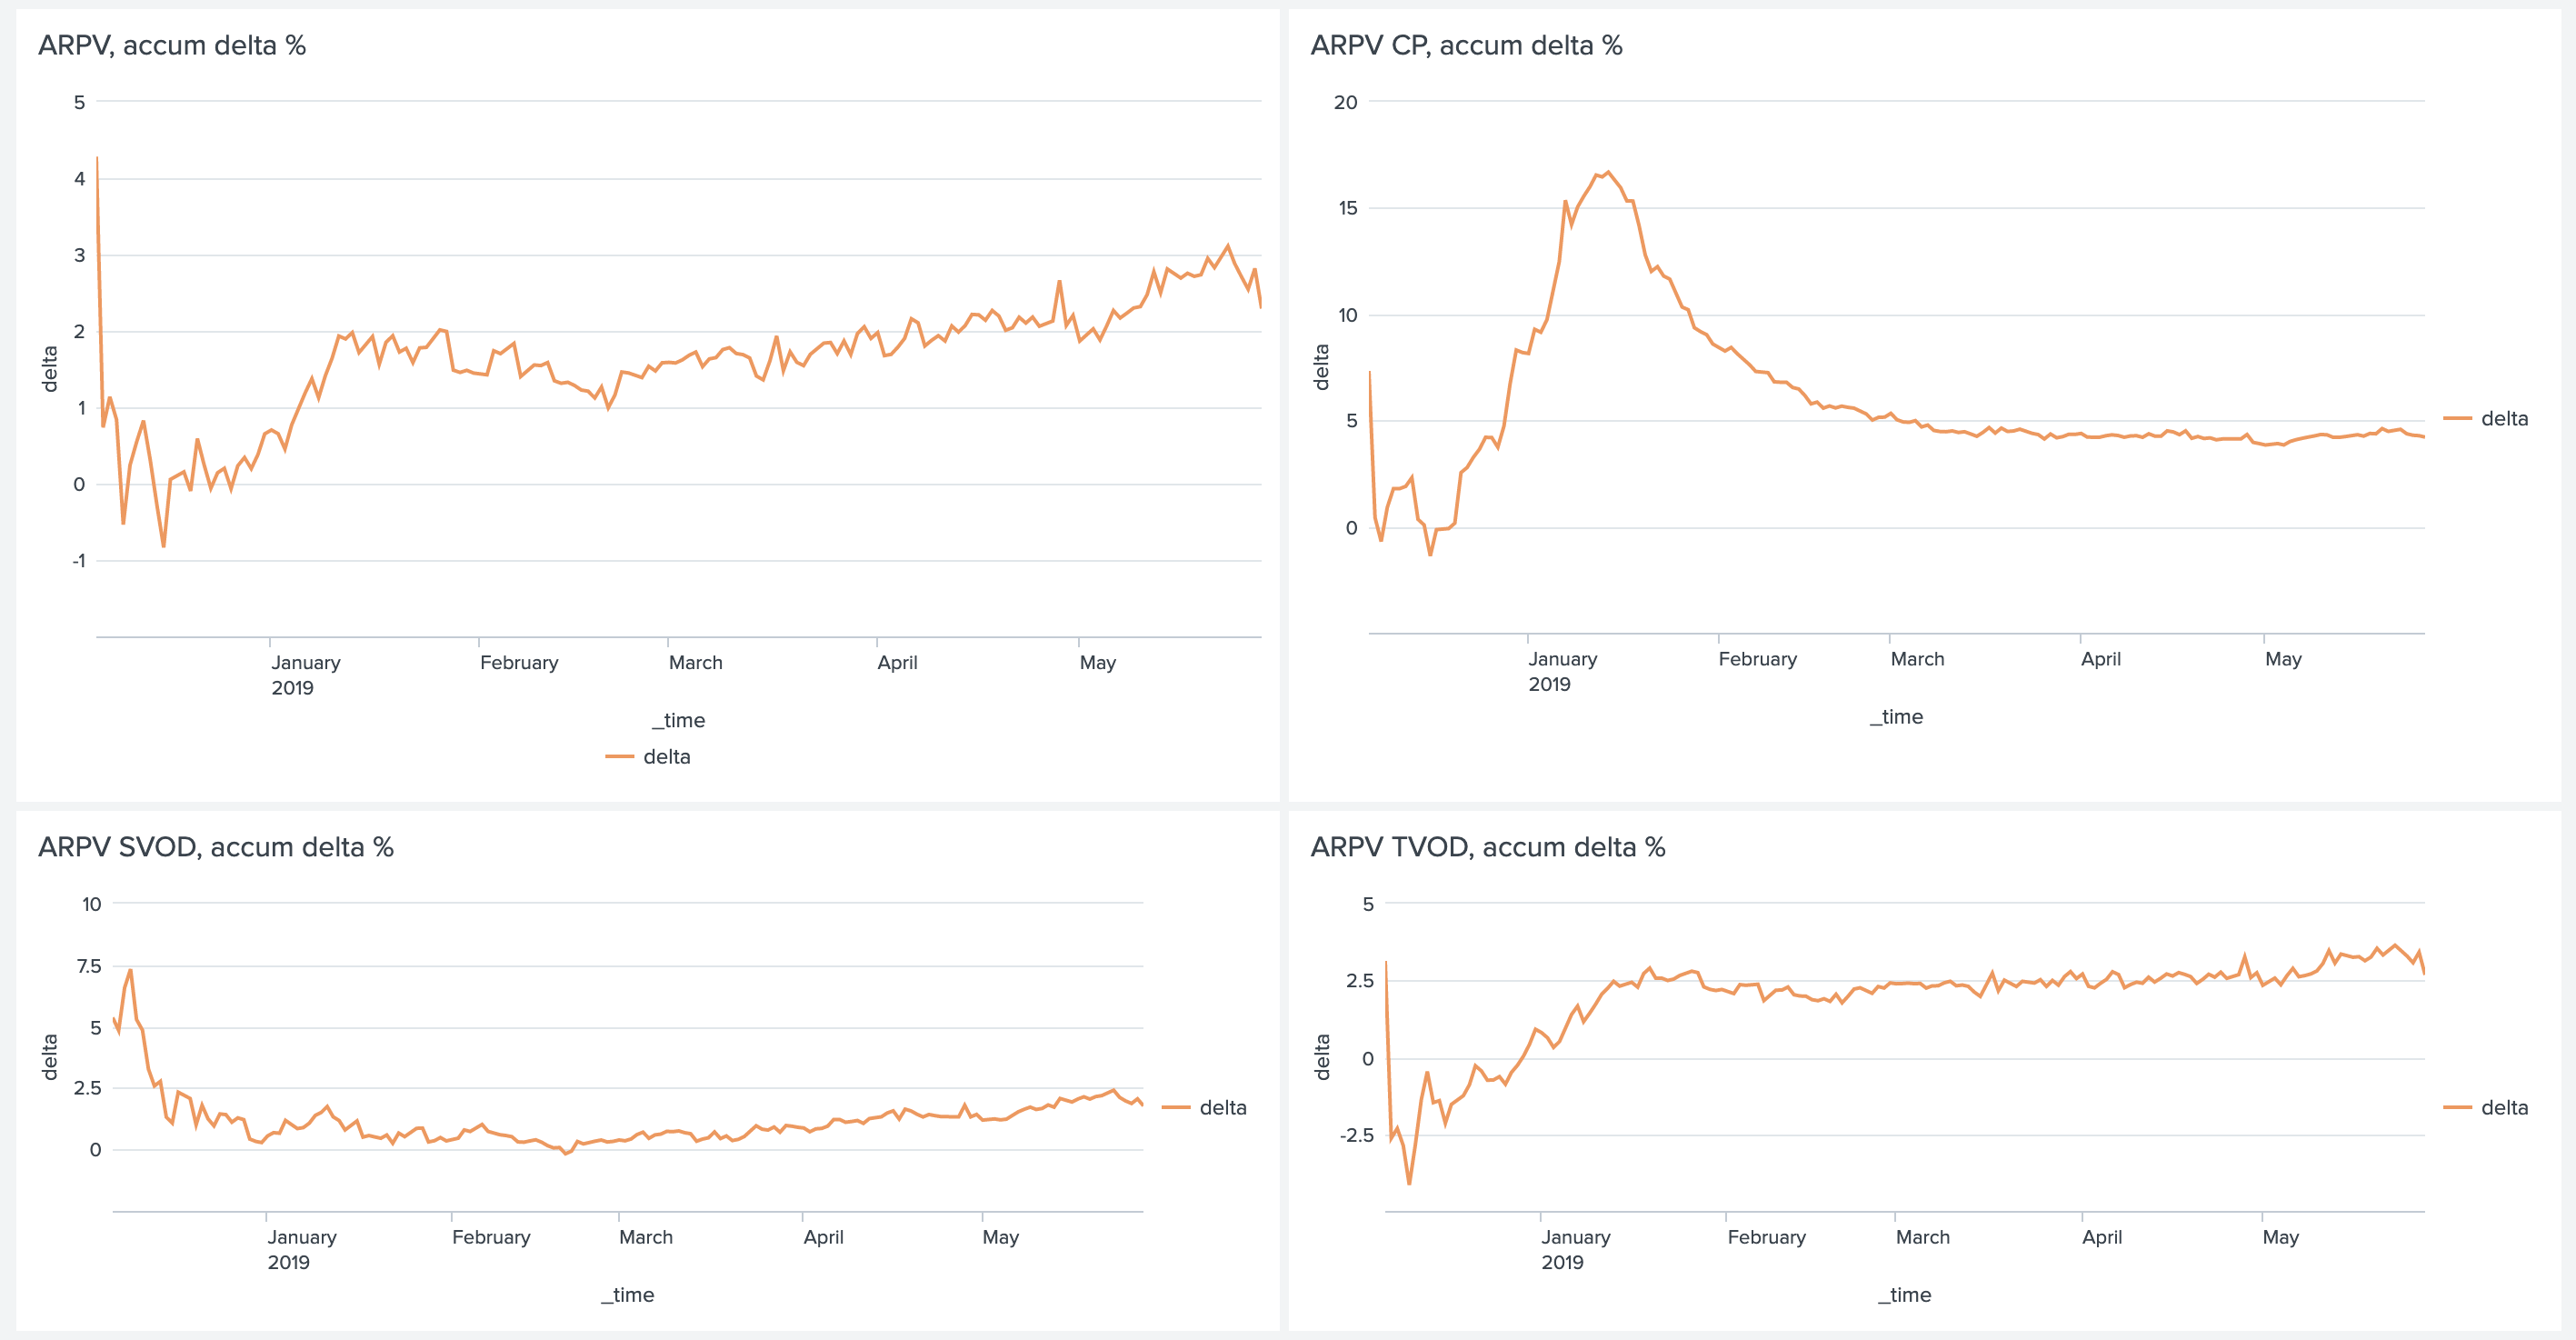
As I said at the beginning, we compare not only models among themselves, but also a group of users with recommendations against a group of users without recommendations. This allows us to evaluate the net effect of the introduction of Rekko and understand where we are at the moment and what margin for improvement still remains. According to this A / B test at the moment we have:
- ARPV + 3.5%
- ARPV with marginality + 5%
- APPU + 4.3%
- CR to trial + 2.6%
- CR to watch + 2.5%
- APPP -1%
Films in the online cinema can be divided into two groups: news and old content. We already know how to sell new items. The main purpose of personal recommendations is to get old content from the catalog that is relevant to users. This leads to an increase in the number of purchases and subsidence of the average check, since such content is naturally cheaper. But such content also has a high marginality, which compensates for the check downturn and gives a five percent increase in revenue.
More relevant subscription content has led to an increase in conversion during the trial period and a look at the subscription.

Rekko challenge
From February 18 to April 18, 2019, together with the platform of Boosters, we held the Rekko Challenge competition, where we offered participants to build a recommendation system based on anonymized product data.

Expected in the top were the participants who built a two-tier system, similar to ours. The winners, who took first and third places, managed to add to the RNN ensemble. A participant from the eighth place managed to get on it using only collaborative filtering models.
Evgeny Smirnov, who took second place in the competition, wrote an article where he spoke about his decision.
At the moment, the competition is available in the form of a sandbox, so that anyone interested in recommender systems can try their hand at it and get a rewarding experience.
Conclusion
With this article I wanted to show you that the recommendation systems in production are not difficult at all, but fun and profitable. The main thing is to think about goals, not the means to achieve them, and constantly measure everything.
In future articles, we will tell you even more about Okko's internal kitchen, so do not forget to subscribe and like.
')
Source: https://habr.com/ru/post/454224/
All Articles