RISC-V from scratch
In this article, we explore various low-level concepts (compilation and layout, primitive runtime environments, assembler, and more) through the prism of the RISC-V architecture and its ecosystem. I myself am a web developer, at work I don’t do anything like that, but it’s very interesting to me, this is where the article was born! Join me on this chaotic journey into the depths of low-level chaos.
First, let's discuss a little RISC-V and the importance of this architecture, set up a chain of RISC-V tools and run a simple C program on the emulated RISC-V hardware.
RISC-V is a free command set architecture. The project originated at the University of California at Berkeley in 2010. An important role in its success was played by the openness of the code and freedom of use, which differed sharply from many other architectures. Take ARM: to create a compatible processor, you have to pay an advance fee of $ 1 million to $ 10 million, and pay royalties of 0.5-2% from sales . The free and open model makes RISC-V an attractive option for many, including startups who can't pay a license for ARM or another processor, for academic researchers and (obviously) for the open source community.
The rapid growth in popularity of RISC-V has not gone unnoticed. ARM launched a site that tried (rather unsuccessfully) to highlight the perceived advantages of ARM over RISC-V (the site is already closed). The project RISC-V is supported by many large companies , including Google, Nvidia and Western Digital.
')
We will not be able to run the code on the RISC-V processor until we set up the environment. Fortunately, this does not require a physical RISC-V processor; instead, take qemu . To install, follow the instructions for your operating system . I have MacOS, so just enter one command:
Conveniently,
Next, install OpenOCD for RISC-V and RISC-V tools.
Download ready-made OpenISD RISC-V assemblies and RISC-V tools here .
Extract files to any directory, I have it
Set the
Create a symbolic link for this executable file in
And voila, we have a working set of tools RISC-V! All of our executable files, such as
Update May 26, 2019:
Unfortunately, because of a bug in RISC-V QEMU, the freedom-e-sdk 'hello world' program in QEMU no longer works. A patch has been released to resolve this issue, but for now you can skip this section. This program will not be needed in further sections of the article. I monitor the situation and update the article after fixing the bug.
See this comment for more information.
After setting up the tools, let's run a simple RISC-V program. Let's start with cloning the SiFive freedom-e-sdk repository:
By tradition , let's start with the 'Hello, world' program from the
And run in QEMU:
This is a great start. You can run other examples from
Let's start with a simple program that infinitely adds two numbers.
We want to run this program, and first we need to compile it for the RISC-V processor.
This is where the
We chose the
Now, when our program runs inside QEMU with a GDB server on
And we are inside GDB!
We can try to run the
But there is a way out! This situation is one of the main reasons for the existence of the client-server model of GDB. We can take the executable file
Now you can set some breakpoints:
And finally, specify GDB
You will quickly notice that the process does not end at all. This is strange ... shouldn't we immediately reach breakpoint
There are several problems here:
Combined with the fact that we cannot reach a breakpoint, these indicators indicate: we did something wrong. But what?
To understand what is happening, you need to take a step back and talk about how our simple C program under the hood actually works. The
To answer these questions, let's repeat our GCC command with the
The issue is large, so we will not view the entire listing. It is important to note that although GCC is formally a compiler, but by default it also does the layout (to limit only to compiling and building, you should specify the
I understand that even in abbreviated form is a lot, so let me explain. In the first line,
Thus, GCC compiles several
The essence of the “initial load” depends on the platform, but usually it includes important tasks, such as setting up a stack frame, passing command line arguments and calling
We solved one riddle, but how does this bring us closer to the original goal of launching a simple C program in
As we saw above,
Normally everything works fine, but not for every RISC-V processor. As mentioned earlier, one of the tasks of
In the
The dtb data is hard to read because it is basically a binary format, but there is a
The output is
As you can see, this node has 'memory' specified as
In the devicetree specification, we see that the syntax
Again, from the devicetree specification (search for the
It turns out that both the address and the length require two 32-bit values. This means that with
Using
Since
Fortunately, we are not the first to ask this question, and there is already a good solution. The GNU
Instead of writing your own linker file from scratch, it makes sense to take the default script from
Knowing this, let's copy the default
There is a lot of interesting information in this file, much more than we can discuss in this article. Detailed issuance with the
After that, run the MEMORY command to manually determine where
We created a memory block called
Great, we defined a memory layout that conforms to the specifications of our
You need to define the symbol
As you can see, we define
For brevity, I will not give here the entire linker file, it can be viewed here .
Stop!
Now we have everything we need to create our own C runtime. In fact, this is a fairly simple task, here is the entire
Immediately draws a large number of lines that begin with a dot. This is a file for the
Run through the file line by line. We will work with various standard RISC-V registers, so read this table , where all registers and their purpose are considered.
As stated in the GNU assembler manual 'as' , this line tells the assembler to enter the following code into the
These
These
And now the last part of our
Here we can finally use the symbol
Then
Next we see the instruction
As mentioned above,
This weird pattern
There are a lot of similar optimizations in RISC-V, most of which take the form of so-called pseudoinstructions . Assemblers know how to translate them into real hardware instructions. For example,
Our last line is an assembler directive
Trying to debug a simple C program on a RISC-V processor, we solved a lot of problems. First, using
Recall, here is the C program itself:
Compiling and compiling:
Here we have indicated much more flags than the last time, so let's go through those that have not been described before.
Now run our pretty new executable file in
Now run
Then we connect our client
Set a breakpoint in main:
And start the program:
From the above output, it is clear that we have successfully hit the breakpoint on line 2! This can be seen in the text interface, finally we have the correct string

From now on, you can use it
Today we have achieved a lot and, I hope, we have learned a lot! I have never had a formal plan for this and subsequent articles, I just followed what was most interesting to me at every moment. Therefore, not sure what will happen next. I especially liked the deep immersion in the manual
Thank you for reading! Hope to see you in the next article!
If you liked the article and want to learn more, check out Matt Godbol’s presentation titled “Bits between bits: how we get into main ()” from the CppCon2018 conference. She approaches the topic a little differently than we are here. Really good lecture, see for yourself!
First, let's discuss a little RISC-V and the importance of this architecture, set up a chain of RISC-V tools and run a simple C program on the emulated RISC-V hardware.
Content
- What is RISC-V?
- Customizing QEMU and RISC-V Tools
- Hi, RISC-V!
- Naive approach
- Lifting the veil -v
- Search our stack
- Layout
- Stop!
Hammertime!Runtime! - Debug but now for real
- What's next?
- Additionally
What is RISC-V?
RISC-V is a free command set architecture. The project originated at the University of California at Berkeley in 2010. An important role in its success was played by the openness of the code and freedom of use, which differed sharply from many other architectures. Take ARM: to create a compatible processor, you have to pay an advance fee of $ 1 million to $ 10 million, and pay royalties of 0.5-2% from sales . The free and open model makes RISC-V an attractive option for many, including startups who can't pay a license for ARM or another processor, for academic researchers and (obviously) for the open source community.
The rapid growth in popularity of RISC-V has not gone unnoticed. ARM launched a site that tried (rather unsuccessfully) to highlight the perceived advantages of ARM over RISC-V (the site is already closed). The project RISC-V is supported by many large companies , including Google, Nvidia and Western Digital.
')
Customizing QEMU and RISC-V Tools
We will not be able to run the code on the RISC-V processor until we set up the environment. Fortunately, this does not require a physical RISC-V processor; instead, take qemu . To install, follow the instructions for your operating system . I have MacOS, so just enter one command:
# also available via MacPorts - `sudo port install qemu` brew install qemu Conveniently,
qemu comes with several ready-to-use machines (see the qemu-system-riscv32 -machine ).Next, install OpenOCD for RISC-V and RISC-V tools.
Download ready-made OpenISD RISC-V assemblies and RISC-V tools here .
Extract files to any directory, I have it
~/usys/riscv . Memorize it for future reference. mkdir -p ~/usys/riscv cd ~/Downloads cp openocd-<date>-<platform>.tar.gz ~/usys/riscv cp riscv64-unknown-elf-gcc-<date>-<platform>.tar.gz ~/usys/riscv cd ~/usys/riscv tar -xvf openocd-<date>-<platform>.tar.gz tar -xvf riscv64-unknown-elf-gcc-<date>-<platform>.tar.gz Set the
RISCV_OPENOCD_PATH and RISCV_PATH environment variables so that other programs can find our tool chain. It may look different depending on the OS and the shell: I added paths to the ~/.zshenv . # I put these two exports directly in my ~/.zshenv file - you may have to do something else. export RISCV_OPENOCD_PATH="$HOME/usys/riscv/openocd-<date>-<version>" export RISCV_PATH="$HOME/usys/riscv/riscv64-unknown-elf-gcc-<date>-<version>" # Reload .zshenv with our new environment variables. Restarting your shell will have a similar effect. source ~/.zshenv Create a symbolic link for this executable file in
/usr/local/bin to run it at any time without specifying the full path to ~/usys/riscv/riscv64-unknown-elf-gcc-<date>-<version>/bin/riscv64-unknown-elf-gcc . # Symbolically link our gcc executable into /usr/local/bin. Repeat this process for any other executables you want to quickly access. ln -s ~/usys/riscv/riscv64-unknown-elf-gcc-8.2.0-<date>-<version>/bin/riscv64-unknown-elf-gcc /usr/local/bin And voila, we have a working set of tools RISC-V! All of our executable files, such as
riscv64-unknown-elf-gcc , riscv64-unknown-elf-gdb , riscv64-unknown-elf-ld and others, are located in ~/usys/riscv/riscv64-unknown-elf-gcc-<date>-<version>/bin/ .Hi, RISC-V!
Update May 26, 2019:
Unfortunately, because of a bug in RISC-V QEMU, the freedom-e-sdk 'hello world' program in QEMU no longer works. A patch has been released to resolve this issue, but for now you can skip this section. This program will not be needed in further sections of the article. I monitor the situation and update the article after fixing the bug.
See this comment for more information.
After setting up the tools, let's run a simple RISC-V program. Let's start with cloning the SiFive freedom-e-sdk repository:
cd ~/wherever/you/want/to/clone/this git clone --recursive https://github.com/sifive/freedom-e-sdk.git cd freedom-e-sdk By tradition , let's start with the 'Hello, world' program from the
freedom-e-sdk repository. We use a ready-made Makefile , which they provide for compiling this program in debug mode: make PROGRAM=hello TARGET=sifive-hifive1 CONFIGURATION=debug software And run in QEMU:
qemu-system-riscv32 -nographic -machine sifive_e -kernel software/hello/debug/hello.elf Hello, World! This is a great start. You can run other examples from
freedom-e-sdk . After that, we will write and try to debug our own C program.Naive approach
Let's start with a simple program that infinitely adds two numbers.
cat add.c int main() { int a = 4; int b = 12; while (1) { int c = a + b; } return 0; } We want to run this program, and first we need to compile it for the RISC-V processor.
# -O0 to disable all optimizations. Without this, GCC might optimize # away our infinite addition since the result 'c' is never used. # -g to tell GCC to preserve debug info in our executable. riscv64-unknown-elf-gcc add.c -O0 -g This is where the
a.out file is created, the default gcc name for executables. Now run this file in qemu : # -machine tells QEMU which among our list of available machines we want to # run our executable against. Run qemu-system-riscv64 -machine help to list # all available machines. # -m is the amount of memory to allocate to our virtual machine. # -gdb tcp::1234 tells QEMU to also start a GDB server on localhost:1234 where # TCP is the means of communication. # -kernel tells QEMU what we're looking to run, even if our executable isn't # exactly a "kernel". qemu-system-riscv64 -machine virt -m 128M -gdb tcp::1234 -kernel a.out We chose the
virt machine that riscv-qemu comes riscv-qemu .Now, when our program runs inside QEMU with a GDB server on
localhost:1234 , connect to it with a RISC-V GDB client from a separate terminal: # --tui gives us a (t)extual (ui) for our GDB session. # While we can start GDB without any arguments, specifying 'a.out' tells GDB # to load debug symbols from that file for the newly created session. riscv64-unknown-elf-gdb --tui a.out And we are inside GDB!
  This GDB was configured as "--host = x86_64-apple-darwin17.7.0 --target = riscv64-unknown-elf".  │
 Type "show configuration" for configuration details.  │
 For bug reporting instructions, please see: │
 <http://www.gnu.org/software/gdb/bugs/>.  │
 Find the GDB manual and other documentation online at: │
     <http://www.gnu.org/software/gdb/documentation/>.  │
                                                                                                       │
 For help, type "help".  │
 Type "apropos word" ... │
 Reading symbols from a.out ... │
 (gdb)
We can try to run the
run or start commands for the a.out executable file in GDB, but at the moment it will not work for an obvious reason. We compiled the program as riscv64-unknown-elf-gcc , so the host should work on the riscv64 architecture.But there is a way out! This situation is one of the main reasons for the existence of the client-server model of GDB. We can take the executable file
riscv64-unknown-elf-gdb and instead of launching it on the host, point it to some remote target (GDB server). As you remember, we just ran riscv-qemu and told to start the GDB server on localhost:1234 . Just connect to this server:(gdb) target remote: 1234 Remote debugging using: 1234
Now you can set some breakpoints:
(gdb) b main Breakpoint 1 at 0x1018e: file add.c, line 2. (gdb) b 5 # this is the line within the forever-while loop. int c = a + b; Breakpoint 2 at 0x1019a: file add.c, line 5. And finally, specify GDB
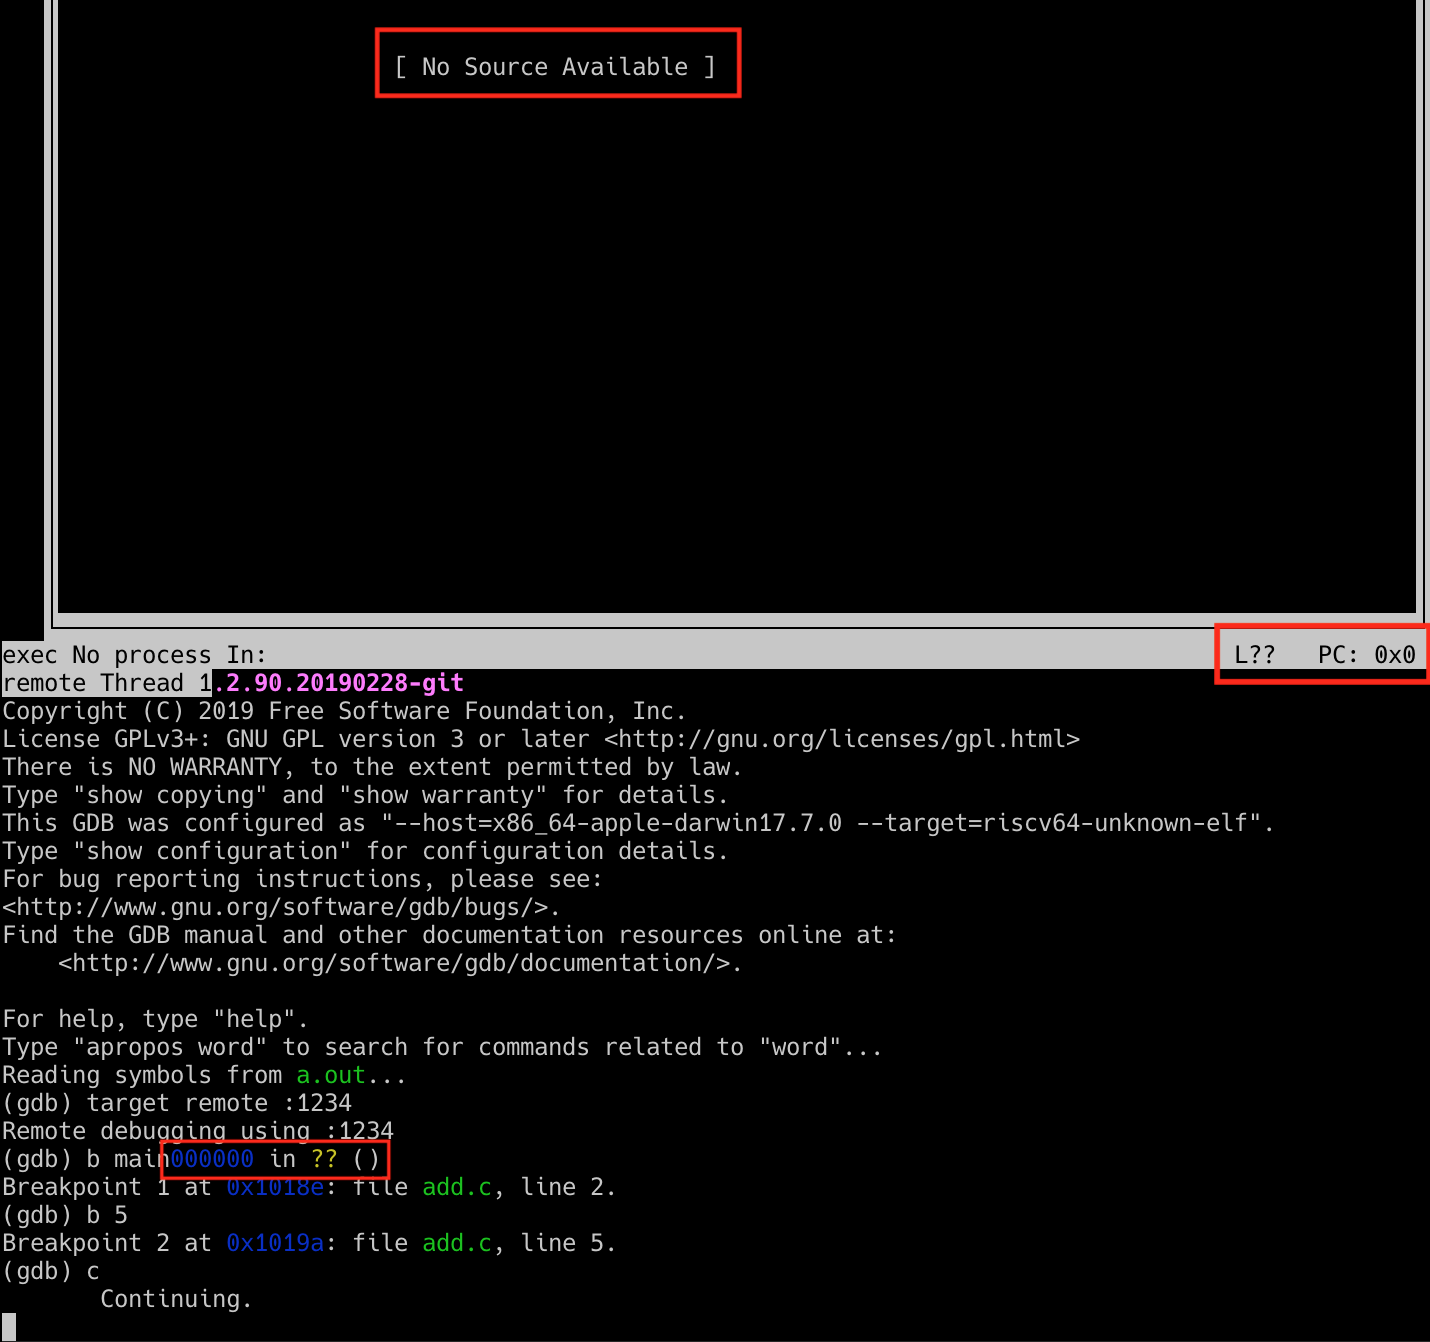
continue (abbreviated c command) until we reach a breakpoint: (gdb) c Continuing. You will quickly notice that the process does not end at all. This is strange ... shouldn't we immediately reach breakpoint
b 5 ? What happened?There are several problems here:
- Text UI can not find the source. The interface should display our code and any nearby breakpoints.
- GDB does not see the current execution line (
L??) and displays the 0x0 counter (PC: 0x0). - Some text in the input line, which in its full form looks like this:
0x0000000000000000 in ?? ()0x0000000000000000 in ?? ()
Combined with the fact that we cannot reach a breakpoint, these indicators indicate: we did something wrong. But what?
Lifting the veil -v
To understand what is happening, you need to take a step back and talk about how our simple C program under the hood actually works. The
main function performs simple addition, but what is it really? Why should it be called main , not origin or begin ? According to the convention, all executable files start to run from the main function, but what magic does this behavior provide?To answer these questions, let's repeat our GCC command with the
-v flag to get a more detailed output of what is actually happening. riscv64-unknown-elf-gcc add.c -O0 -g -v The issue is large, so we will not view the entire listing. It is important to note that although GCC is formally a compiler, but by default it also does the layout (to limit only to compiling and building, you should specify the
-c flag). Why is it important? Well, take a look at a fragment from the gcc detailed output:# The actual `gcc -v` command outputs # long, so pretend these variables exist. # $ RV_GCC_BIN_PATH = / Users / twilcock / usys / riscv / riscv64-unknown-elf-gcc- <date> - <version> / bin / # $ RV_GCC_LIB_PATH = $ RV_GCC_BIN_PATH /../lib / gcc / riscv64-unknown-elf / 8.2.0 $ RV_GCC_BIN_PATH /../ libexec / gcc / riscv64-unknown-elf / 8.2.0 / collect2 \ ... truncated ... $ RV_GCC_LIB_PATH /../../../../ riscv64-unknown-elf / lib / rv64imafdc / lp64d / crt0.o \ $ RV_GCC_LIB_PATH / riscv64-unknown-elf / 8.2.0 / rv64imafdc / lp64d / crtbegin.o \ -lgcc - start-group -lc -lgloss - end-group-lgcc \ $ RV_GCC_LIB_PATH / rv64imafdc / lp64d / crtend.o ... truncated ... COLLECT_GCC_OPTIONS = '- O0' '-g' '-v' '-march = rv64imafdc' '-mabi = lp64d'
I understand that even in abbreviated form is a lot, so let me explain. In the first line,
gcc runs the collect2 program, collect2 in the arguments crt0.o , crtbegin.o and crtend.o , the flags -lgcc and --start-group . Description of collect2 can be read here : briefly, collect2 organizes various initialization functions at startup, making the layout in one or more passes.Thus, GCC compiles several
crt files with our code. As you can guess, crt means 'C runtime'. It describes in detail what each crt , but we are interested in crt0 , which does one important thing:"It is expected that this object [crt0] contains the symbol _start , which indicates the initial load of the program."The essence of the “initial load” depends on the platform, but usually it includes important tasks, such as setting up a stack frame, passing command line arguments and calling
main . Yes, finally we have found the answer to the question: it is _start calls our main function!Search our stack
We solved one riddle, but how does this bring us closer to the original goal of launching a simple C program in
gdb ? It remains to solve several problems: the first one is related to the way crt0 sets up our stack.As we saw above,
gcc crt0 by default. The default parameters are selected based on several factors:- Target triplet corresponding to the structure of the
machine-vendor-operatingsystem. We have thisriscv64-unknown-elf - Target architecture,
rv64imafdc - Target ABI,
lp64d
Normally everything works fine, but not for every RISC-V processor. As mentioned earlier, one of the tasks of
crt0 is to configure the stack. But he does not know where exactly should the stack be for our CPU ( -machine )? He can not cope without our help.In the
qemu-system-riscv64 -machine virt -m 128M -gdb tcp::1234 -kernel a.out we used the virt machine. Fortunately, qemu makes it easy to reset machine information to a dtb dump (device tree blob). # Go to the ~/usys/riscv folder we created before and create a new dir # for our machine information. cd ~/usys/riscv && mkdir machines cd machines # Use qemu to dump info about the 'virt' machine in dtb (device tree blob) # format. # The data in this file represents hardware components of a given # machine / device / board. qemu-system-riscv64 -machine virt -machine dumpdtb=riscv64-virt.dtb The dtb data is hard to read because it is basically a binary format, but there is a
dtc command line utility (device tree compiler) that can convert the file to something more readable. # I'm running MacOS, so I use Homebrew to install this. If you're # running another OS you may need to do something else. brew install dtc # Convert our .dtb into a human-readable .dts (device tree source) file. dtc -I dtb -O dts -o riscv64-virt.dts riscv64-virt.dtb The output is
riscv64-virt.dts , where we see a lot of interesting information about virt : the number of available processor cores, the memory location of various peripheral devices, such as the UART, the location of the built-in memory (RAM). The stack should be in this memory, so look for it using grep : grep memory riscv64-virt.dts -A 3 memory@80000000 { device_type = "memory"; reg = <0x00 0x80000000 0x00 0x8000000>; }; As you can see, this node has 'memory' specified as
device_type . Apparently, we found what we were looking for. According to the values inside reg = <...> ; You can determine where the memory bank starts and what is its length.In the devicetree specification, we see that the syntax
reg is an arbitrary number of pairs (base_address, length) . However, reg four values. Strange, is it not enough for one memory bank two values?Again, from the devicetree specification (search for the
reg property), we learn that the number of <u32> cells to specify the address and length is determined by the #address-cells and #size-cells properties in the parent node (or in the node itself). These values are not indicated in our memory node, and the parent memory node is simply the root of the file. Let's look for these values in it: head -n8 riscv64-virt.dts /dts-v1/; / { #address-cells = <0x02>; #size-cells = <0x02>; compatible = "riscv-virtio"; model = "riscv-virtio,qemu"; It turns out that both the address and the length require two 32-bit values. This means that with
reg = <0x00 0x80000000 0x00 0x8000000>; our memory starts 0x00 + 0x80000000 (0x80000000) and occupies 0x00 + 0x8000000 (0x8000000) bytes, that is, ends at 0x88000000 , which corresponds to 128 megabytes.Layout
Using
qemu and dtc we found the RAM addresses in the virt virtual machine. We also know that gcc crt0 by default without setting up the stack as we need. But how to use this information to eventually run and debug the program?Since
crt0 does not suit us, there is one obvious option: to write your own code, and then link it with an object file, which turned out after compiling our simple program. Our crt0 needs to know where the top of the stack begins in order to properly initialize it. We could hard-code the value 0x80000000 directly to crt0 , but this is not a very suitable solution considering the changes that may be needed in the future. What if we want to use another CPU in the emulator, such as sifive_e , with different characteristics?Fortunately, we are not the first to ask this question, and there is already a good solution. The GNU
ld linker allows you to define a symbol that is accessible from our crt0 . We can define a __stack_top symbol suitable for different processors.Instead of writing your own linker file from scratch, it makes sense to take the default script from
ld and slightly modify it to support additional characters. What is a linker script? Here is a good description :The main purpose of the linker script is to describe how the sections of the files in the input and output are mapped, and to manage the layout of the memory of the output file.
Knowing this, let's copy the default
riscv64-unknown-elf-ld linker script to a new file: cd ~/usys/riscv # Make a new dir for custom linker scripts out RISC-V CPUs may require. mkdir ld && cd ld # Copy the default linker script into riscv64-virt.ld riscv64-unknown-elf-ld --verbose > riscv64-virt.ld There is a lot of interesting information in this file, much more than we can discuss in this article. Detailed issuance with the
--Verbose key includes information about the ld version, supported architectures, and more. This is all good to know, but in the linker script this syntax is not allowed, so open the text editor and remove everything unnecessary from the file. vim riscv64-virt.ld
# Remove everything above and including the ============= line
GNU ld (GNU Binutils) 2.32
Supported emulations:
elf64lriscv
elf32lriscv
using internal linker script:
=================================================
/ * Script for -z combreloc: combine and sort reloc sections * /
/ * Copyright (C) 2014-2019 Free Software Foundation, Inc.
Without modification,
are not allowed
notice this notice are preserved. * /
OUTPUT_FORMAT ("elf64-littleriscv", "elf64-littleriscv",
"elf64-littleriscv")
... rest of the linker script ... After that, run the MEMORY command to manually determine where
__stack_top will be. Find the line that starts with OUTPUT_ARCH(riscv) , it should be at the top of the file, and add the MEMORY command below it: OUTPUT_ARCH(riscv) /* >>> Our addition. <<< */ MEMORY { /* qemu-system-risc64 virt machine */ RAM (rwx) : ORIGIN = 0x80000000, LENGTH = 128M } /* >>> End of our addition. <<< */ ENTRY(_start) We created a memory block called
RAM , for which read ( r ), write ( w ), and storage of executable code ( x ) are valid.Great, we defined a memory layout that conforms to the specifications of our
virt RISC-V machine. Now you can use it. We want to put our stack in memory.You need to define the symbol
__stack_top . Open your linker script ( riscv64-virt.ld ) in a text editor and add a few lines: SECTIONS { /* Read-only sections, merged into text segment: */ PROVIDE (__executable_start = SEGMENT_START("text-segment", 0x10000)); . = SEGMENT_START("text-segment", 0x10000) + SIZEOF_HEADERS; /* >>> Our addition. <<< */ PROVIDE(__stack_top = ORIGIN(RAM) + LENGTH(RAM)); /* >>> End of our addition. <<< */ .interp : { *(.interp) } .note.gnu.build-id : { *(.note.gnu.build-id) } As you can see, we define
__stack_top using the PROVIDE command . The symbol will be accessible from any program associated with this script (assuming that the program itself does not detect something with the name __stack_top ). Set the __stack_top value to ORIGIN(RAM) . We know that this value is 0x80000000 plus LENGTH(RAM) , which is 128 megabytes ( 0x8000000 bytes). This means that our __stack_top set to 0x88000000 .For brevity, I will not give here the entire linker file, it can be viewed here .
Stop! Hammertime! Runtime!
Now we have everything we need to create our own C runtime. In fact, this is a fairly simple task, here is the entire
crt0.s file: .section .init, "ax" .global _start _start: .cfi_startproc .cfi_undefined ra .option push .option norelax la gp, __global_pointer$ .option pop la sp, __stack_top add s0, sp, zero jal zero, main .cfi_endproc .end Immediately draws a large number of lines that begin with a dot. This is a file for the
as assembler. Lines with a dot are called assembler directives : they provide information for the assembler. This is not executable code, like RISC-V assembler instructions such as jal and add .Run through the file line by line. We will work with various standard RISC-V registers, so read this table , where all registers and their purpose are considered.
.section .init, "ax" As stated in the GNU assembler manual 'as' , this line tells the assembler to enter the following code into the
.init section, which is selectable ( a ) and executable ( x ). This section is another common convention for running code within the operating system. We work on pure hardware without an OS, so in our case such instruction may not be completely necessary, but in any case it is a good practice. .global _start _start: .global makes the next character available to ld . Without this, the layout will not work, because the ENTRY(_start) in the linker script points to the _start symbol as an entry point to the executable file. The next line tells the assembler that we are starting the definition of the _start character. _start: .cfi_startproc .cfi_undefined ra ...other stuff... .cfi_endproc These
.cfi directives inform you about the frame structure and how to handle it. The .cfi_startproc and .cfi_endproc signal the beginning and end of a function, and .cfi_undefined ra informs the assembler that the ra register should not be restored to any value contained in it before starting _start . .option push .option norelax la gp, __global_pointer$ .option pop These
.option directives change the behavior of the assembler in accordance with the code when you need to apply a certain set of options. Here is a detailed description of why the use of .option in this segment is important:... since we, when possible, weaken (relax) the addressing of sequences to shorter sequences relative to the GP, the initial loading of the GP should not be weakened and should be given something like this:.option push .option norelax la gp, __global_pointer$ .option pop
so that after relaxation we get the following code:auipc gp, %pcrel_hi(__global_pointer$) addi gp, gp, %pcrel_lo(__global_pointer$)
instead of simple:addi gp, gp, 0
And now the last part of our
crt0.s : _start: ...other stuff... la sp, __stack_top add s0, sp, zero jal zero, main .cfi_endproc .end Here we can finally use the symbol
__stack_top , on the creation of which we have worked so much. The la pseudoinstruction (load address) loads the __stack_top value into the sp register (stack pointer), setting it for use in the rest of the program.Then
add s0, sp, zero adds the values of the sp and zero registers (which is actually a x0 register with a hard reference to 0) and places the result in the s0 register. This is a special register that is unusual in several respects. First, it is a “save register”, that is, it is saved when function calls. Secondly, s0 sometimes acts as a frame pointer, which gives each function call a small stack space for storing parameters passed to this function. How function calls work with the stack and frame pointers is a very interesting topic that you can easily devote to a separate article, but for now just know that in our runtime environment it is important to initialize the s0 frame pointer.Next we see the instruction
jal zero, main . Here jal means jump and link. The instruction expects operands in the form jal rd (destination register), offset_address . Functionally, jal writes the value of the next instruction (the register pc plus four) to rd , and then sets the register pc to the current value pc plus the address of the offset with the extension of the character , effectively “calling” this address.As mentioned above,
x0 strictly bound to the literal value 0, and writing to it is useless.Therefore, it may seem strange that we use a register as the destination register zero, which RISC-V assemblers interpret as a register x0. After all, this means an unconditional transition to offset_address. Why do so, because in other architectures there is an explicit unconditional branch instruction?This weird pattern
jal zero, offset_addressis actually a smart optimization. Support for each new instruction means an increase and, therefore, an increase in the cost of the processor. Therefore, the simpler the ISA, the better. Instead of polluting the instruction space with two instructions jaland unconditional jump, the RISC-V architecture only supports jaland unconditional transitions are supported through jal zero, main.There are a lot of similar optimizations in RISC-V, most of which take the form of so-called pseudoinstructions . Assemblers know how to translate them into real hardware instructions. For example,
j offset_addressRISC-V assemblers translate the pseudoinstruction of unconditional jump to jal zero, offset_address. For a complete list of officially supported pseudoinstructions, see the RISC-V specification (version 2.2) . _start: ...other stuff... jal zero, main .cfi_endproc .end Our last line is an assembler directive
.endthat simply marks the end of the file.Debug but now for real
Trying to debug a simple C program on a RISC-V processor, we solved a lot of problems. First, using
qemuand dtcfound our memory in the virtual machine virtRISC-V. Then we used this information to manually control the memory allocation in our version of the default linker script riscv64-unknown-elf-ld, which allowed us to determine the exact character __stack_top. Then we used this symbol in our own version crt0.s, which sets up our stack and global pointers, and finally called the function main. Now you can reach your goal and start debugging our simple program in GDB.Recall, here is the C program itself:
cat add.c int main() { int a = 4; int b = 12; while (1) { int c = a + b; } return 0; } Compiling and compiling:
riscv64-unknown-elf-gcc -g -ffreestanding -O0 -Wl,--gc-sections -nostartfiles -nostdlib -nodefaultlibs -Wl,-T,riscv64-virt.ld crt0.s add.c Here we have indicated much more flags than the last time, so let's go through those that have not been described before.
-ffreestanding informs the compiler that the standard library may not exist , so no need to make assumptions about its mandatory presence. This parameter is not required when running the application on your host (in the operating system), but in this case it is not so, therefore it is important to inform the compiler this information.-Wl- A comma separated list of flags to pass to the linker ( ld). Here it --gc-sectionsmeans “garbage collection sections”, and ldis instructed to remove unused sections after layout. Flags -nostartfiles, -nostdliband -nodefaultlibstell the linker not to handle standard system startup files (for example, defaultcrt0), standard system stdlib implementations and standard system default link libraries. We have our own script crt0and linker, so it is important to pass these flags so that the default values do not conflict with our custom settings.-Tindicates the path to our linker script, which in our case is simple riscv64-virt.ld. Finally, we specify the files that we want to compile, build, and link: crt0.sand add.c. As before, the result is a complete and ready-to-run file called a.out.Now run our pretty new executable file in
qemu: # -S freezes execution of our executable (-kernel) until we explicitly tell # it to start with a 'continue' or 'c' from our gdb client qemu-system-riscv64 -machine virt -m 128M -gdb tcp::1234 -S -kernel a.out Now run
gdb, do not forget to load the debug symbols for a.out, specifying it with the last argument: riscv64-unknown-elf-gdb --tui a.out GNU gdb (GDB) 8.2.90.20190228-git Copyright (C) 2019 Free Software Foundation, Inc. License GPLv3+: GNU GPL version 3 or later <http://gnu.org/licenses/gpl.html> This is free software: you are free to change and redistribute it. There is NO WARRANTY, to the extent permitted by law. Type "show copying" and "show warranty" for details. This GDB was configured as "--host=x86_64-apple-darwin17.7.0 --target=riscv64-unknown-elf". Type "show configuration" for configuration details. For bug reporting instructions, please see: <http://www.gnu.org/software/gdb/bugs/>. Find the GDB manual and other documentation resources online at: <http://www.gnu.org/software/gdb/documentation/>. For help, type "help". Type "apropos word" to search for commands related to "word"... Reading symbols from a.out... (gdb) Then we connect our client
gdbto the server gdb, which we launched as part of the command qemu: (gdb) target remote :1234 │ Remote debugging using :1234 Set a breakpoint in main:
(gdb) b main Breakpoint 1 at 0x8000001e: file add.c, line 2. And start the program:
(gdb) c Continuing. Breakpoint 1, main () at add.c:2 From the above output, it is clear that we have successfully hit the breakpoint on line 2! This can be seen in the text interface, finally we have the correct string
L, the value PC:is equal L2, and PC:- 0x8000001e. If you did everything as in the article, the output will be something like this:From now on, you can use it
gdbas usual: -sto go to the next instruction, info all-registersto check the values inside the registers as the program runs, etc. Experiment at your leisure ... of course we A lot of work for this!What's next?
Today we have achieved a lot and, I hope, we have learned a lot! I have never had a formal plan for this and subsequent articles, I just followed what was most interesting to me at every moment. Therefore, not sure what will happen next. I especially liked the deep immersion in the manual
jal, so maybe in the next article we take the knowledge gained here, but replace it with add.csome program in pure RISC-V assembler. If you have something specific that you would like to see or any questions, open tickets .Thank you for reading! Hope to see you in the next article!
Additionally
If you liked the article and want to learn more, check out Matt Godbol’s presentation titled “Bits between bits: how we get into main ()” from the CppCon2018 conference. She approaches the topic a little differently than we are here. Really good lecture, see for yourself!
Source: https://habr.com/ru/post/454208/
All Articles