Sending statistics from a DataFrame to BigQuery using the example of Yandex Yandex Statistics
In this article I’ll talk about how I summarized statistics across the context in one place using BigQuery and Data Studio
I have a need to visualize data on all traffic sources.
For this task I use Data Studio. Google Ads is pulled up there in the most beautiful way, but with Yandex Direct it is getting harder.
')
For myself, I chose a semi-manual method of aggregating statistics: receiving and sending statistics from my computer.
Every day I get statics in various sections in the DataFrame.
And that's great because pandas has a library called pandas_gbq, which can send a DataFrame to BigQuery.
To begin with, let us define what sections of statistics we will send.
Since we can store a lot of information in BigQuery, I have set aside statistics for myself in the context of days.
You also need to take into account the fact that we need to receive statistics for at least a month to overwrite, as advertising systems update old statistics due to clicking.
Therefore, for the time being I do not use statistics for myself in terms of keys, since it is often unnecessary.
I will tell all on the example of daily statistics in the context of the Republic of Kazakhstan. (columns: date and RC)
Next, we will discuss how to modify the DataFrame so that it goes.
For some RCs we will get empty fields in behavioral factors and conversions.

To get around this problem, you need to replace the minuses with "0".
And assign a numeric data type.
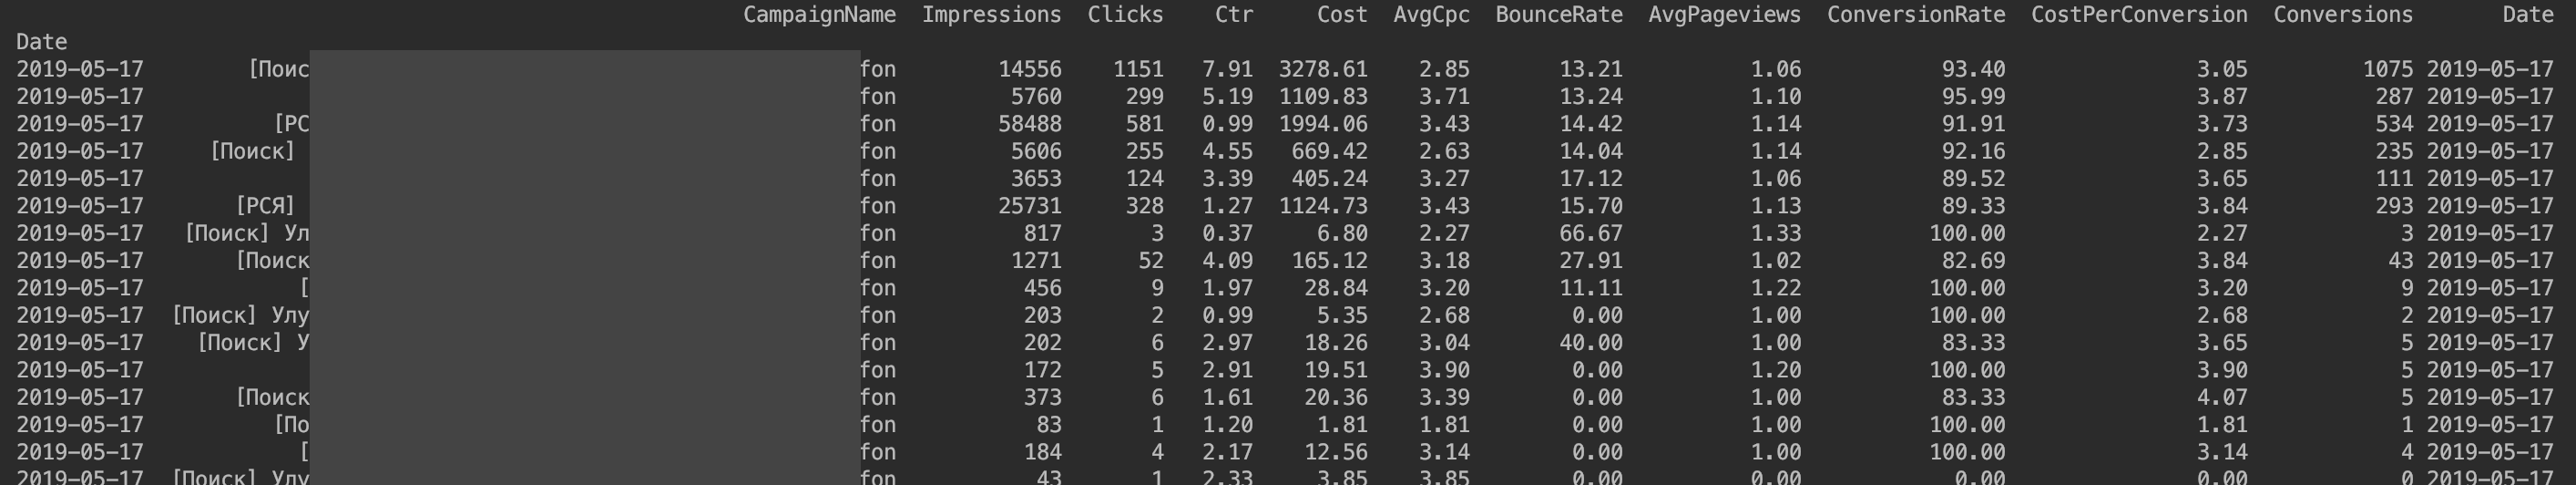
Add a separate indexable column. If we send such a DataFrame or look at the data type using dtipe, we see that there is no column with dates.
To remedy the situation, create a column that will be equal to the indexed column.
We receive the following DataFrame

Specify the name of the DataFrame, the name of the dataset, the name of the file (it may not yet exist), the name of the project and how the file will be recorded (in our case there will be a complete overwriting of the file).
We get the following in BigQuery:

It remains only to visualize the data in DataStudio. End Code:
Thanks for attention!
I have a need to visualize data on all traffic sources.
For this task I use Data Studio. Google Ads is pulled up there in the most beautiful way, but with Yandex Direct it is getting harder.
')
For myself, I chose a semi-manual method of aggregating statistics: receiving and sending statistics from my computer.
Every day I get statics in various sections in the DataFrame.
And that's great because pandas has a library called pandas_gbq, which can send a DataFrame to BigQuery.
What statistics to store in BigQuery
To begin with, let us define what sections of statistics we will send.
Since we can store a lot of information in BigQuery, I have set aside statistics for myself in the context of days.
You also need to take into account the fact that we need to receive statistics for at least a month to overwrite, as advertising systems update old statistics due to clicking.
Therefore, for the time being I do not use statistics for myself in terms of keys, since it is often unnecessary.
I will tell all on the example of daily statistics in the context of the Republic of Kazakhstan. (columns: date and RC)
Next, we will discuss how to modify the DataFrame so that it goes.
Modifying DataFrame
Problem 1
For some RCs we will get empty fields in behavioral factors and conversions.
To get around this problem, you need to replace the minuses with "0".
f['Conversions'].replace(['--'],[0],inplace=True) f['CostPerConversion'].replace(['--'],[0],inplace=True) f['ConversionRate'].replace(['--'],[0],inplace=True) f['AvgPageviews'].replace(['--'],[0],inplace=True) f['BounceRate'].replace(['--'],[0],inplace=True) And assign a numeric data type.
f[["Conversions","CostPerConversion","ConversionRate","AvgPageviews","BounceRate"]]=f[["Conversions","CostPerConversion","ConversionRate","AvgPageviews","BounceRate"]].apply(pd.to_numeric) Problem 2
Add a separate indexable column. If we send such a DataFrame or look at the data type using dtipe, we see that there is no column with dates.
To remedy the situation, create a column that will be equal to the indexed column.
f['Date']=f.index We receive the following DataFrame
We send DataFrame to BigQuery
pandas_gbq.to_gbq(f,' .',project_id=' ',if_exists='replace') Specify the name of the DataFrame, the name of the dataset, the name of the file (it may not yet exist), the name of the project and how the file will be recorded (in our case there will be a complete overwriting of the file).
We get the following in BigQuery:
It remains only to visualize the data in DataStudio. End Code:
f['Date']=f.index f['Conversions'].replace(['--'],[0],inplace=True) f['CostPerConversion'].replace(['--'],[0],inplace=True) f['ConversionRate'].replace(['--'],[0],inplace=True) f['AvgPageviews'].replace(['--'],[0],inplace=True) f['BounceRate'].replace(['--'],[0],inplace=True) f[["Conversions", "CostPerConversion","ConversionRate","AvgPageviews","BounceRate"]] = f[["Conversions", "CostPerConversion","ConversionRate","AvgPageviews","BounceRate"]].apply(pd.to_numeric) pandas_gbq.to_gbq(f, 'YD_Days.my_client_rk', project_id='my_project',if_exists='replace') Thanks for attention!
Source: https://habr.com/ru/post/454172/
All Articles