Recommender systems: ideas, approaches, tasks
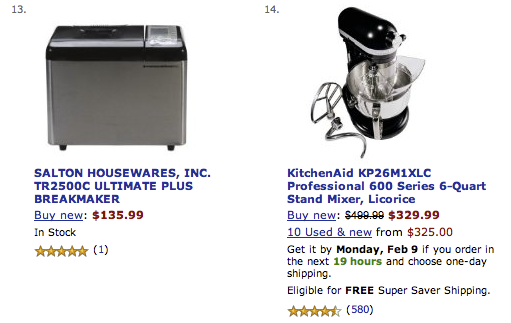
Many are accustomed to rating the film on KinoPoisk or imdb after viewing, and the sections “With this product were also bought” and “Popular goods” are in any online store. But there are less familiar types of recommendations. In this article I will talk about what tasks the recommender systems solve, where to run and what to google.
What do we recommend?
What if we want to recommend a comfortable route for the user ? Different aspects of a trip are important for different users: seat availability, travel time, traffic, air conditioning, beautiful view from the window. An unusual task, but it’s pretty clear how to build such a system.
What if we recommend news ? News quickly becomes obsolete - you need to show users fresh articles while they are still relevant. It is necessary to understand the content of the article. Already more difficult.
')
And if we recommend restaurants based on reviews? But we recommend not only a restaurant, but also specific dishes that are worth trying. You can also give recommendations to restaurants about what is worth improving.
What if we even deploy the task and try to answer the question: “Which product will be of interest to the largest group of people?”. It becomes quite unusual and immediately incomprehensible how to solve this.
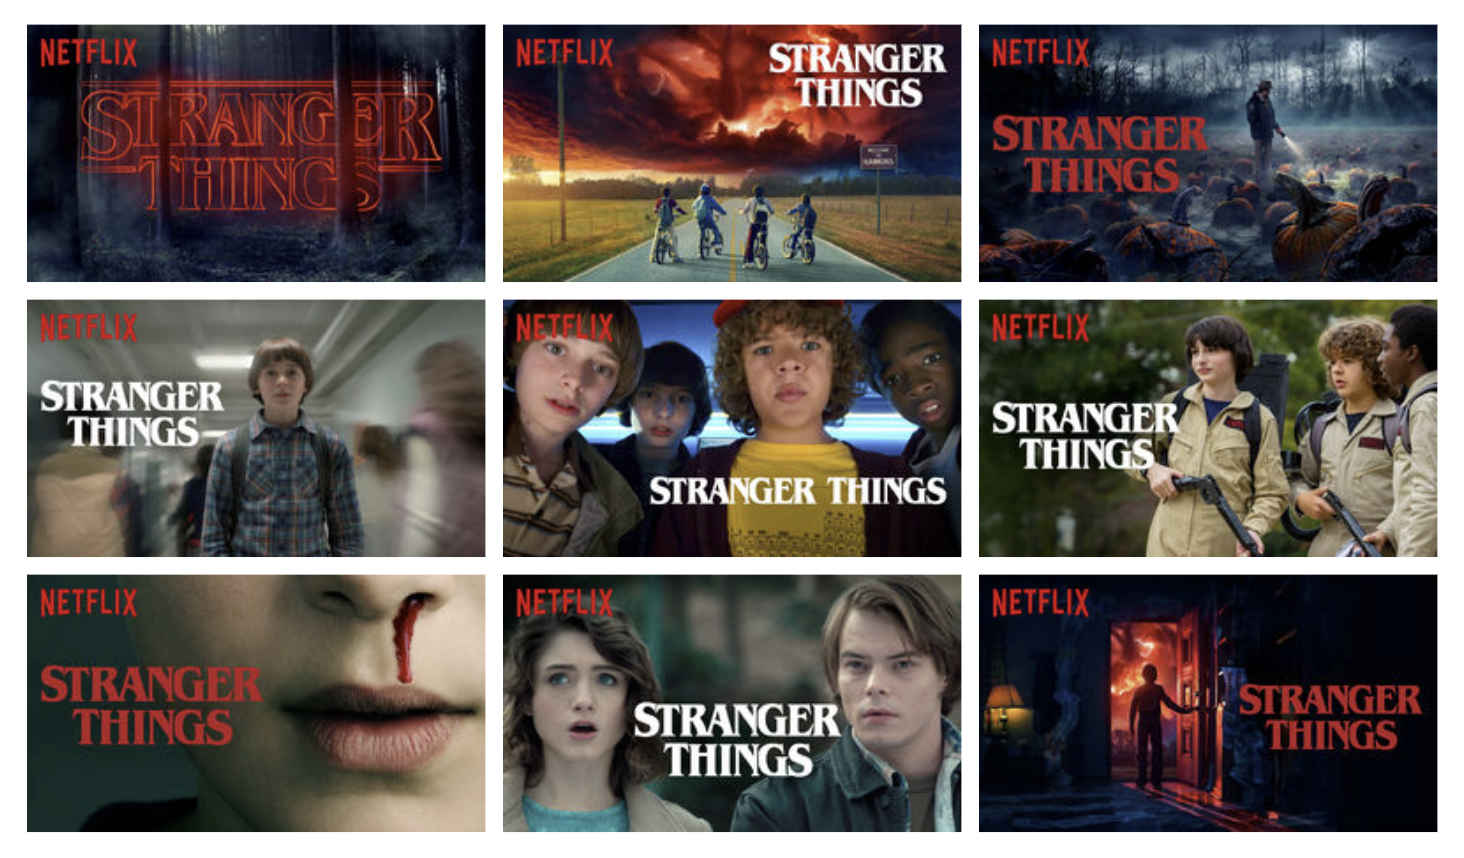
In fact, there are many variations of the task of recommendations, and each has its own nuances. You can recommend completely unexpected things. My favorite example is the Netflix preview thumbnail .
Narrower task
Take the clear and familiar task of recommending music. What exactly do we want to recommend?

In this collage you can find examples of various recommendations from Spotify, Google and Yandex.
- Selection of homogeneous interests in the Daily Mix
- Personalized news Release Radar, Recommended New Releases, Premiere
- Personal selection of what you like - Playlist of the Day
- Personal collection of tracks that the user has not yet heard - Discover Weekly, Déjà Vu
- The combination of the previous two points with a bias in the new tracks - I'm Feeling Lucky
- Is in the library, but not yet heard - Cache
- Your Top Songs 2018
- The tracks that you listened at 14 years old, and which shaped your tastes - Your Time Capsule
- Tracks that you might like, but different from what the user usually listens to - Taste breakers
- Tracks of artists who perform in your city
- Style Collections
- Selection by activity and mood
And you can probably come up with something else. Even if we are absolutely able to predict which tracks the user likes, it still remains to be asked in what form and in what layout to release them.
Classical production
In the classical formulation of the problem, all that we have is the user-item rating matrix. It is very sparse and our task is to fill in the missing values. Usually, RMSE of the predicted rating is used as a metric, however, it is believed that this is not entirely correct and the characteristics of the recommendation as an integer should be taken into account, and not the prediction accuracy of a particular number.
How to evaluate the quality?
Online evaluation
The most preferred way to assess the quality of a system is to directly test users in the context of business metrics. This may be the CTR, the time spent in the system, or the number of purchases. But experiments on users are expensive, and you don’t want to roll out a bad algorithm even to a small group of users, so offline quality metrics are used before online checks.
Offline evaluation
As quality metrics, ranking metrics are commonly used, for example, MAP @ k and nDCG @ k.
Relevance in the context of MAP@k is a binary value, and in the context of nDCG@k , there may be a rating scale.But, in addition to the accuracy of the prediction, we may be interested in other things:
- overage - the share of goods that is issued by the referee
- personalization - how different are the recommendations between users,
- diversity - how diverse the goods are inside the recommendation.
In general, there is a good overview of the metrics. How good is your recommender system is? A survey on evaluations in recommendation . An example of the formalization of novelty metrics can be found in the Novelty and Diversity Metrics for Recommender Systems .
Data
Explicit feedback
The score matrix is an example of explicit data. Like, dislike, rating - the user himself clearly expressed the degree of his interest in the item. Such data is usually small. For example, in the Rekko Challenge competition in test data, at least one rating is only for 34% of users.
Implicit feedback
Much more information is available about implicit preferences - views, clicks, adding to bookmarks, setting up notifications. But if the user watched the movie - it means only that before watching the movie seemed to him quite interesting. Direct conclusions about whether the film liked it or not, we can not do.
Loss functions for training
To use implicit feedback, have come up with appropriate teaching methods.
Bayesian Personalized Ranking
Original article .
It is known with which items the user interacted. We assume that these are positive examples that he liked. There are many items that the user has not interacted with. We do not know which of them will be interesting to the user, and which will not, but we certainly know that not all of these examples will be positive. We make a rough generalization and consider the absence of interaction a negative example.

We will sample triples {user, positive item, negative item} and penalize the model if the negative example is rated higher than the positive one.

Weighted Approximate-Rank Pairwise
Add to the previous idea of adaptive learning rate. We will evaluate the system's training, based on the number of samples that we had to look through in order for this pair of {user, positive example} to find a negative example, which the system rated above positive.
If we found such an example from the first, then the penalty should be large. If you had to search for a long time, then the system is already working well and you do not need to penalize so much.
What else is worth thinking about?
Cold start

As soon as we learned to make predictions for existing users and products, two questions arise: - “How to recommend a product that no one has yet seen?” And “What to recommend to a user who does not have a single assessment yet?”. To solve this problem, try to extract information from other sources. It can be data about a user from other services, a questionnaire during registration, information about an item from its content.
At the same time, there are tasks for which the state of cold start is constant. In Session Based Recommenders you need to have time to understand something about the user during the time that he is on the site. New items are constantly appearing in news or product recommenders, and old ones quickly become obsolete.
Long tail
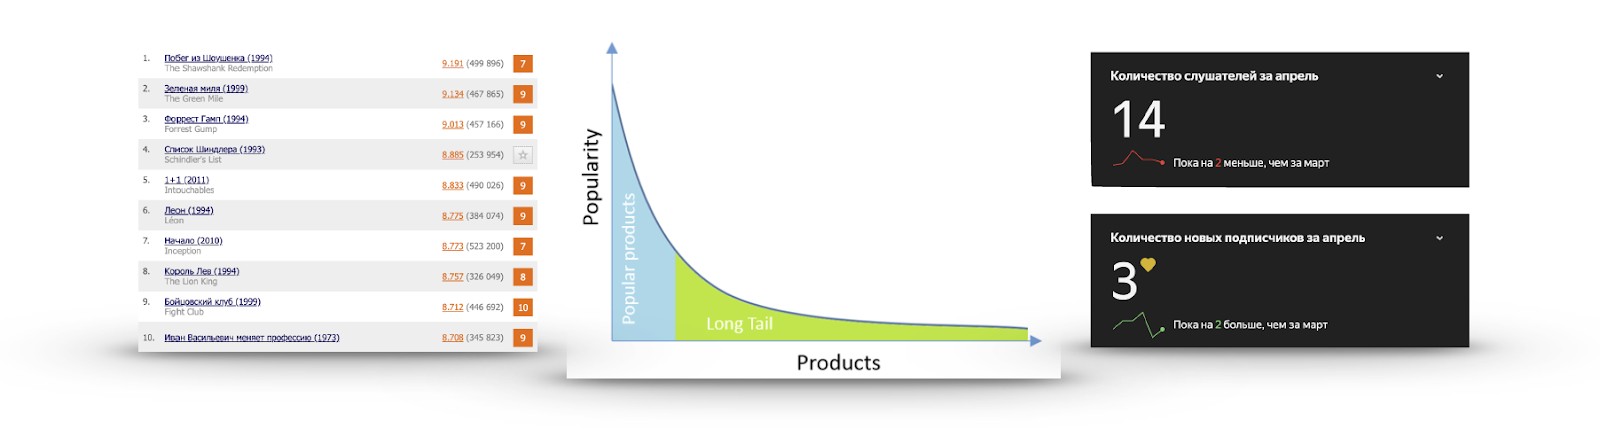
If for each item to count its popularity in the form of the number of users who interacted with it or gave a positive assessment, then very often the graph will be obtained as in the image:
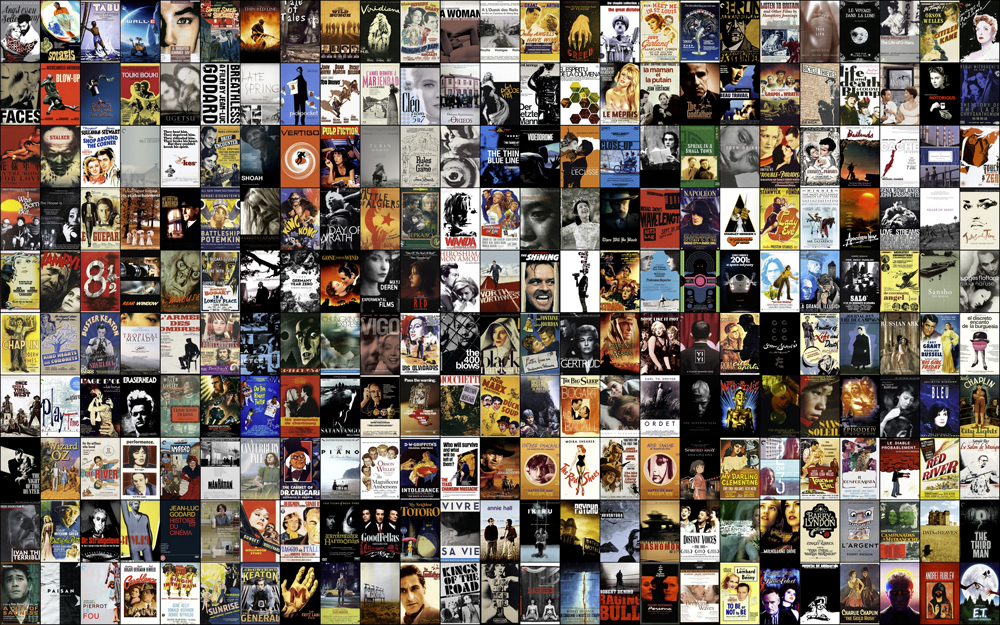
There is a very small number of items that everyone knows about. There is no point in recommending them, because the user most likely either has already seen them and simply did not rate them, either he knows and is going to watch about them, or is determined not to look at all. I have repeatedly watched the Schindler List trailer, but I was not going to see it.
On the other hand, popularity very quickly falls, and almost no one has seen the overwhelming number of items. It is more useful to make recommendations from this part: there is interesting content that the user can hardly find himself. For example, on the right, the listening statistics of one of my favorite groups on Yandex.Music.
Exploration vs Exploitation
Suppose we know exactly what the user likes. Does this mean we should recommend the same thing? There is a feeling that such recommendations get bored quickly and sometimes it is worthwhile to show something new. When we recommend what exactly should please - this is exploitation. If we try to add something less popular to the recommendations or somehow diversify them - this is exploration. I want to balance these things.
Non-personalized recommendations
The easiest option is to recommend the same to everyone.
Sort by popularity
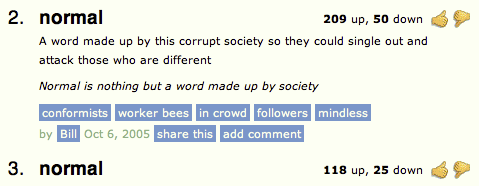
Score = (Positive ratings) - (Negative ratings)
You can subtract dislikes from the likes and sort them. But in this case, we do not take into account their percentage. There is a feeling that 200 likes 50 dislikes is not the same as 1200 likes and 1050 dislikes.
Score = (Positive ratings) / (Total ratings)
You can divide the number of likes by the number of dislikes, but in this case we do not take into account the number of ratings and a product with one rating of 5 points will be ranked higher than a very popular product with an average rating of 4.8.
How not to sort by average rating and take into account the number of ratings? Calculate the confidence interval: “Based on the available estimates, with a probability of 95%, the true share of positive ratings is at least some?”. The answer to this question was given by Edwin Wilson in 1927.
- the observed share of positive ratings
- 1-alpha quantile of normal distribution
Inconsistency
Selection of frequently occurring sets of products includes a whole group of pattern mining tasks: periodic pattern mining , sequential rule mining , sequential pattern mining , high-utility itemset mining , frequent itemset mining (basket analysis) . For each specific task there will be its own methods , but if it is crudely generalized, the algorithms for searching for frequent sets perform an abbreviated search for width, trying not to go through obviously bad options.
Cutting off of rare sets occurs at the specified boundary support - the number or frequency of occurrence of the set in the data.

After selecting a frequent itemset, the quality of their dependencies is estimated using the Lift or Confindence (a, b) / Confidence (! A, b) metrics. They aim to remove false dependencies.
For example, bananas can often be found in a grocery basket along with canned food. But the point is not in any special connection, but in the fact that bananas are popular on their own, and this should be taken into account when searching for conspicuousness.
Personalized recommendations
Content-Based
The idea of a content-based approach is to create a vector of his preferences in the space of objects for the user’s actions history and recommend products that are close to this vector.
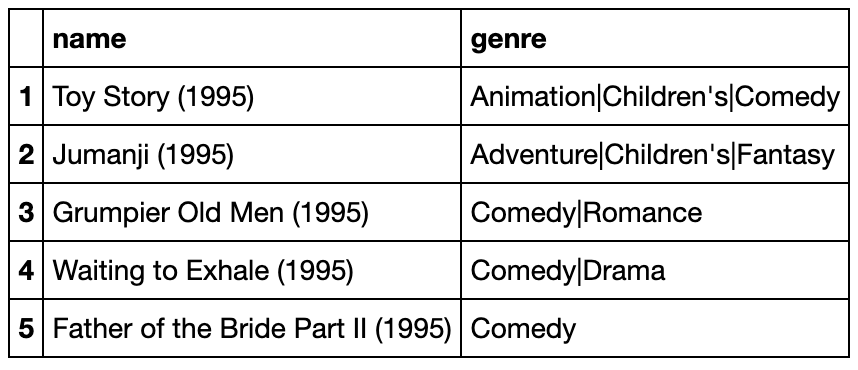
That is, an item should have some indicative description. For example, these may be movie genres. The history of likes and dizlaik films forms a vector of preferences,
highlighting some genres and avoiding others. By comparing the user vector and the vector of the item, you can make a ranking and get recommendations.
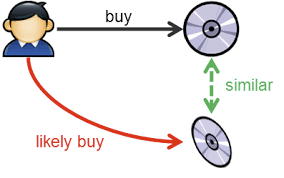
Collaborative filtering

Collaborative filtering assumes a user-item rating matrix. The idea is to find the most similar "neighbors" for each user and fill in the gaps of a specific user, weighted average ratings of "neighbors".
Similarly, you can look at the similarity of items, assuming that similar items like similar people. Technically, this would be simply a consideration of the transposed estimation matrix.
Users use the rating scale differently - someone never sets above eight, and someone uses the entire scale. This is useful to consider, and therefore it is possible to predict not the rating itself, but a deviation from the average rating.
Or you can normalize the estimates in advance.
Matrix Factorization
We know from mathematics that any matrix can be decomposed into a product of three matrices. But the rating matrix is very sparse, 99% is common. And SVD doesn't know what skips are. Fill them with the average value is not very desirable. And in general, we are not very interested in the matrix of singular values - we just want to get a hidden view of users and objects, which, when multiplied, will approximate the true rating. You can immediately decompose into two matrices.

What to do with the passes? To hammer on them. It turned out that it is possible to train to approximate ratings on the RMSE metric with the help of SGD or ALS, generally ignoring gaps. The first such algorithm is Funk SVD , which was invented in 2006 during the decision of a competition from Netflix.
Netflix prize
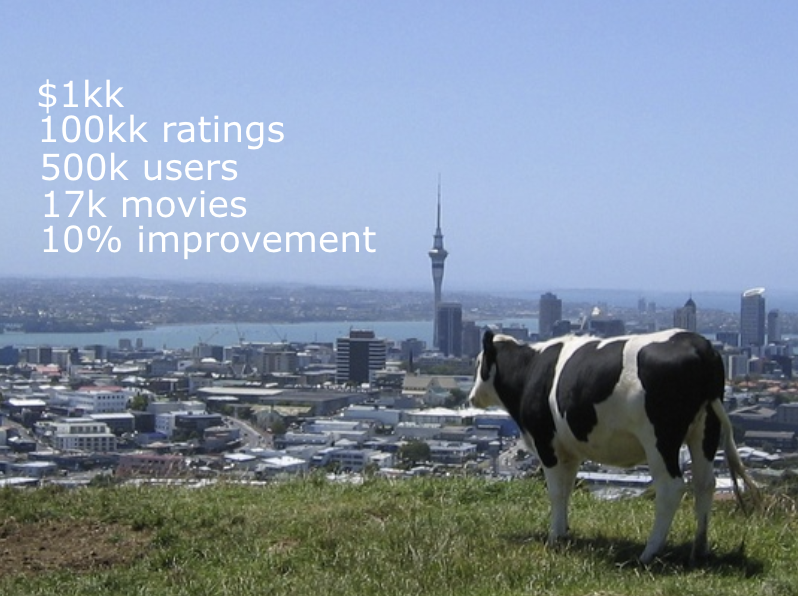
Netflix Prize - a significant event that gave a strong impetus to the development of recommender systems. The goal of the competition is to overtake the existing Cinematch recommendation system for the RMSE metric by 10%. For this, a large dataset was provided at that time, containing 100 million assessments. The task may not seem so difficult, but to achieve the required quality it was necessary to rediscover the competition two times - the solution was received only in the 3rd year of the competition. If it were necessary to obtain an improvement of 15%, perhaps this would not have been achieved on the data provided.
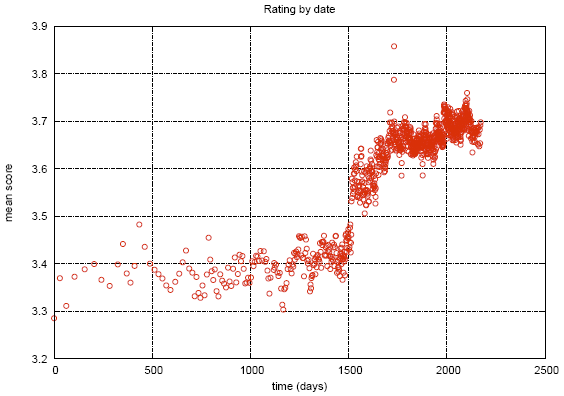
During the competition some interesting things were found in the data. The graph shows the average rating of the films, depending on the date it appeared in the Netflix catalog. The apparent gap is attributed to the fact that at this time Netflix switched from an objective scale (a bad film, a good film) to a subjective one (I didn’t like it, I really liked it). People are less critical when they express their assessment, and not the characteristics of the object.
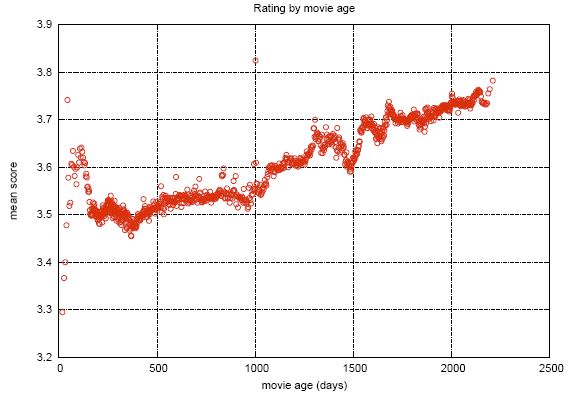
This graph shows how the average rating of films changes after release. It can be seen that for 2000 days the estimate rises by 0.2. That is, after the film has ceased to be new, those who are quite sure that he will like the film, which improves the rating, start watching it.
The first intermediate prize was taken by a team of specialists from AT & T - Korbell. After 2000 hours of work and the compilation of an ensemble of 107 algorithms, they managed to get an improvement of 8.43%.

Among the models was a variation of SVD and RBM, which themselves gave most of the contribution. The remaining 105 algorithms improved only one hundredth of the metric. Netflix has adapted these two algorithms for its data volumes and still uses them as part of the system.
In the second year of the competition, the two teams merged and now the Bellkor in BigChaos prize was awarded. They summed up a total of 207 algorithms and improved the accuracy by another hundredth, reaching a value of 0.8616. The required quality has not yet been achieved, but it is already clear that everything should work out next year.
Third year. Joining with another team, renaming to Bellkor's Pragmatic Chaos and achieving the required quality, slightly behind The Ensemble. But this is only the public part of the dataset.

On the hidden part, it turned out that the accuracy of these commands coincides to the fourth decimal place, so the winner was determined by the commit difference of 20 minutes.

Netflix paid the promised million winners, but never used the solution . Implementing the resulting ensemble turned out to be too expensive, and there is not so much benefit from it - after all, only two algorithms already provide most of the increase in accuracy. And most importantly - at the time of the end of the competition in 2009, Netflix for two years already began to engage in its streaming service besides renting a DVD. They had many other tasks and data that they could use in their system. However, their postal DVD rental service still serves 2.7 million happy subscribers .

Neural networks
In modern recommender systems, a common question is how to take into account various explicit and implicit sources of information. Often there are additional data about the user or item and want to use them. Neural networks are a good way to account for such information.
In the issue of the use of networks for recommendations should pay attention to the review of the Deep Learning Based Recommender System: A Survey and New Perspectives . It describes examples of the use of a large number of architectures in relation to various tasks.
There are a lot of architectures and approaches. One of the duplicate names is DSSM . I would also like to mention Attentive Collaborative Filtering .

ACF prompts for two levels of attenuation:
- Even with the same ratings, some items will contribute more to your preferences than others.
- Aitems are not atomic, but consist of components. Some have a greater impact on the assessment than others. The film may be interesting only due to the presence of a favorite actor.

Multi-armed bandits - one of the most popular themes of recent times. What is multi-armed bandits can be found in the article on Habré or Medium .
Applied to recommendations, the Contextual-Bandit task will sound like this: “We feed user and item context vectors to the system, we want to maximize the likelihood of interaction (click, purchase) for all users over time, making frequent updates to the recommendation policy”. Such a formulation naturally solves the problem of exploration vs exploitation and allows you to quickly roll out the optimal strategies for all users.

In the wake of the popularity of the transformer architecture, there are also attempts to use them in recommendations. Next Item Recommendation with Self-Attention attempts to combine long-term and recent user preferences to improve recommendations.
Instruments
Recommendations are not such a popular topic as CV or NLP, so in order to use the latest grid architectures you will either have to implement them yourself, or hope that the author’s implementation is quite convenient and understandable. However, some basic tools do exist:
Conclusion
Recommender systems are far from the standard setting for completing the rating matrix, and there will be nuances in each specific area. This introduces difficulties, but also adds interest. In addition, it is difficult to separate the recommendation system from the product as a whole. After all, not only the list of items is important, but also the method and context of submission. What, how, to whom and when to recommend. All this determines the impression of interaction with the service.
Source: https://habr.com/ru/post/453792/
All Articles