Selenium WebDriver - Real-time test metrics using Grafana and InfluxDB
Hello! Next week will start classes in the group "Java QA Engineer" . This will coincide with the current publication.

Daily execution of automated regression tests as part of the daily assembly is inevitable at the moment. Nice to find and report errors immediately after they are found. At the same time, it is problematic to conduct hundreds of automated tests and remote parallel execution. As soon as you have a set of automated regression tests, you can break it into several sets of business modules and run them in parallel, as part of daily automated regression testing. Most of these test cases are executed on a remote virtual machine, and test results are available only after its execution. Otherwise, you can look at the jenkins console to see the logs of the test execution process. Sometimes it's annoying. It would be great to have an application that would display information about passing the test while executing them on remote virtual machines.
')
Let's see how you can create a simple page with test results and a dashboard using InfluxDB and Grafana.
We will collect all available test metrics, such as:
Some of the indicators we can get in real time, as shown below:
InfluxDB is a time series database that is used to collect all test metrics. InfluxDB has a REST API for recording data and sending requests. You can find out more here . Below I use the docker command to launch an instance of InfluxDB.
We have already raised and running the database InfluxDB. Let's create a separate database schema to collect the results of the Selenium tests. Below, I run a command in the terminal to create a schema called “selenium” in the database. (Check the URL address, replace localhost with hostname / ipaddress if you are not running on the current computer).
Let's create a simple test testNG:
Our goal is to collect test results in InfluxDB at runtime. So, we need a driver / library in Java for InfluxDB.
Add the Maven dependencies listed below:
TestNG listeners are great for listening to events and can react depending on the event that occurred. First, let's create a simple class that is responsible for sending the results to InfluxDB.
Now we will create another class that implements the ITestListener interface.
The listener from the example above will monitor the test execution and as soon as a certain test method / class is executed, it will send the name, duration, and some additional details. My goal here is just to give you an idea. Change the code according to your needs.
Now add the listener to the XML package or to the TestNG base class.
Or:
We have achieved sending results to InfluxDB. But how to request results and visualize the data? For this we will use another free tool called “Grafana”.
Grafana is a great visualization tool for time series data, it works great with InfluxDB. Below are the docker commands to create a Grafana instance. [piechart plugin is optional in the command, it can be removed if it is not needed]
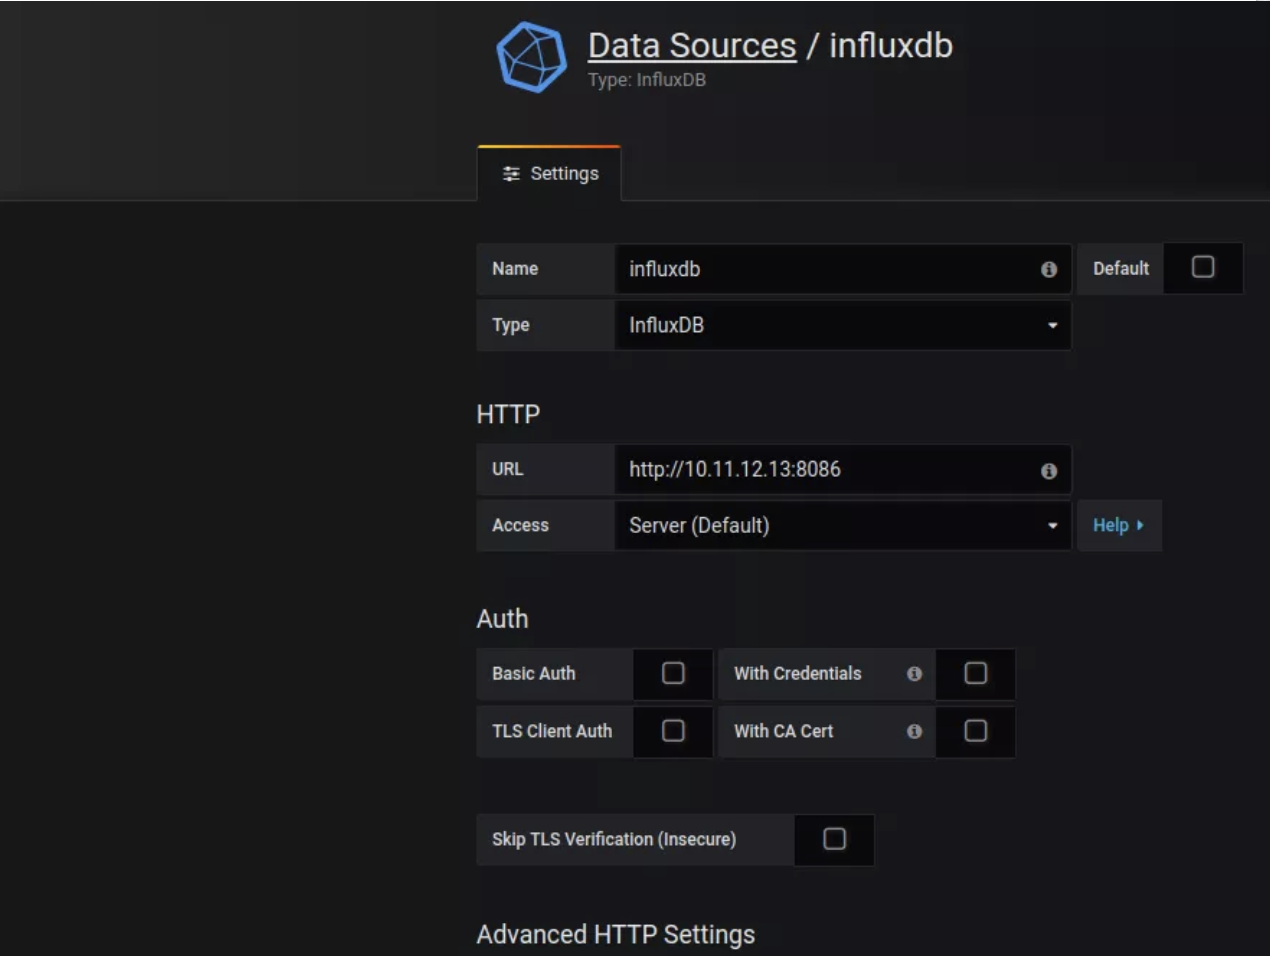
Go to Settings -> Data sources -> Add new data source , as shown in the screenshot. Click on the 'Save & Test' button to make sure Grafana can communicate with InfluxDB.
I would like you to watch this video, since it’s not easy to explain all the nuances in the article. That's why I recorded a hotel video.
Demo 2:
I hope that getting results in real time using InfluxDB and Grafana has turned out to be interesting and useful for you. It requires minimal changes to the existing structure, because we use TestNG listeners. Removing the listener from the file of the set / base class is enough to disable this feature if you do not need it. This approach will help to avoid some frustration in the team, if its members are only engaged in monitoring test results through console input / output on a remote machine. This article just sets out the main idea. You can improve this approach by adding more information, such as a test environment, add additional filters to update the data in the charts for a specific environment / tests, etc.
Here is such a short, but quite useful material. Traditionally, we are waiting for your comments, and also remind you that today will be an open day on the course, which anyone can sign up for.
Overview:
Daily execution of automated regression tests as part of the daily assembly is inevitable at the moment. Nice to find and report errors immediately after they are found. At the same time, it is problematic to conduct hundreds of automated tests and remote parallel execution. As soon as you have a set of automated regression tests, you can break it into several sets of business modules and run them in parallel, as part of daily automated regression testing. Most of these test cases are executed on a remote virtual machine, and test results are available only after its execution. Otherwise, you can look at the jenkins console to see the logs of the test execution process. Sometimes it's annoying. It would be great to have an application that would display information about passing the test while executing them on remote virtual machines.
')
Let's see how you can create a simple page with test results and a dashboard using InfluxDB and Grafana.
Purpose:
We will collect all available test metrics, such as:
- Test Method Status
- The duration of the test method
- Class status with test methods
- Test time per class
- Test suite status
- The duration of the test suite
Some of the indicators we can get in real time, as shown below:
- The number of test methods grouped by status (for example: Pass: 30, Failed: 2, Skipped: 2) on a particular day.
- The trend in the duration of a set of tests for the week, month, year, etc.
InfluxDB:
InfluxDB is a time series database that is used to collect all test metrics. InfluxDB has a REST API for recording data and sending requests. You can find out more here . Below I use the docker command to launch an instance of InfluxDB.
sudo docker run -p 8086:8086 -v $PWD:/var/lib/influxdb influxdb Database creation:
We have already raised and running the database InfluxDB. Let's create a separate database schema to collect the results of the Selenium tests. Below, I run a command in the terminal to create a schema called “selenium” in the database. (Check the URL address, replace localhost with hostname / ipaddress if you are not running on the current computer).
curl -i -XPOST http://localhost:8086/query --data-urlencode "q=CREATE DATABASE selenium" TestNG:
Let's create a simple test testNG:
public class SampleTest { @Test(description = "login") public void login(){ } @Test(description = "search for flights", dependsOnMethods = "login") public void search(){ } @Test(description = "select flight", dependsOnMethods = "search") public void select(){ } @Test(description = "book flight", dependsOnMethods = "select") public void book(){ } @Test(description = "logout", dependsOnMethods = "book") public void logout(){ } } Our goal is to collect test results in InfluxDB at runtime. So, we need a driver / library in Java for InfluxDB.
Maven dependencies:
Add the Maven dependencies listed below:
<dependency> <groupId>org.influxdb</groupId> <artifactId>influxdb-java</artifactId> <version>2.12</version> </dependency> Listeners:
TestNG listeners are great for listening to events and can react depending on the event that occurred. First, let's create a simple class that is responsible for sending the results to InfluxDB.
import org.influxdb.InfluxDB; import org.influxdb.InfluxDBFactory; import org.influxdb.dto.Point; public class ResultSender { private static final InfluxDB INFLXUDB = InfluxDBFactory.connect("http://localhost:8086", "root", "root"); private static final String DATABASE = "selenium"; static{ INFLXUDB.setDatabase(DATABASE); } public static void send(final Point point){ INFLXUDB.write(point); } } Now we will create another class that implements the ITestListener interface.
import org.influxdb.dto.Point; import org.testng.ITestContext; import org.testng.ITestListener; import org.testng.ITestResult; import java.util.concurrent.TimeUnit; public class ExecutionListener implements ITestListener { public void onTestStart(ITestResult iTestResult) { } public void onTestSuccess(ITestResult iTestResult) { this.sendTestMethodStatus(iTestResult, "PASS"); } public void onTestFailure(ITestResult iTestResult) { this.sendTestMethodStatus(iTestResult, "FAIL"); } public void onTestSkipped(ITestResult iTestResult) { this.sendTestMethodStatus(iTestResult, "SKIPPED"); } public void onTestFailedButWithinSuccessPercentage(ITestResult iTestResult) { } public void onStart(ITestContext iTestContext) { } public void onFinish(ITestContext iTestContext) { this.sendTestClassStatus(iTestContext); } private void sendTestMethodStatus(ITestResult iTestResult, String status) { Point point = Point.measurement("testmethod") .time(System.currentTimeMillis(), TimeUnit.MILLISECONDS) .tag("testclass", iTestResult.getTestClass().getName()) .tag("name", iTestResult.getName()) .tag("description", iTestResult.getMethod().getDescription()) .tag("result", status) .addField("duration", (iTestResult.getEndMillis() - iTestResult.getStartMillis())) .build(); ResultSender.send(point); } private void sendTestClassStatus(ITestContext iTestContext) { Point point = Point.measurement("testclass") .time(System.currentTimeMillis(), TimeUnit.MILLISECONDS) .tag("name", iTestContext.getAllTestMethods()[0].getTestClass().getName()) .addField("duration", (iTestContext.getEndDate().getTime() - iTestContext.getStartDate().getTime())) .build(); ResultSender.send(point); } } Note: Use the optional tag that matches your objectives in the example above to classify the results. For example tag (“scenario”, “login flow”).
The listener from the example above will monitor the test execution and as soon as a certain test method / class is executed, it will send the name, duration, and some additional details. My goal here is just to give you an idea. Change the code according to your needs.
Now add the listener to the XML package or to the TestNG base class.
<suite name="My suite"> <listeners> <listener class-name="com.tag.realtime.ExecutionListener" /> </listeners> <test name="Test1"> <classes> <class name="com.tag.realtime.SampleTest"/> </classes> </test> <test name="Test2"> <classes> <class name="com.tag.realtime.Sample2Test"/> </classes> </test> </suite> Or:
@Listeners(ExecutionListener.class) public class SampleTest { @Test public void test(){ } } Grafana:
We have achieved sending results to InfluxDB. But how to request results and visualize the data? For this we will use another free tool called “Grafana”.
Grafana is a great visualization tool for time series data, it works great with InfluxDB. Below are the docker commands to create a Grafana instance. [piechart plugin is optional in the command, it can be removed if it is not needed]
docker run -d -p 3000:3000 --name=grafana \ -e "GF_INSTALL_PLUGINS=grafana-piechart-panel" \ -v $PWD:/var/lib/grafana \ grafana/grafana Data source for Grafana:
Go to Settings -> Data sources -> Add new data source , as shown in the screenshot. Click on the 'Save & Test' button to make sure Grafana can communicate with InfluxDB.
Note: If you use Grafana with Docker and are trying to access as 'Server default', DO NOT use localhost in the connection line to InfluxDB. That's because localhost is a Grafana container, not a physical machine. Thus the Grafana container will not be able to find InfluxDB.
Creating a dashboard:
I would like you to watch this video, since it’s not easy to explain all the nuances in the article. That's why I recorded a hotel video.
Demo 2:
Summarize:
I hope that getting results in real time using InfluxDB and Grafana has turned out to be interesting and useful for you. It requires minimal changes to the existing structure, because we use TestNG listeners. Removing the listener from the file of the set / base class is enough to disable this feature if you do not need it. This approach will help to avoid some frustration in the team, if its members are only engaged in monitoring test results through console input / output on a remote machine. This article just sets out the main idea. You can improve this approach by adding more information, such as a test environment, add additional filters to update the data in the charts for a specific environment / tests, etc.
Here is such a short, but quite useful material. Traditionally, we are waiting for your comments, and also remind you that today will be an open day on the course, which anyone can sign up for.
Source: https://habr.com/ru/post/452908/
All Articles