Post-mortem debugging on Cortex-M
Post-mortem debugging on Cortex-M
Background:
I recently participated in the development of an atypical for me device from the class of consumer electronics. It seems nothing complicated, the box, which must sometimes come out of sleep mode, report to the server and fall asleep back.
Practice quickly showed that the debugger does not help much when working with a microcontroller, which constantly goes into deep sleep mode or cuts down on food. Basically, because the box was in test mode without a debugger and without me, and sometimes buggy. About once every few days.
On the snot, the debug UART was bolted into which I began to log. It became easier, some problems were solved. But then there was an assert and everything turned out.
#define USER_ASSERT( statement ) \ do \ { \ if(! (statement) ) \ { \ DEBUG_PRINTF_ERROR( "Assertion on line %d in file %s!\n", \ __LINE__, __FILE__ ); \ \ __disable_irq(); \ while(1) \ { \ __BKPT(0xAB); \ if(0) \ break; \ } \ } \ } while(0) __BKPT(0xAB) is a software breakpoint; if an assert occurs under debugging, then the debugger simply stops at the problem line, which is very convenient.
For some asserts, it is immediately clear what caused them - because in the log you can see the file name and the line number on which the assertion worked.
But according to the assertion that was happening, it was only clear that the array was overflowed - more precisely, a self-made wrapper over the array, which checks for overflow. Because of this, only the file name “super_array.h” and the line number in it were visible in the log. And which particular array is not clear. From the surrounding logs is also unclear.
Of course, it would be possible to just bite the bullet and go read my code, but I was too lazy, and then the article would not have turned out.
As I write in uVision Keil 5 with the armcc compiler, further code is checked only under it. I also used C ++ 11, because it is already 2019 in the yard, it's time already.
Stacktrace
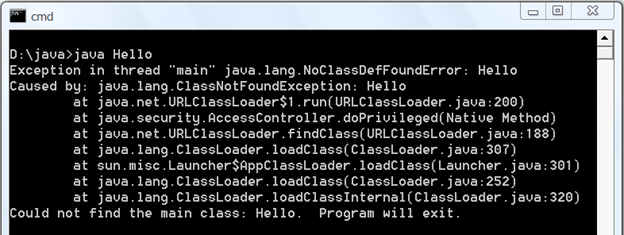
Of course, the first thing that comes to mind is but a pancake, because when an assert occurs on a normal desktop computer, a glass trace is output to the console, such as on the KDPV. It is usually possible to understand from the sequence that the sequence of calls led to the error.
Okay, so I need a glass frame too. How to make it?
Maybe if you throw an exception, he will be displayed?
We throw an exception and do not catch it, we see the output of “SIGABRT” and the call to _sys_exit . Not a ride, well, okay, not very much and wanted to allow exceptions.
Googling how other people do it.
All methods are platform execinfo.h (not too surprising), for gcc under POSIX there is backtrace() and execinfo.h . There was nothing intelligible for Kayla. We're dropping a mean tear. We'll have to get into the stack with our hands.
We climb into the stack with his hands
Theoretically, it's pretty simple.
- The return address of the current function is in the LR register, the address of the current top of the stack (in the sense of the last element in the stack) is in the SP register, the address of the current command is in the RS register.
- Somehow we find the size of the stack frame for the current function, step along the stack for such a distance, find the return address for the previous function there and repeat it until we go through the stack to the end.
- Somehow we associate return addresses with line numbers in source code files.
Okay, for starters - how to know the size of the stack frame?
On the default options - apparently, by no means, it is simply hardcoded by the compiler in the “prologue” and “epilogue” of each function, into commands that allocate and free a piece of stack under the frame.
But, fortunately, armcc has an option - --use_frame_pointer , which allocates the R11 register under the Frame Pointer - i.e. pointer to stack frame of the previous function. Ok, now you can go through all the stack frames.
Now - how to match return addresses with lines in source files?
Damn, again nothing. The debug information in the microcontroller is not flashed (which is not surprising, since it takes up decent space). Is it possible for Kale to still force her to go in there, I don’t know, I couldn’t find it.
Sigh. This means that an honest structure - such that the names of functions and line numbers are immediately output to the debug output - does not work. But you can display the addresses, and then compare them with functions and line numbers on the computer, since there is a debug info in the project.
But it looks very sad, because you have to parse the .map file, which shows the ranges of addresses that each function takes. And then separately parse the files with the disassembled code to find a specific line. There is a sharp desire to score.
Plus, a careful look at the documentation on the --use_frame_pointer option allows --use_frame_pointer to see this page , which says that this option can lead to a HardFault crash at random times. Hmm.
Well, we think further.
How does the debugger do this?
But the debugger somehow shows the call stack, even without a frame pointer'a . Well, it’s clear how, the IDE has all the debug info at hand, it’s not difficult to compare addresses and function names. Hm
At the same time, the same Visual Studio has such a thing - minidump - when a falling application generates a small file, which you then feed the studio and it restores the state of the application at the time of the fall. And you can consider all the variables, take a walk along the stack with comfort. Hmm again.
But it seems to be quite simple. Need only Every day, rub in the buttocks thick Soviet continuation of the link fill the stack with the values that were there at the moment of the fall and, apparently, restore the state of the registers. And everything seems to be?
Again, we divide this idea into subtasks.
- On the microcontroller you need to go through the stack, for this you need to get the current value of SP and the address of the beginning of the stack.
- On the microcontroller you need to display the values of the registers.
- In the IDE, you need to somehow push all the values from the minidump back onto the stack. And register values too.
How to get the current SP value?
It is advisable not maraya hands on the assembler. Fortunately, __current_sp() has a special function (intrinsic) - __current_sp() . The gcc won't work, but I don't need it.
How to get the address of the beginning of the stack? Since I use my script to protect against overflow (about which I wrote here ), I have a stack in a separate linker section, which I called REGION_STACK .
This means that the address of the beginning can be obtained from the linker, with the help of strange variables with dollars in the names .
Using trial and error, select the desired name - Image$$REGION_STACK$$ZI$$Limit , check, work.
This is a magic symbol that is created at the linking stage; therefore, strictly speaking, it is not a constant of the compilation stage.
To use it, you need dereferencing:
extern unsigned int Image$$REGION_STACK$$ZI$$Limit; using MemPointer = const uint32_t *; // , static const auto stack_upper_address = (MemPointer) &( Image$$REGION_STACK$$ZI$$Limit ); If you don’t want to bother like that, then the stack size can simply be hard-coded, since it changes quite rarely. In the worst case, we will see in the call stack window not all calls, but a stub.
How to display register values?
At first I thought that it was necessary to derive all the general-purpose registers in general, I began to stir up mutki with an assembler, but I quickly realized that there would be no sense from this. After all, the minidump output will have a special function for me, there is no sense from the values of the registers in its context.
Only Link Register (LR), which stores the return address from the current function, the SP with which we already figured out, and the Program Counter (PC), which stores the address of the current command, are really needed.
Again, I could not find an option that would work with any compiler, but again Kayla has intrinsic functions: __return_address() for LR and __current_pc() for MS.
Fine. It remains to push all the values from the minidump back onto the stack, and the register values into registers.
How to load minidump into memory?
First, I planned to use the LOAD debugger command, which allows you to load values from a .hex or .bin file into memory, but quickly found out that LOAD for some reason does not load values into RAM.
And I would not be able to fill out the registers with this command anyway.
Well, okay, it would still require too many gestures, convert text to bin, convert bin to hex ...
Fortunately, Kayla has a simulator, and for a simulator you can write scripts in some wretched C-like language. And in this language there is an opportunity to write in memory! To do this, there are special functions like _WDWORD and _WBYTE . We collect all ideas in a heap, and we receive here such code.
#define USER_ASSERT( statement ) \ do \ { \ if(! (statement) ) \ { \ DEBUG_PRINTF_ERROR( "Assertion on line %d in file %s!\n", \ __LINE__, __FILE__ ); \ \ print_minidump(); \ __disable_irq(); \ while(1) \ { \ __BKPT(0xAB); \ if(0) \ break; \ } \ } \ } while(0) // , // , scatter- extern unsigned int Image$$REGION_STACK$$ZI$$Limit; void print_minidump() { // - armcc arm-clang #if __CC_ARM || ( (__ARMCC_VERSION) && (__ARMCC_VERSION >= 6010050)) using MemPointer = const uint32_t *; // , static const auto stack_upper_address = (MemPointer) &(Image$$REGION_STACK$$ZI$$Limit ); // , .. // SP stack_upper_address auto LR = __return_address(); auto PC = __current_pc(); auto SP = __current_sp(); auto i = 0; DEBUG_PRINTF("\nCopy the following function for simulator to .ini-file, \n" "start fresh debug session in simulator and call __load_minidump() from command window.\n" "You should be able to see the call stack in CallStack window\n\n"); DEBUG_PRINTF("func void __load_minidump() {\n "); for( MemPointer stack = (MemPointer)SP; stack <= stack_upper_address; stack++ ) { DEBUG_PRINTF("_WDWORD (0x%p, 0x%08x); ", stack, *stack ); // if( i == 1 ) { DEBUG_PRINTF("\n "); i=0; } else { i++; } } DEBUG_PRINTF("\n LR = 0x%08x;", LR ); DEBUG_PRINTF("\n PC = 0x%08x;", PC ); DEBUG_PRINTF("\n SP = 0x%08x;", SP ); DEBUG_PRINTF("\n}\n"); #endif } To download the minidump, we need to create a .ini file, copy the __load_minidump function into it, add this file to the autorun - Project -> Options for Target -> Debug and in the Use Simulator section, register this .ini file in the “Initialization file” column.
Now we just go into the debugging on the simulator and, without starting debugging, we call the function __load_minidump() in the command window.
And voila, we are teleported to the print_minidump function for the line in which the PC is saved. And in the Callstack + Locals window you can see the call stack.
The function is specifically named with two underscores at the beginning, because if the name of the function or variable in the simulation script coincides with the name in the project code, then Keil will not be able to call it. Standard C ++ prohibits the use of names with two underscores in the beginning, so the likelihood of matching names is reduced.
Basically, that's all. As far as I could verify, the minidump works for both normal functions and interrupt handlers. Whether it will work for any perversions with setjmp/longjmp or alloca - I don’t know, because I don’t practice perversions.
I am quite pleased with what happened; The code is small, from the overhead - the macro for the assert is slightly swollen. In this case, all the boring work on the analysis of the stack fell on the shoulders of the IDE, where it belongs.
Then I googled a bit more and found a similar thing for gcc and gdb - CrashCatcher .
I understand that I have not invented anything new, but I did not manage to find a ready-made recipe leading to a similar result. I would be grateful if they tell me what could have been done better.
')
Source: https://habr.com/ru/post/452704/
All Articles